-
-
-
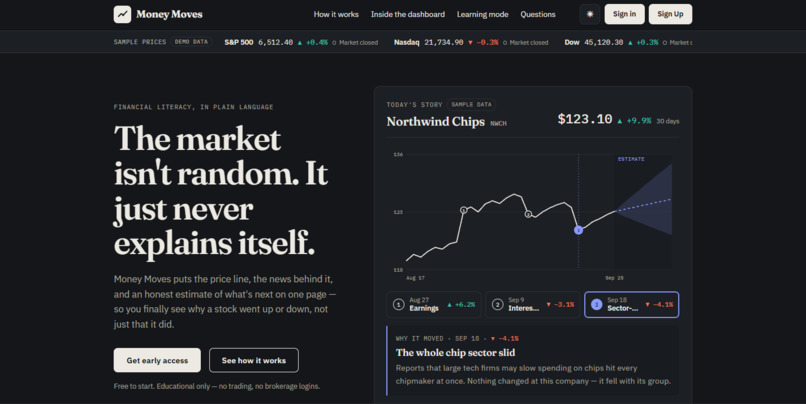
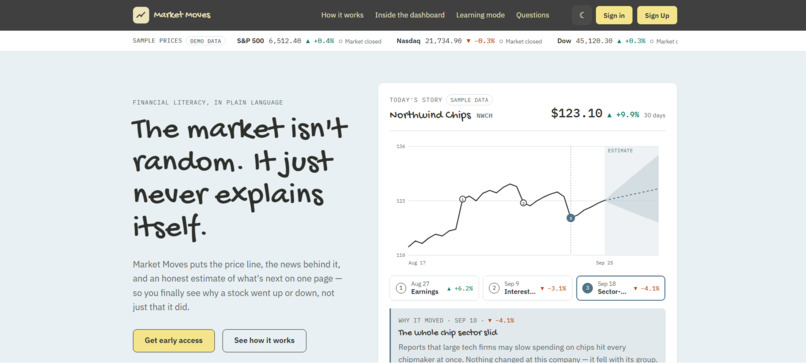
Landing Page
-
-
-
-
Inspiration
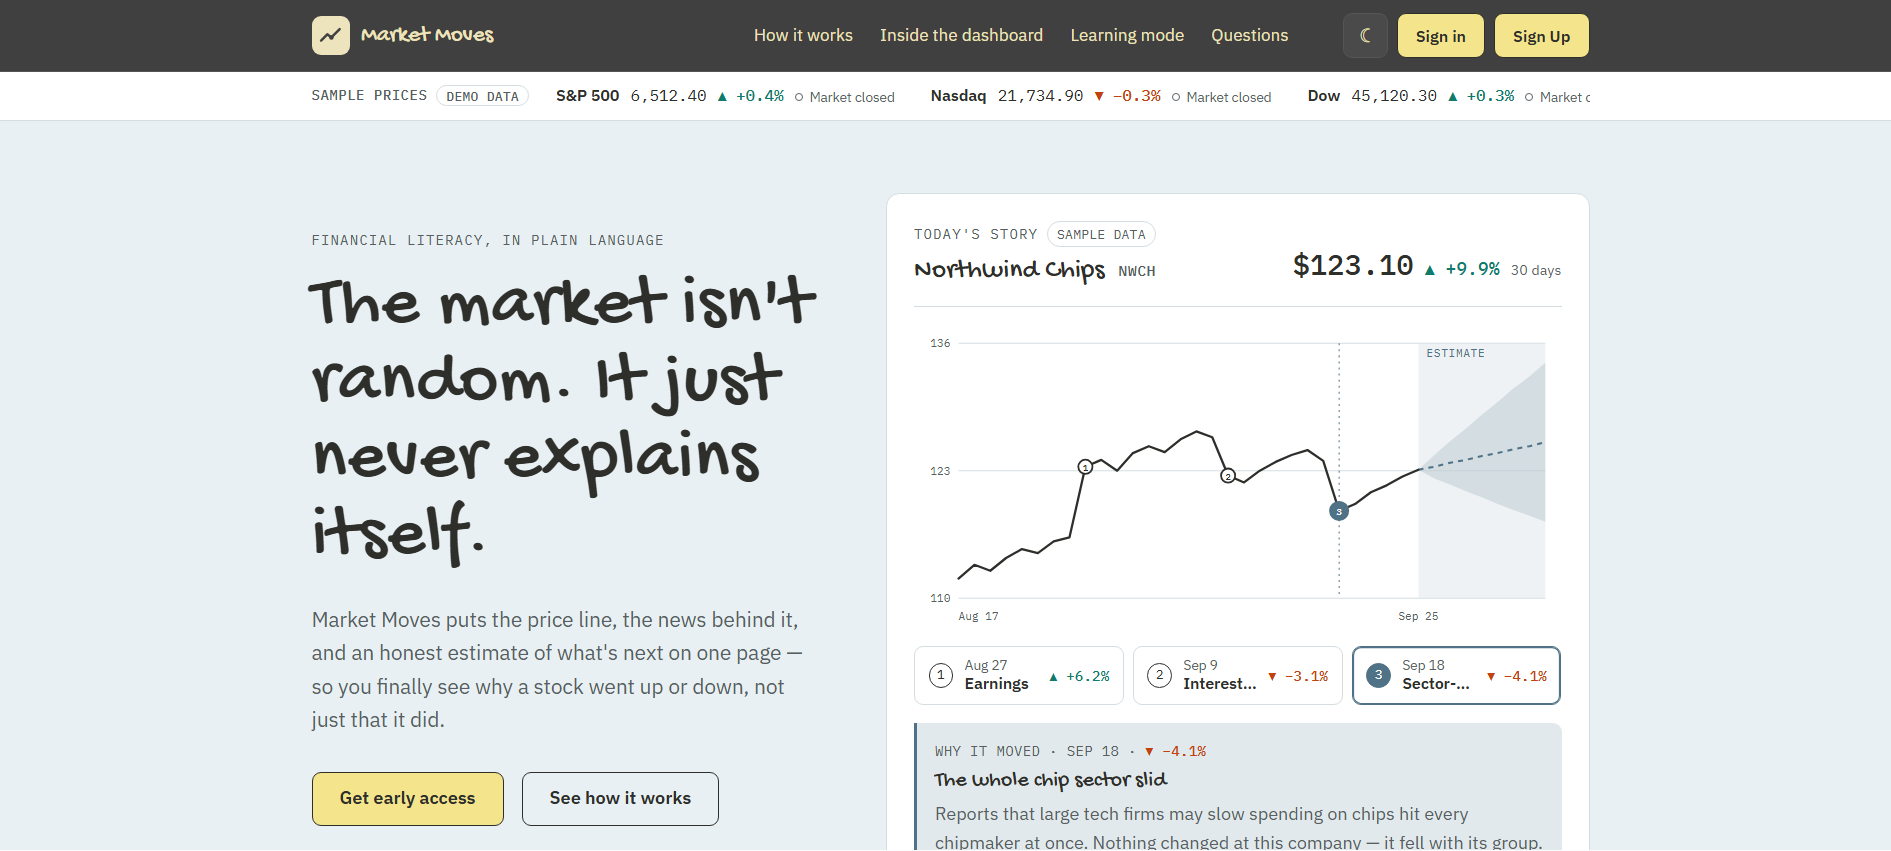
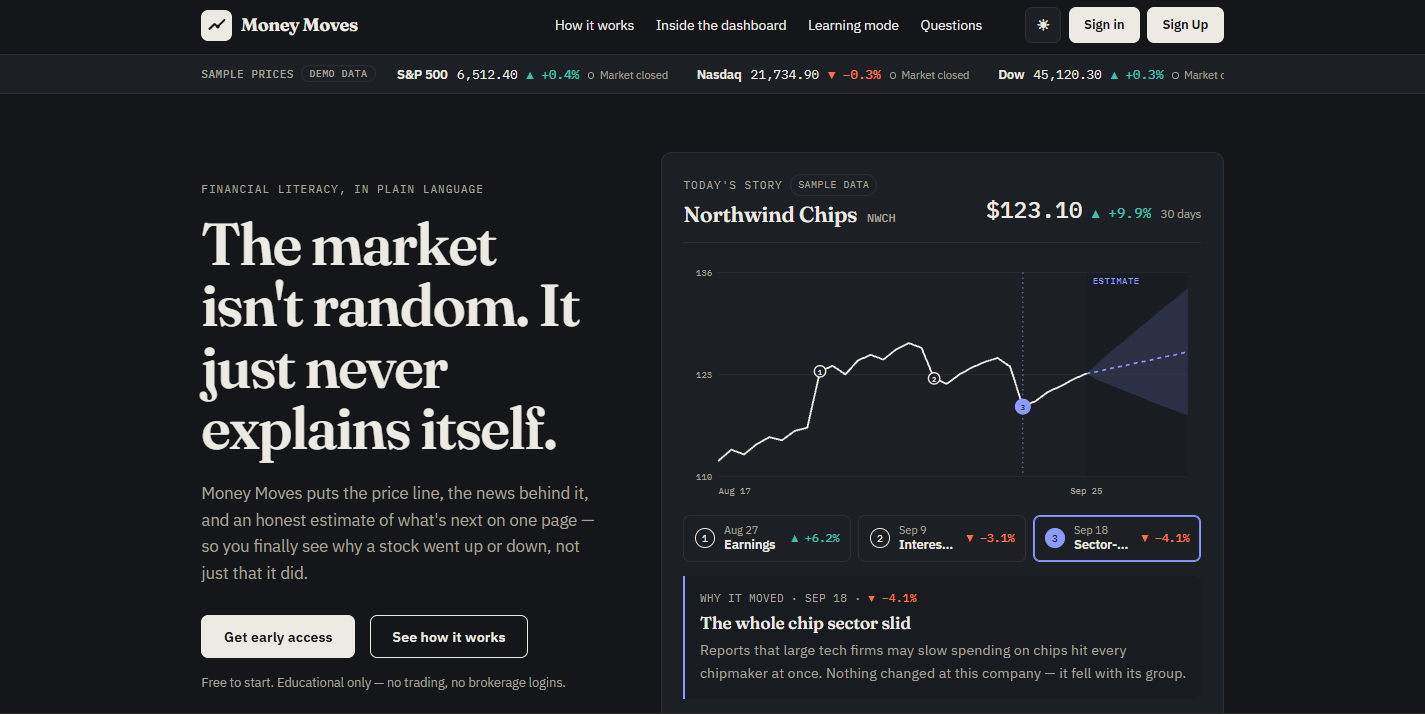
A price chart tells you that something moved. It almost never tells you why, or whether anyone should have expected it. Beginners end up staring at a red or green number and guessing: earnings, interest rates, or the whole sector sliding together.
We wanted one page that answers three questions in plain language:
- What happened?
- Why did it happen?
- What does a room of different traders think might happen next?
The point is financial literacy, not a brokerage. There are no buy or sell buttons, no account linking, and nothing on the site is financial advice.
What it does
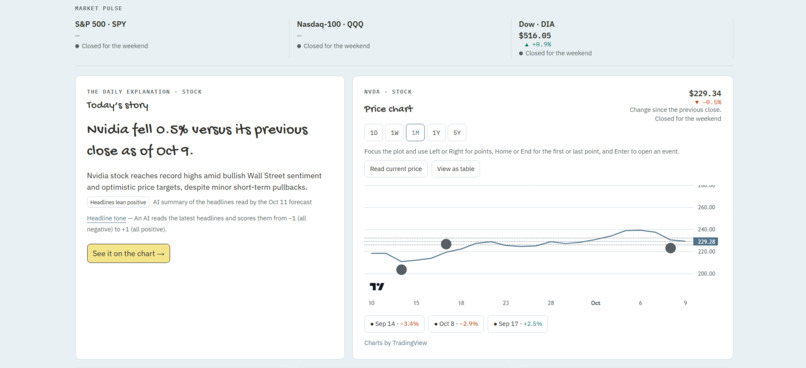
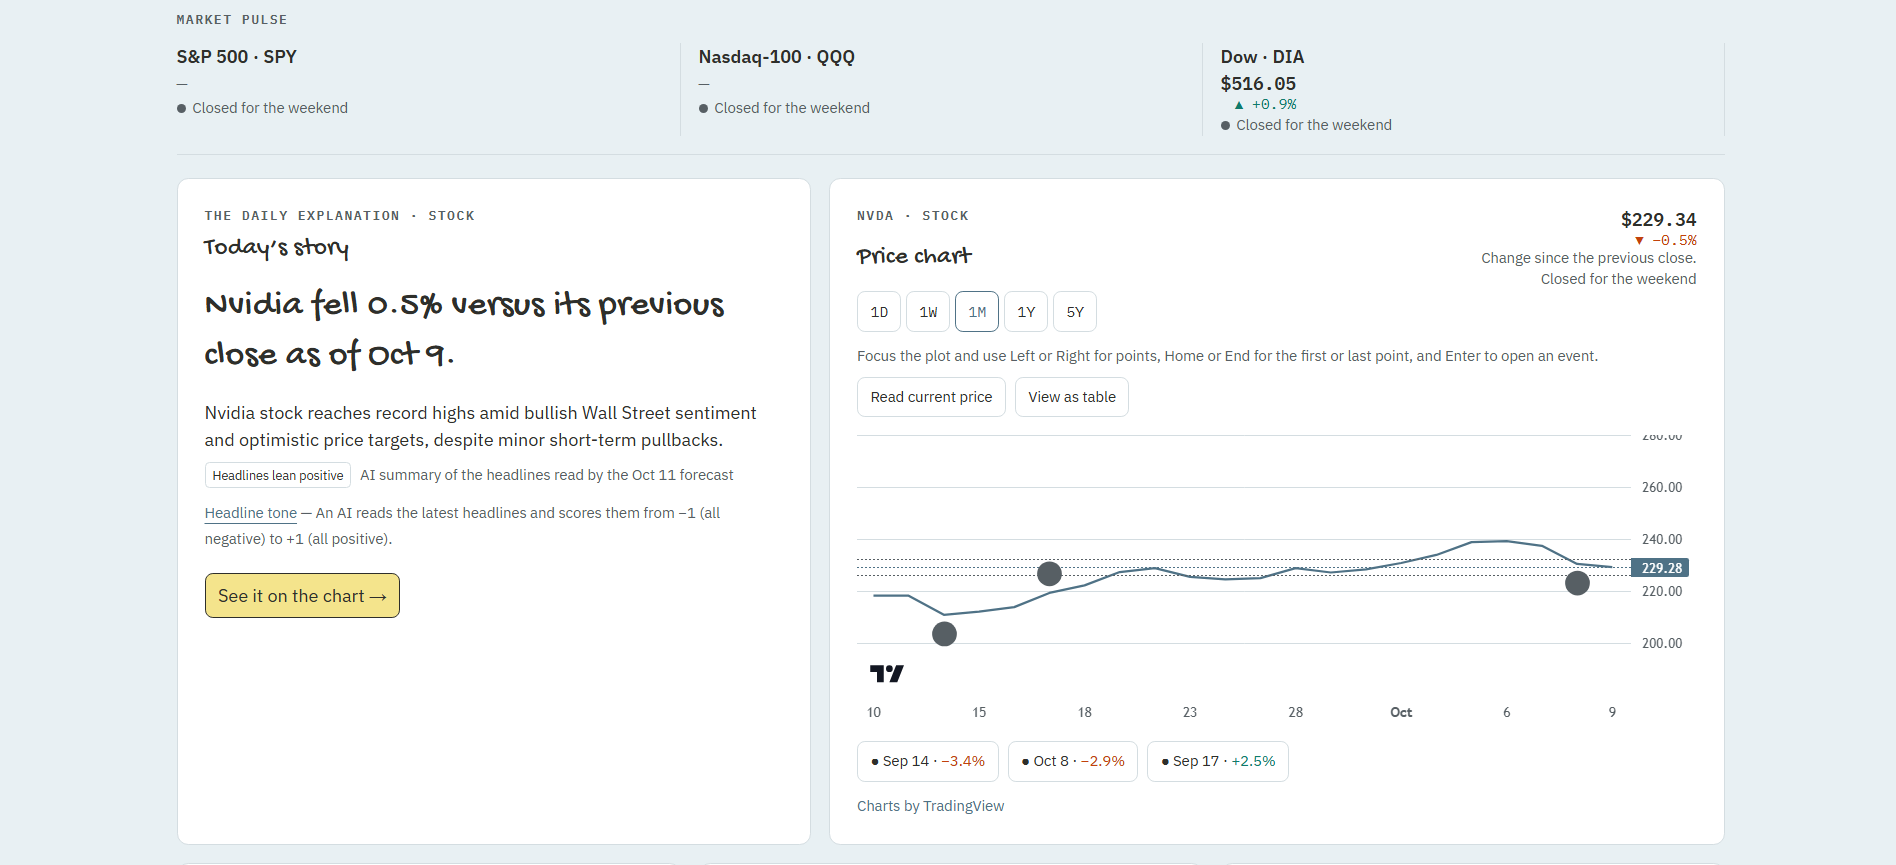
Market Moves is an educational market app. You pick a ticker and the dashboard shows the saved price story, a chart, the biggest moves matched to headlines from that session, related news and filings, and a forecast from thirteen AI trader personas.
The combined call is up, down, flat, or unclear.
- Flat means the price is expected to stay inside a volatility band.
- Unclear means the personas disagree or lean only weakly.
- The number next to the call is signal strength, not a probability.
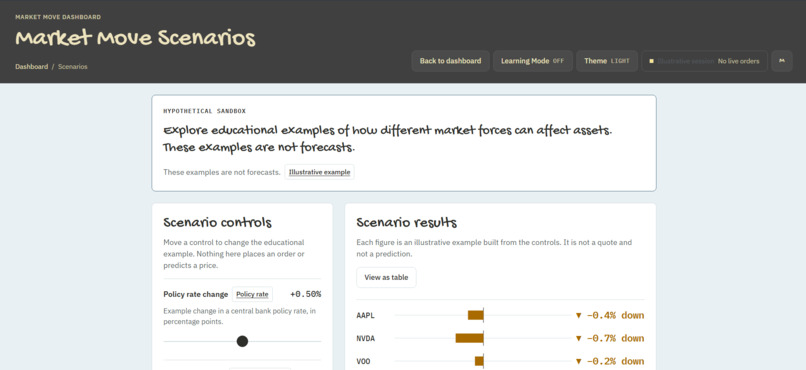
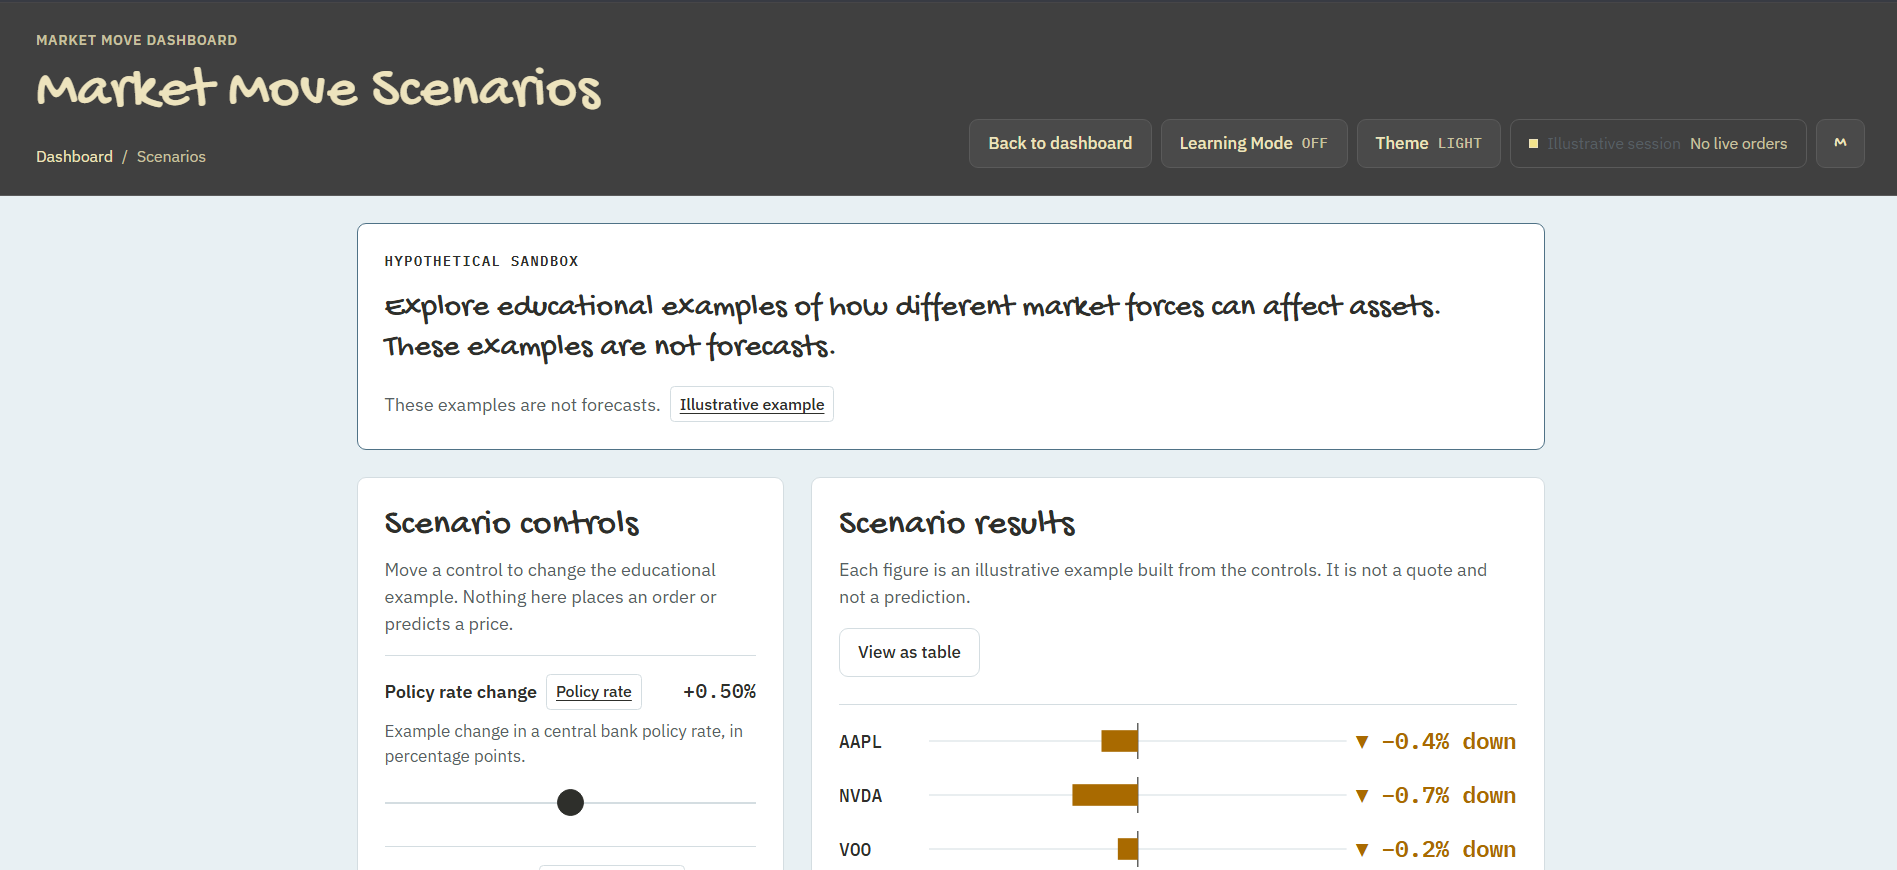
Every forecast is stored next to simple baselines and scored after the horizon passes. A separate scenarios page lets you move hypothetical factors and see an educational example. That page is not a forecast.
How we built it
The frontend is React 19, Vite, React Router, and Tailwind. The dashboard is lazy-loaded and uses TradingView Lightweight Charts, with an accessible SVG fallback and a data table for the same series. It talks to the API through a Vite proxy.
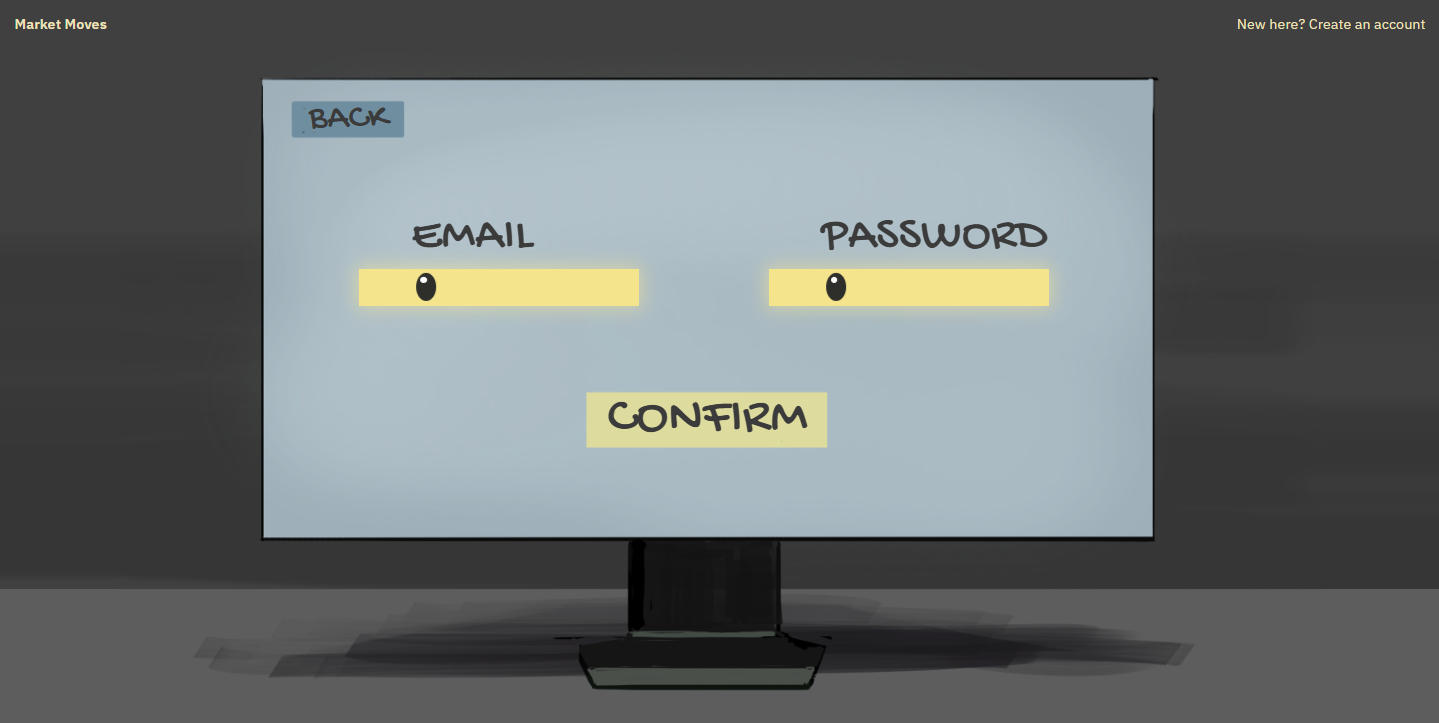
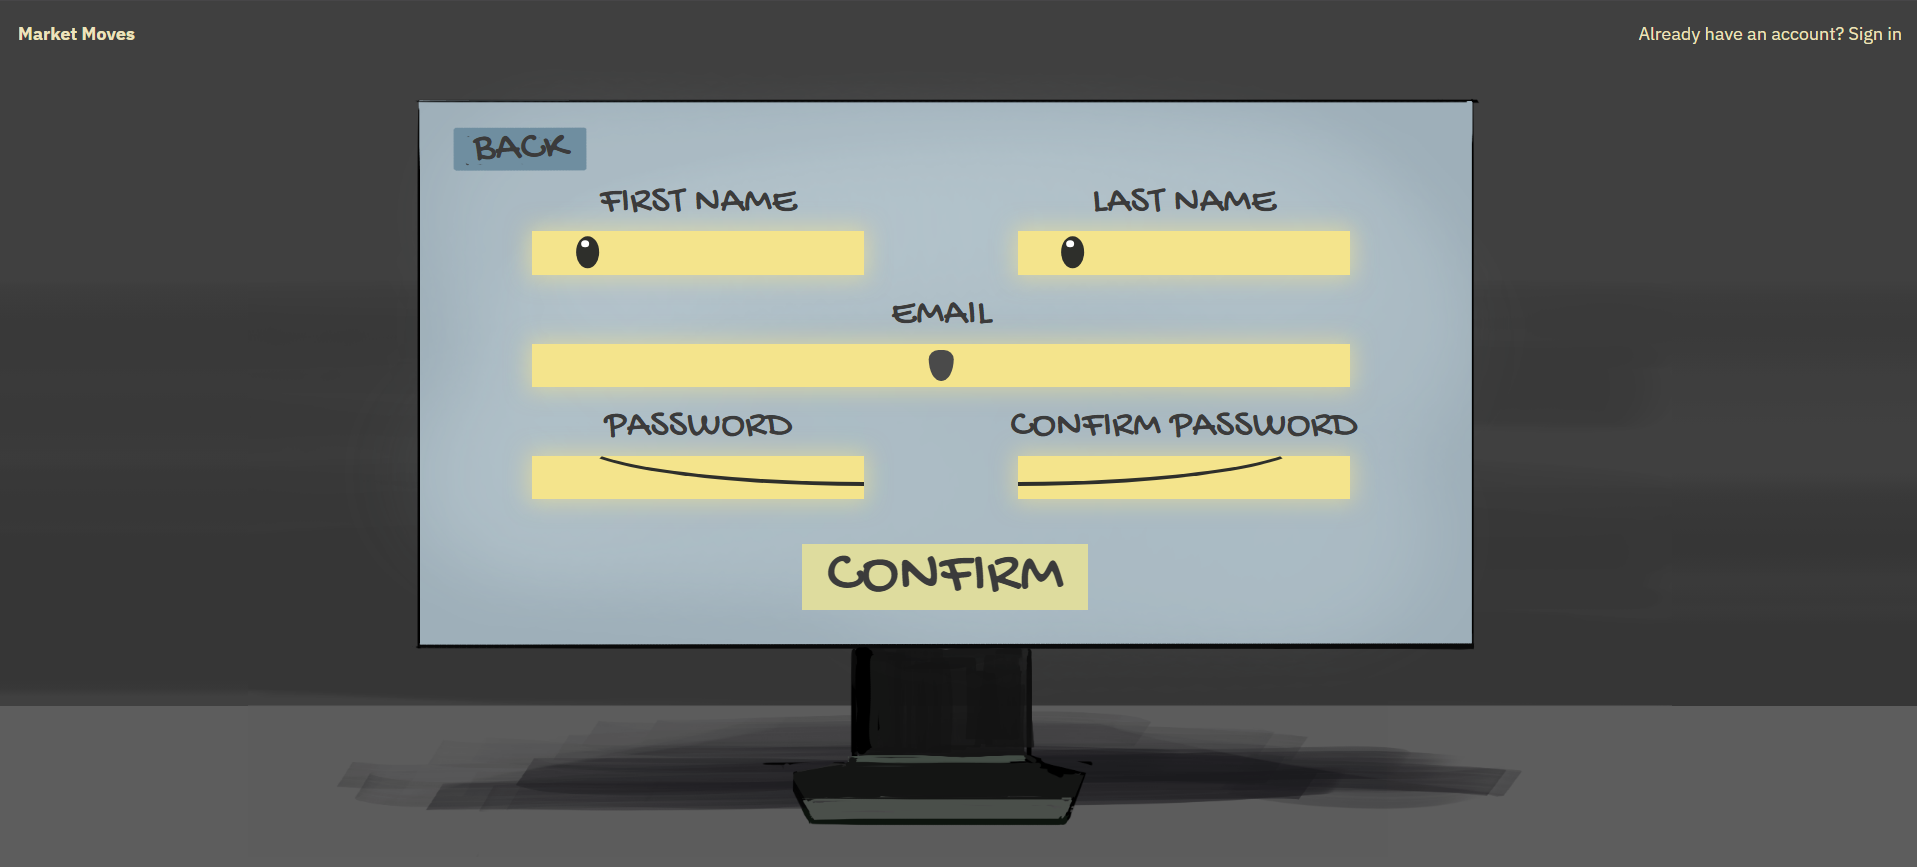
The backend is Python 3.12 and FastAPI. A forecast runs as a background job (usually 10–60 seconds) that the dashboard polls. Market data and documents land in PostgreSQL on Tiger Cloud before anyone is asked for a view. Sign-in is email and password or Google, both on the same session cookie. Prices come from Yahoo Finance on demand, with an optional live quote. There is no order placement and no brokerage connection.
The whole pipeline in one picture:
Yahoo Finance + news + filings  ->  PostgreSQL (Tiger Cloud)
        |
        v
Python computes metrics (RSI, MACD, VWAP, Altman Z, flat band)
        |
        v
Retrieval (point-in-time) -> Gemini, one call per persona -> JSON
        |
        v
Average inside each strategy -> combine strategies -> up / down / flat / unclear
        |
        v
Stored beside baselines -> scored after the horizon passes
Google Gemini
Gemini is the only part of the system that reads. Python computes every number first (RSI, MACD, VWAP, fundamentals, Altman Z, the volatility-scaled flat band), and Gemini receives that packet plus retrieved text and returns a structured JSON answer for one persona. Raw price rows never go to the model.
We use a Flash-Lite model through the Gemini API with a JSON schema, so every reply is validated against a typed response. A malformed answer is retried, and a persona that still fails drops out of the vote instead of inventing a call. A separate, cheap Gemini call scores recent headlines from -1 to +1, and that score goes into the packets as one more computed number. Because only the free tier was available, personas run in parallel with a concurrency cap and a 30-second timeout, which is why a forecast is a background job.
The AI agents
The thirteen personas are three strategies (long-term holders, day traders, index/options traders) across age bands from 16 to 65. Sixteen- and seventeen-year-olds are long-term only, because youth accounts don't day-trade or use options.
Each persona is one Gemini call with its own prompt, not thirteen copies of the same one. Each strategy sees a different packet:
- Long-term holders: fundamentals, insider activity, longer-horizon trend
- Day traders: short-term momentum, volume, volatility
- Index/options traders: macro and options data
Age bands shift risk tolerance and horizon in the prompt. We can also run personas under different temperatures, models and an optional second provider to measure how stable a call is.
Personas are averaged inside a strategy first and then across strategies, so one strategy cannot outvote the others just by having more people. With $K$ strategies, strategy weights $w_k$, and persona scores $s_{k,i}$:
$$S = \sum_{k=1}^{K} w_k \cdot \frac{1}{n_k} \sum_{i=1}^{n_k} s_{k,i}$$
where $n_k$ is the number of personas in strategy $k$. The call is then read off $S$ and the strategies' agreement.
Retrieval (RAG)
Each strategy gets its own retrieved evidence: news excerpts, Hacker News threads and optional SEC filings. Retrieval is point-in-time, so a persona cannot see a headline published after the cutoff.
Keyword search is the default, deliberately simple and auditable. With Snowflake turned on, Cortex embeddings are fused with the keyword hits, and every hit is reloaded from PostgreSQL under the same date rules, so the vector index can't leak the future. If Snowflake is down, the forecast falls back to keyword search. Citations the model actually used are stored separately from the passages that were merely supplied.
Linear regression
The regression is our statistical bar, not a feature. It predicts the forward $N$-day return from momentum, RSI, volatility, trend and volume by ordinary least squares on standardized inputs:
$$\hat{\beta} = (X^{\top}X)^{-1} X^{\top} y$$
It is evaluated walk-forward on an expanding window that only contains targets already known on that day, and it is kept out of the persona prompts so the two predictions stay independent. Every forecast is stored beside this regression, a momentum rule and always-up, and all of them are scored once the horizon passes. Its out-of-sample $R^2$ is expected to be near zero: daily price features carry little linear signal, which is the point of a baseline.
Neural network and machine learning
We built a machine learning layer (backend/src/ml/) to test whether a trained model could beat the personas or the baselines. Logistic regression, LightGBM and a small PyTorch MLP sit behind one interface and are trained on the same rows. Everything is validated walk-forward with a purge gap so there is no look-ahead, and probabilities are calibrated (isotonic or Platt) and scored by Brier score:
How the system adapts
The system is built to correct itself from its own track record rather than stay fixed. Every live forecast is logged with its inputs and scored after the horizon passes. Those results feed back in three ways:
- Strategy weights are derived from scored history, so a strategy that has been right more often gets more say in the combined call.
- The persona stacker (model B) learns how much to trust each persona, strategy and reasoning mode, and a calibrator turns signal strength into a calibrated chance of being right.
- A call policy withholds a call when its strength falls below a threshold fitted on past results, and it is only applied if it passed a held-out check.
This is a periodic refit on resolved live forecasts, not instant learning, and it needs roughly 300 resolved predictions before the learned weights mean anything. Until then the personas are weighted equally, but over time this will improve the linear regression and increase our accuracy.
$$\text{Brier} = \frac{1}{N} \sum_{t=1}^{N} (p_t - o_t)^2$$
Two models came out of it:
- Model A, a pooled price network: failed its pre-set gate against always-up at both 1-day and 5-day horizons, so it is not integrated. We logged its output and kept the honest result.
- Model B, a persona stacker: learns how much to trust each persona and strategy. It is built and tested but needs about 300 resolved live predictions before its weights mean anything.
Historical data trains and validates this layer only. It never counts toward the personas' accuracy claim.
Challenges we ran into
Messy data. Yahoo's latest daily bar sometimes arrives with volume and empty prices, and later split-adjusts old closes. Scoring against those adjusted prices would mark a correct call wrong, so outcomes stay pending until the share basis can be restated.
A fair "flat". A fixed ±1% band was flat 38% of the time for SPY and about 10% for TSLA. The band is now a fraction of each stock's own volatility, so "flat" means roughly the same thing across names.
Infrastructure. Campus Wi-Fi silently dropped traffic to the team database. Gemini's free tier made full thirteen-persona runs slow enough that a normal request would time out, which is why forecasts are jobs. Two branches also reused the same prompt version numbers, so "version 5" meant two different prompts until we renumbered on merge. The current prompt version is 8. Deploying to AWS Lambda hit a further wall: Tiger Cloud accepts connections only from an allow-listed IP and a narrow set of ports, which a Lambda without a static egress IP can't satisfy.
The honest baseline was humbling. Always-up is right about 42% of the time on a five-day three-way call, and the regression sits under that. Replaying five years of history through the personas would look better than it is, because that history overlaps Gemini's training data, so only forecasts logged live are scored. We expect a well-calibrated system to land a few points above always-up, roughly 43–48%, with a ceiling near 50%. Anything much higher would be leakage, so we won't claim a number until enough live forecasts have resolved.
Accomplishments that we're proud of
- Visible disagreement. Unclear is its own outcome, not a shy version of flat, and signal strength is never shown as a chance of being right.
- Different evidence per strategy. The personas are not thirteen copies of the same prompt, and the dashboard can show a source digest and a plain-language risk checklist.
- A written contract. A test fails if a field the dashboard reads changes shape. The dashboard covers saved data, missing data, a backend outage, refresh, and a forecast job, and the chart has a keyboard path, a table view, and screen-reader announcements.
What we learned
A forecast without a baseline is just a story. Beating "always up" is the real bar, and most of the work is stopping the data from lying: empty bars, stock splits, headlines from the future, and float noise that rewrote thousands of old prices on every refresh.
We also learned to keep the model in a narrow job. The metrics are computed in code, and the model's job is to read that packet and say what a particular kind of trader would make of it. When a source is missing, the call gets weaker instead of the pipeline inventing a number.
What's next for Market Moves
- Score enough live forecasts to see whether signal strength and strategy weights actually track accuracy, and train the persona stacker once about 300 have resolved.
- Compare Snowflake retrieval with keyword search on the forecasts we already stored.
- Replace the scenarios page's illustrative numbers with the same pipeline as the dashboard.
- Finish the learning-mode and honesty sections that are written but not on the landing page, add password reset, and run the screen-reader pass the accessibility notes already call for.
- A paper-trading ledger already exists in the backend; a practice mode with pretend money is the step after understanding a move, still with no brokerage and no real orders.
Built With
- docker
- fastapi
- github-actions
- google-gemini
- lightgbm
- lightweight
- postgresql
- python
- pytorch
- react
- snowflake
- tailwind
- tigerdata
- timescaledb
- vite
- yahoo-finance


Log in or sign up for Devpost to join the conversation.