Hacker News Demystified: An Engineering Experiment
The Spark
Let’s be real: nobody actually knows exactly why some posts go viral on Hacker News while others die in "new." We all have theories—"post on Tuesday," "keep it short," "don't say 'Launch'"—but it's mostly superstition.
I didn't build this project to claim I cracked the algorithm. I built it because I was curious: If I throw 6 years of data and some modern AI at the problem, can I at least beat random guessing?
This is a fun, technical exploration into the chaos of the "Orange Site," built to see if I could tilt the odds in my favor.
Under the Hood
The project is built entirely in Hex, acting as a bridge between massive SQL queries and Python logic.
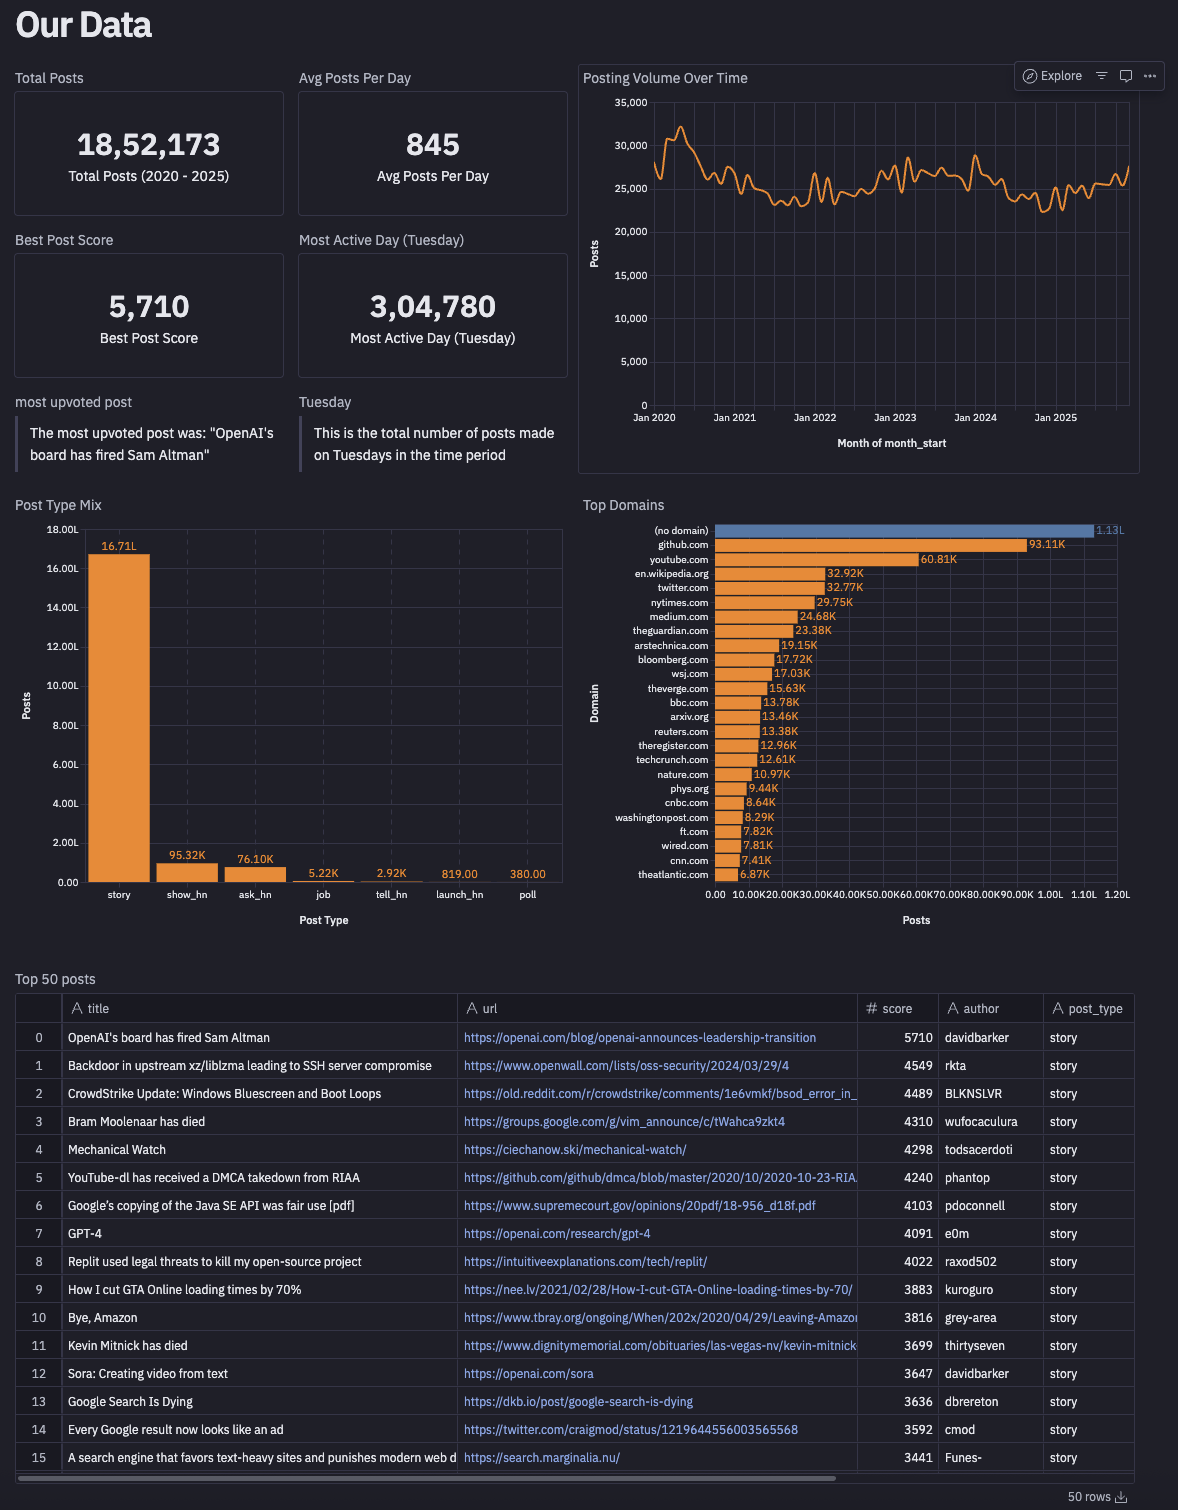
1. The Data Dump (1.8M Posts)
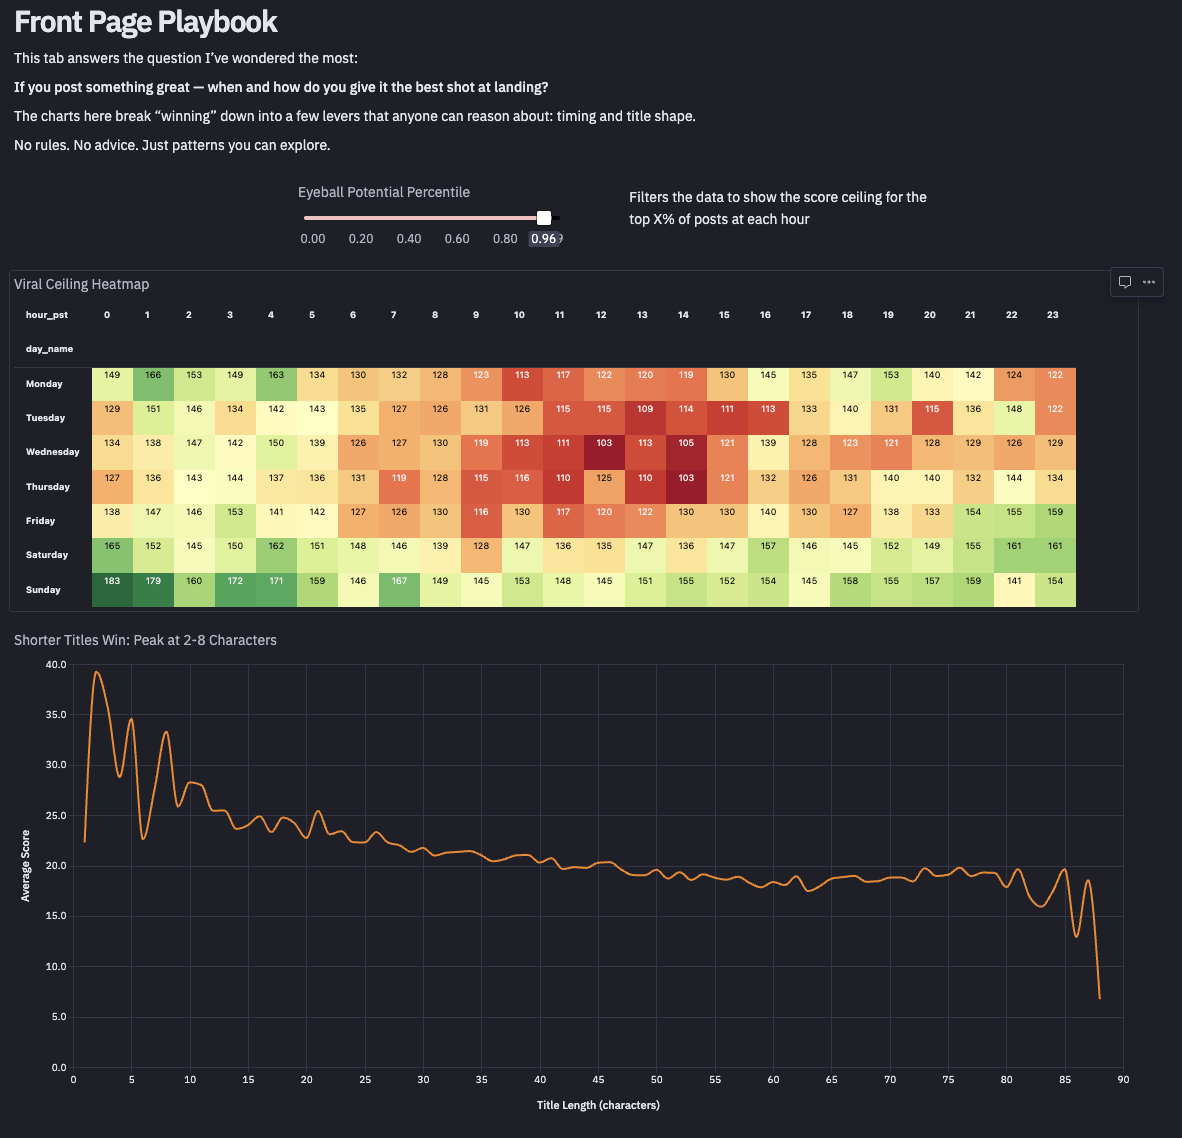
I started by ingesting every post from Jan 2020 to Dec 2025. I crunched 1.8 million rows to find the baseline patterns. I built a "Viral Ceiling" heatmap—not to tell you when to post, but to show you when the "upvote cap" is historically highest (spoiler: it’s not when you think).
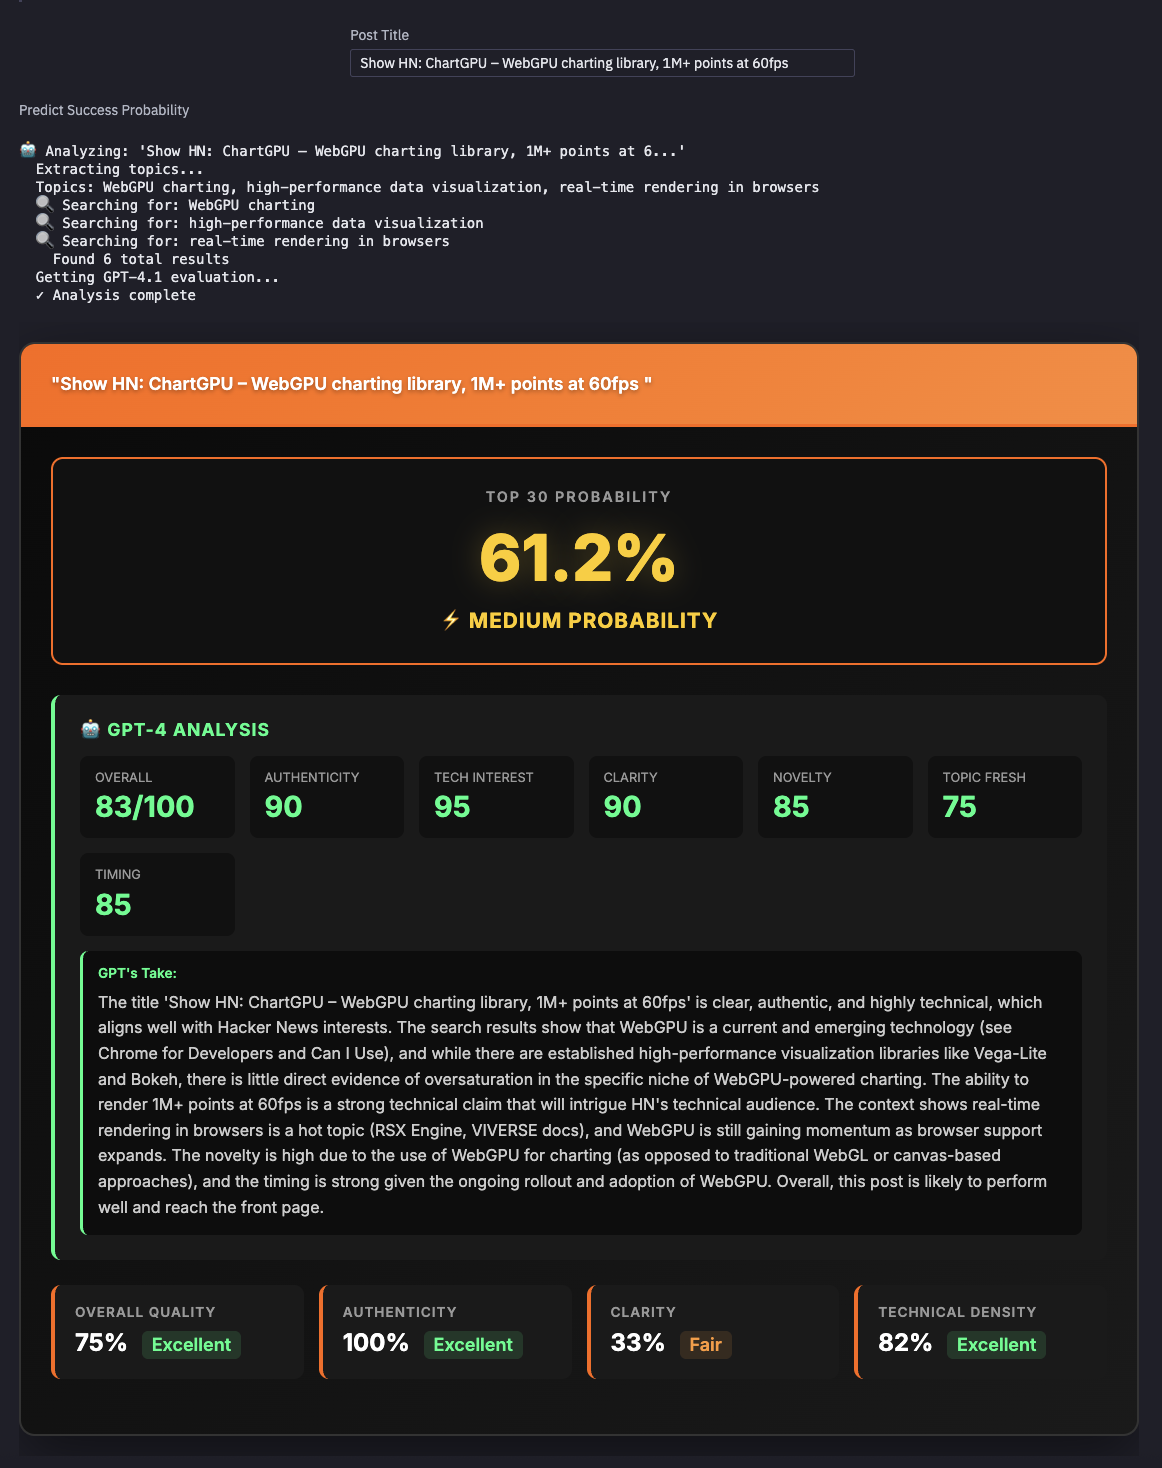
2. The Experiment: "Show HN Lab"
This is the most technically interesting part. I wanted to see if I could build a "Virality Compass." I realized that predicting success requires two different brains, so I built a Hybrid Ensemble:
- The "Old School" Brain (70%): I trained a Logistic Regression model on 5 years of data. I used TF-IDF to vectorise titles and engineered custom features like
technical_density(how nerdy is your title?) andspam_score(are you using marketing fluff?). This handles the structural patterns. - The "New School" Brain (30%): Standard ML models are blind to trends. They don't know that "Claude Cowork" is hot right now. So I hooked up GPT-4.1 with Exa Search. The agent web searches your topic in real-time to check for momentum and saturation, then vibes-checks your title.
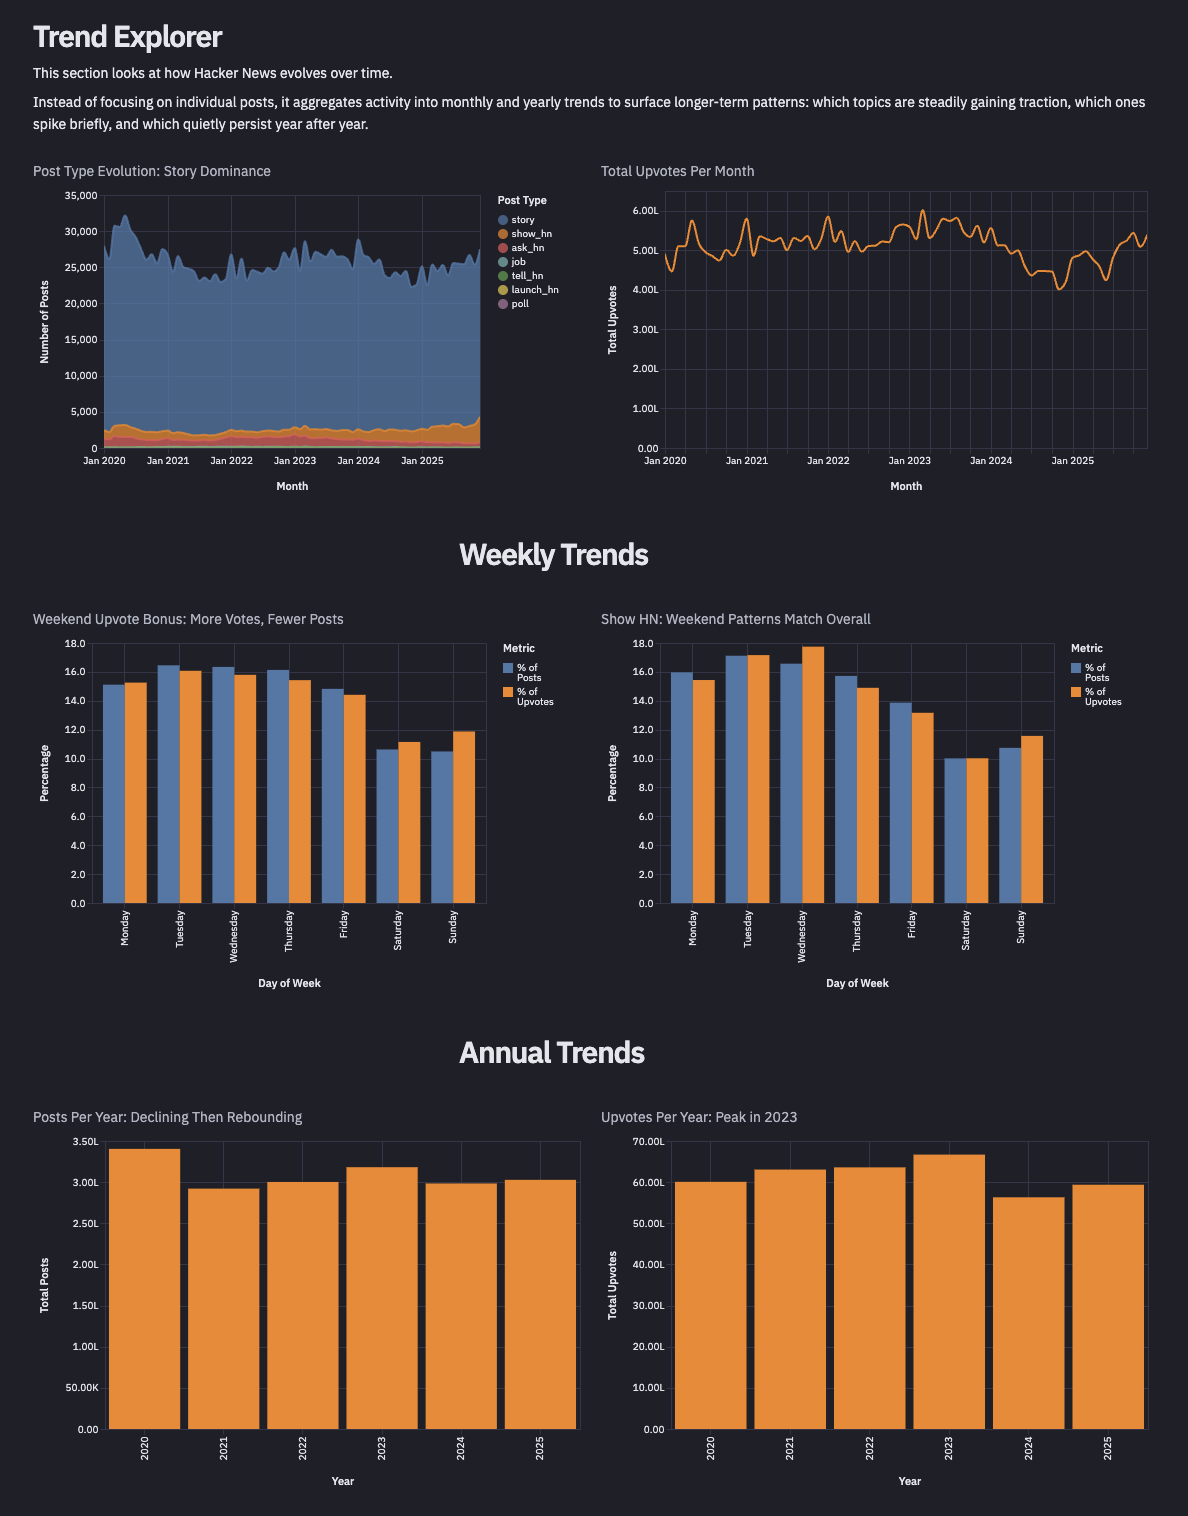
3. The Trends Explorer
Beyond prediction, I wanted to see how the community has evolved. I built a comprehensive data report that tracks the surge in "Show HN" submissions, analyses monthly activity cycles, and breaks down the most successful domains over the last half-decade and more! It turns raw counts into a clear picture of what the community actually cares about.
Closing Thoughts
Overall, I’m really proud of how this turned out! I wanted to build something that wasn't just a raw analysis script, but a beautiful, cohesive experience. Orchestrating the Agents within Hex allowed me to create a tool that feels polished and powerful. It turns the chaos of the Front Page into something clear and actionable, and I hope you enjoy exploring the data as much as I enjoyed designing it.

Log in or sign up for Devpost to join the conversation.