Inspiration The inspiration behind this project was to create a powerful, data-driven platform that helps users gain insights into stock performance and market trends. By incorporating real-time data visualization and ML-driven forecasts, we aimed to provide a tool that makes complex financial data accessible and actionable, especially for those looking to make more informed investment decisions.
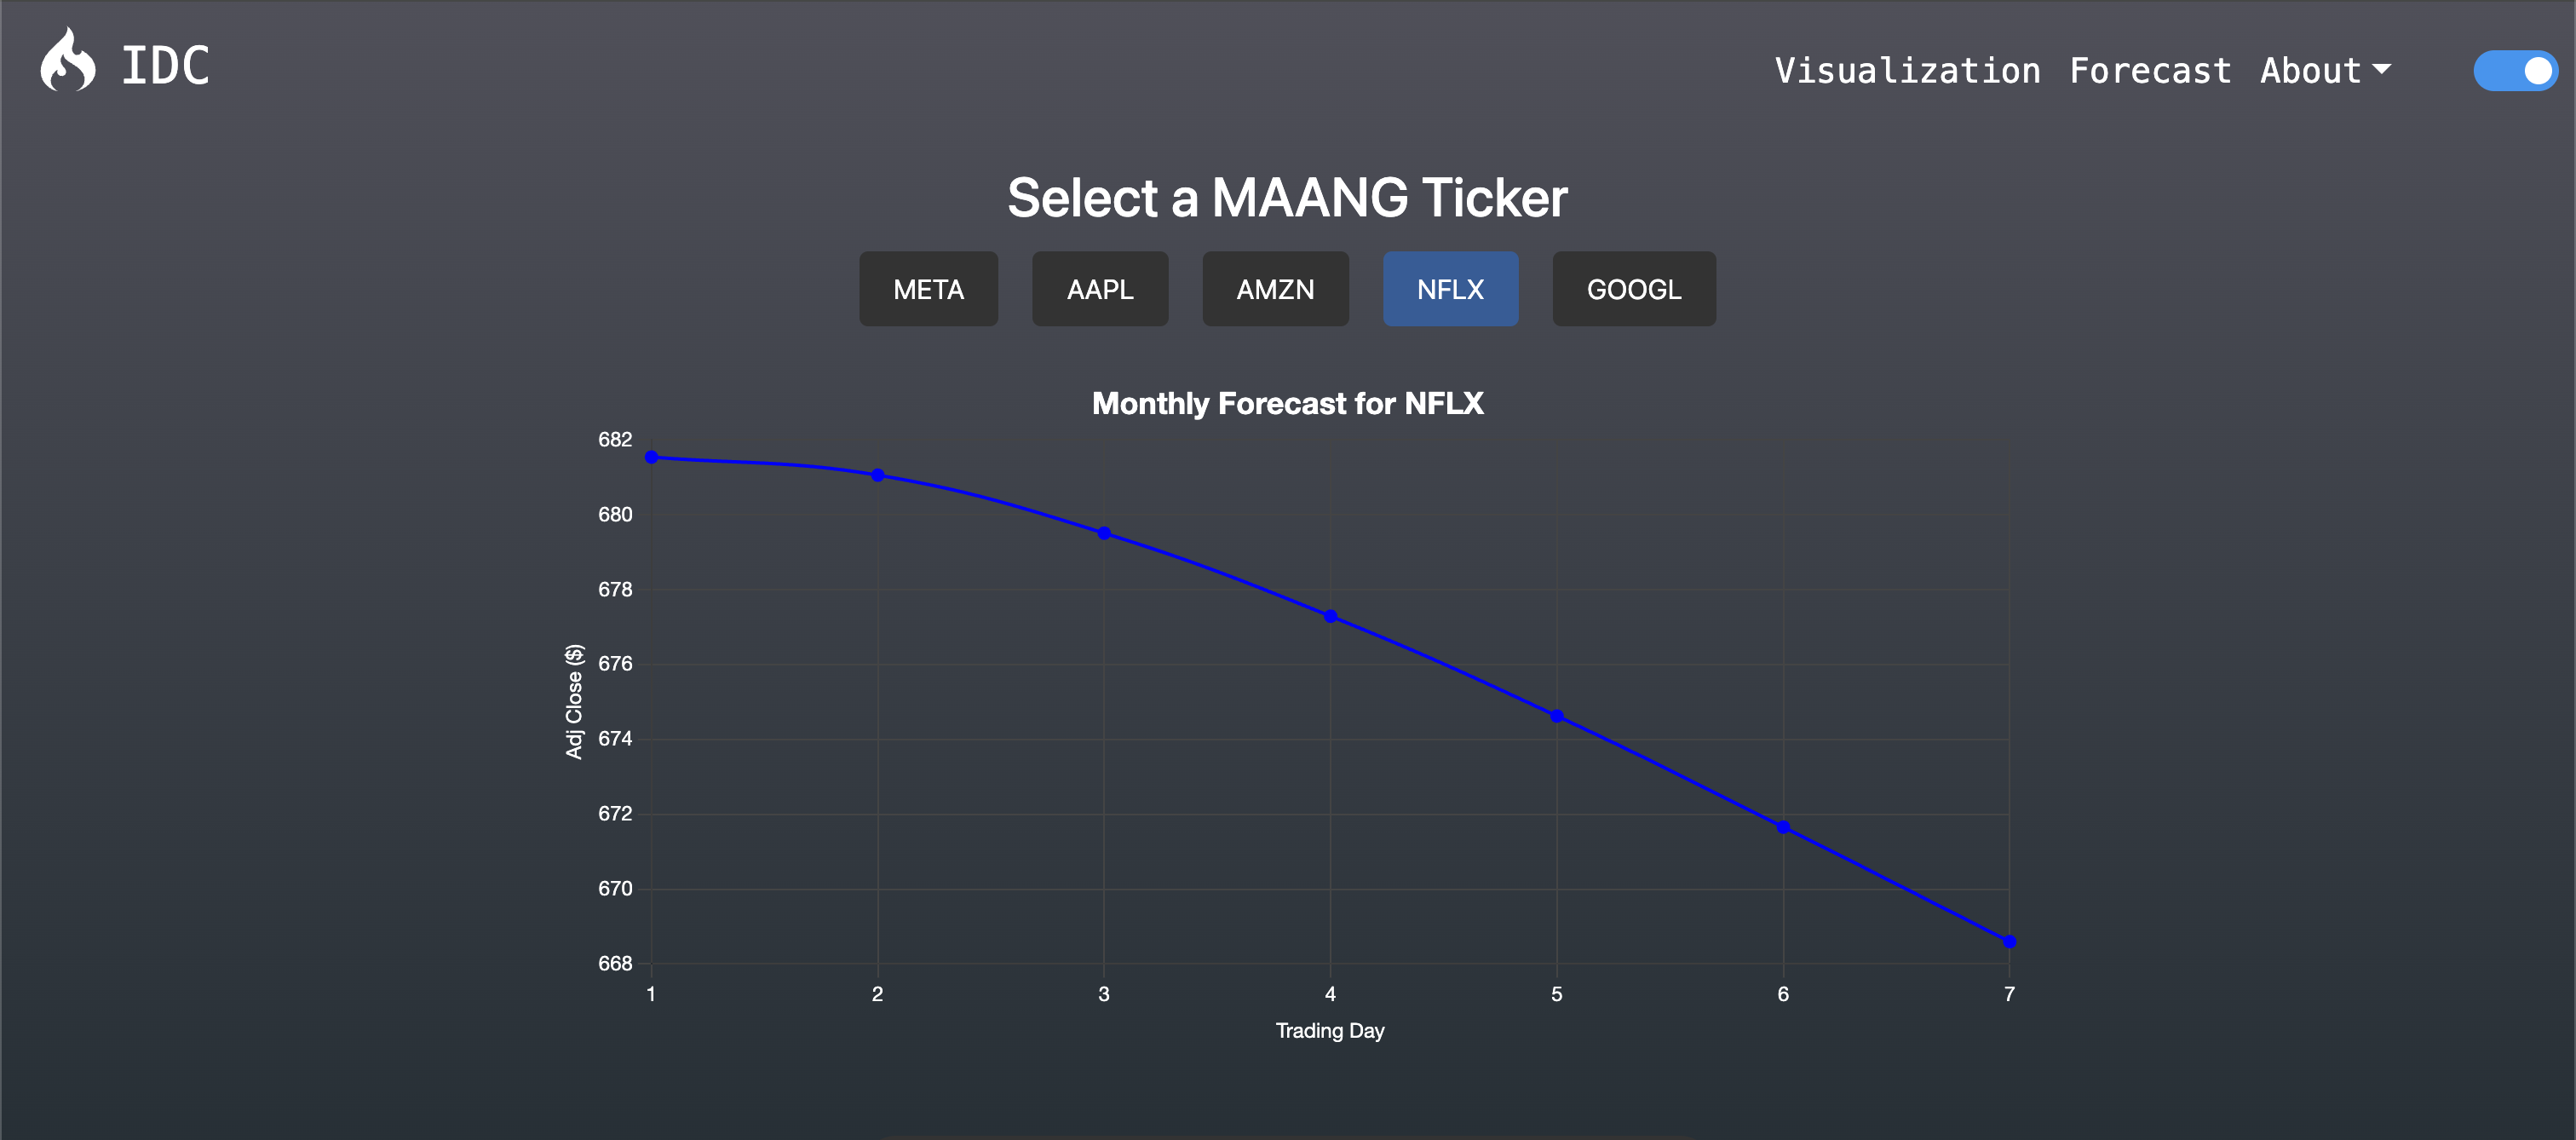
What it does This application provides users with interactive stock visualizations and forecasts for major companies, helping them understand market trends and make data-informed decisions. Users can select different stocks to see historical data, as well as forecasts generated by a machine learning model. The app also includes a dark mode for better accessibility and user experience.
How we built it The project was built using a robust tech stack:
React.js for the frontend, providing a responsive and interactive user interface. Chart.js to create dynamic visualizations of stock data, allowing users to explore trends interactively. Flask for the backend REST API, which handles requests and serves data to the frontend. TensorFlow for the machine learning model, specifically an LSTM network that forecasts future stock trends. Selenium for automated UI testing, ensuring consistent functionality across features. Git for version control, allowing for collaborative development and iterative improvements.
Challenges we ran into One challenge was optimizing the LSTM model for accurate and timely forecasts. Training the model with sufficient data without compromising performance took considerable tuning. Additionally, managing asynchronous data loading in the frontend was tricky, especially for smooth UI performance and real-time responsiveness. Integrating the dark mode toggle with all components and ensuring uniformity in the styling also required careful implementation.
Accomplishments that we're proud of We’re proud of creating a cohesive application that combines real-time data visualization with machine learning forecasting in a way that feels intuitive and user-friendly. Achieving reliable UI test coverage with Selenium, as well as successfully deploying a robust backend, were significant milestones. The dark mode toggle and overall styling improvements gave the app a professional and polished look.
What we learned Through this project, we learned valuable lessons in balancing frontend and backend requirements, especially when handling asynchronous data and ensuring smooth UX. We also deepened our understanding of LSTM models and their nuances in time-series forecasting. Working with Selenium for UI testing was a rewarding experience, enhancing our skills in test-driven development.
What's next for HackED Beta 2024 Looking forward, we plan to expand the application’s forecasting capabilities by experimenting with additional machine learning models. We aim to integrate new data sources for a more comprehensive analysis, including economic indicators and industry-specific data. We also plan to enhance the UI with more interactive features, such as allowing users to save or compare forecasts, and to improve accessibility options to reach a wider audience.

Log in or sign up for Devpost to join the conversation.