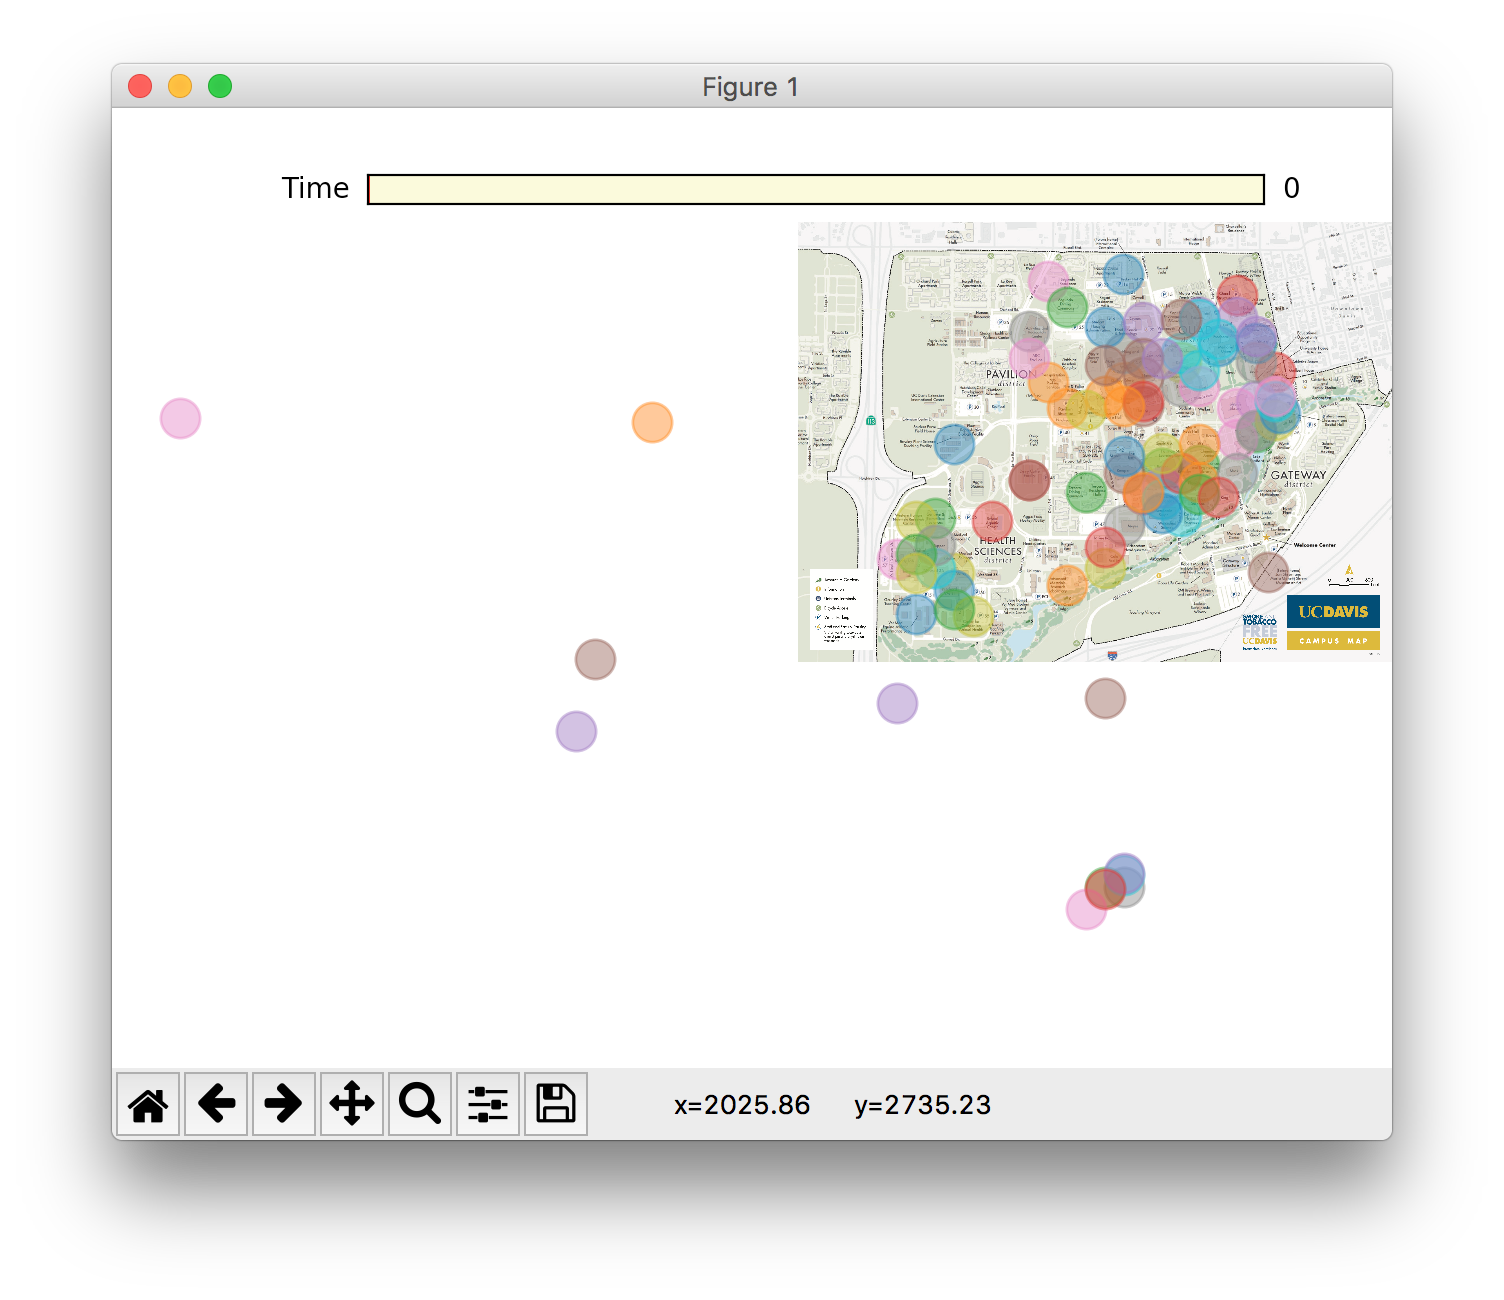
While you can see the amount of energy each building pulls on campus, it is hard to get insight into how much they contribute to greenhouse gases. By reading campus data on building energy demand and solar energy production, we are able to get a sense of how much energy the buildings are pulling from the grid. Using California ISO data we can figure out how much of the grid energy is from renewable sources and how much comes from sources like natural gas, coal or nuclear.
In future versions the points will be scaled based on emissions and the colors of the points will indicate how high emissions are.
References: Energy Overview: https://ceed.ucdavis.edu/#!/energystory/overview California ISO: http://www.caiso.com/Pages/TodaysOutlook.aspx Documentation of OSIsoft: https://docs.google.com/document/d/1CjJUg1aECDxIiBKJBea06ZZRN9f32Tv6xjRoPrpQR6A/edit


Log in or sign up for Devpost to join the conversation.