-
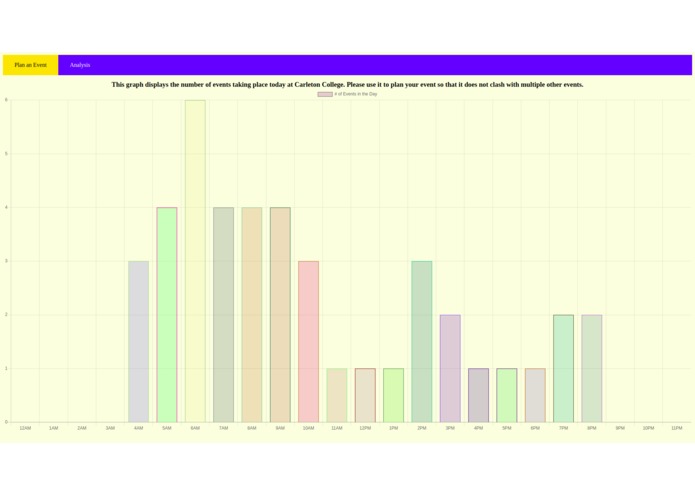
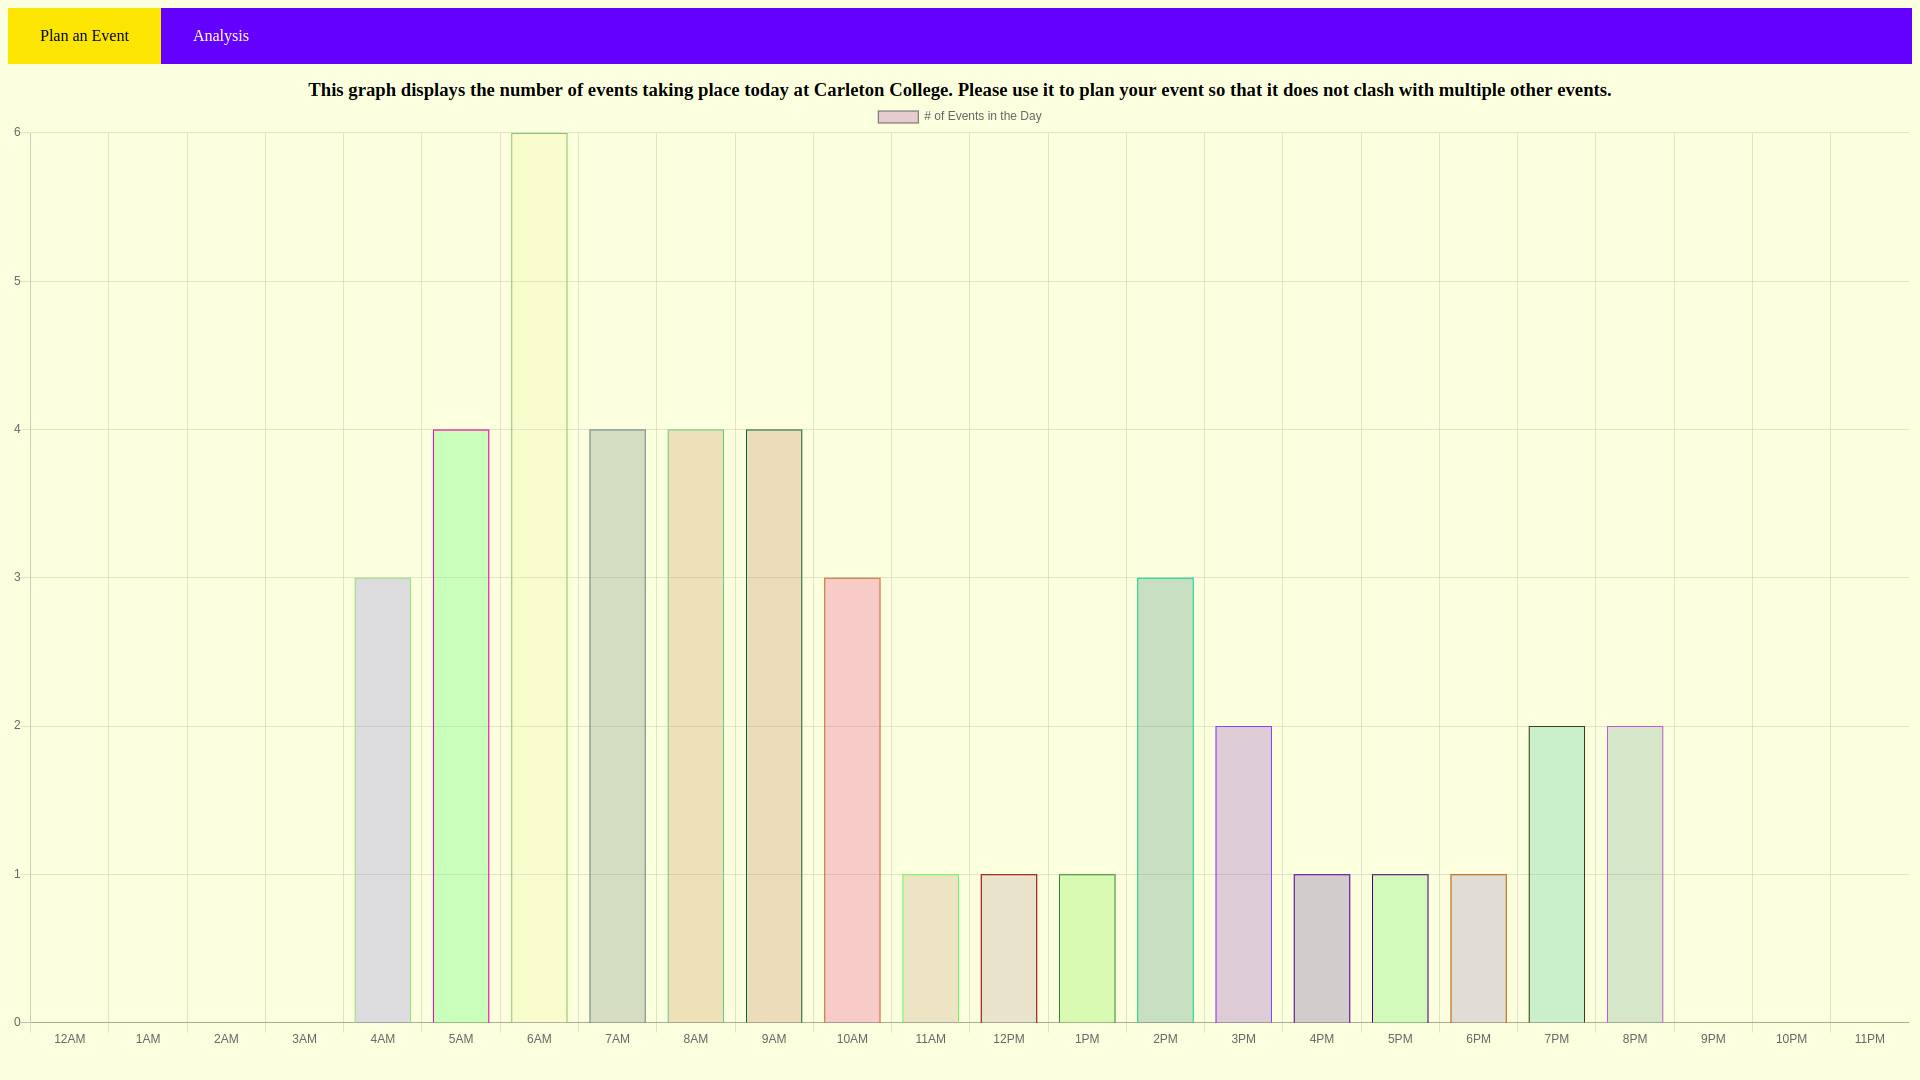
Graph of the number of events taking place during hour slots during the day.
-
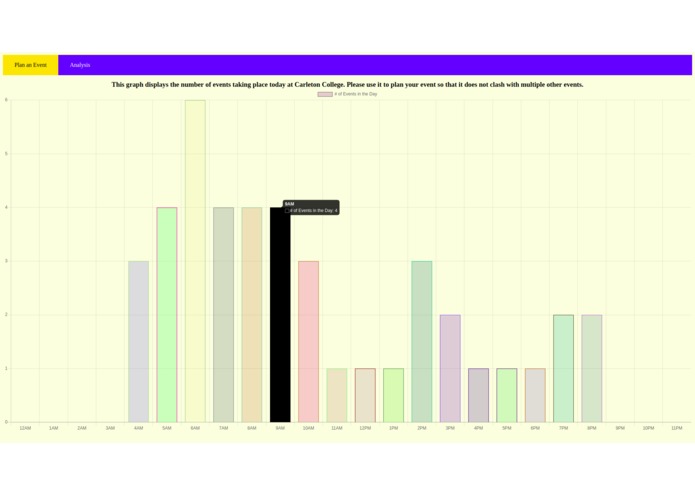
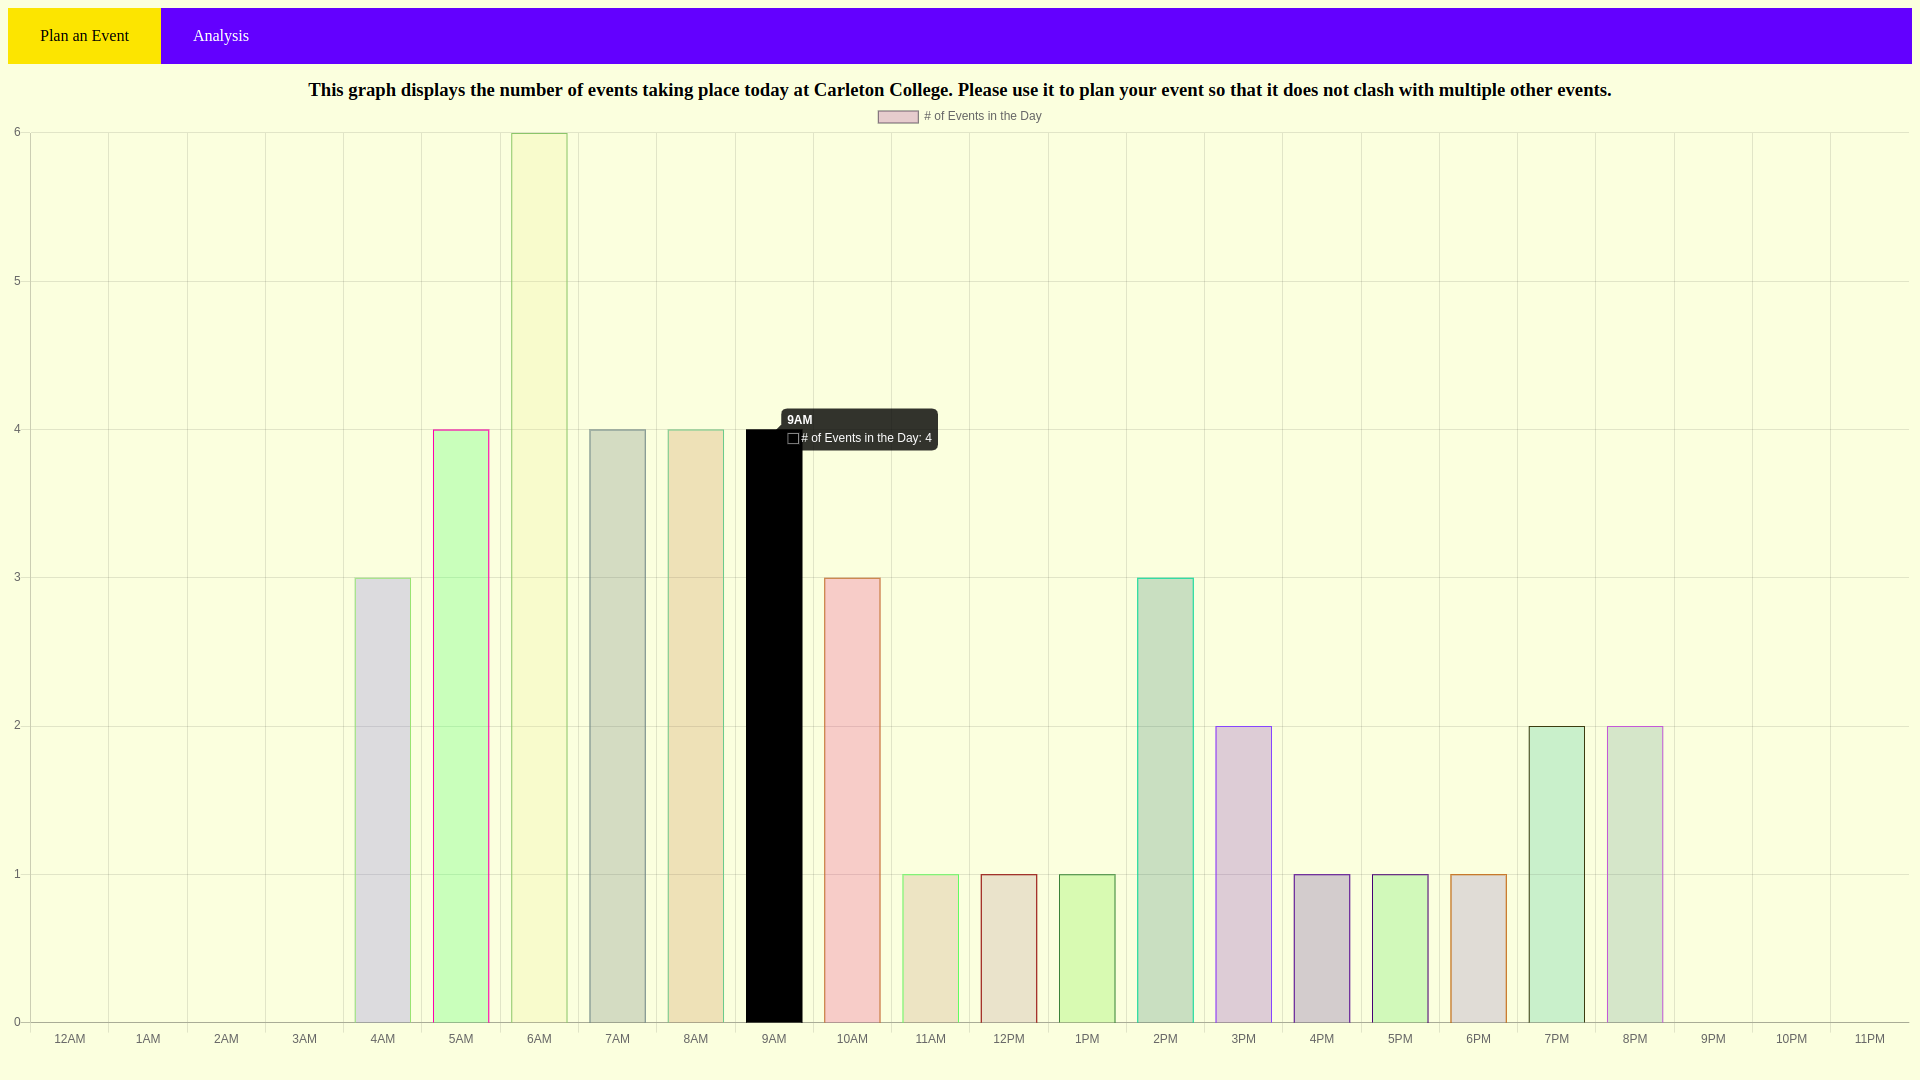
Hovering the mouse over a data bar provides more information about the events during this time slot.
-
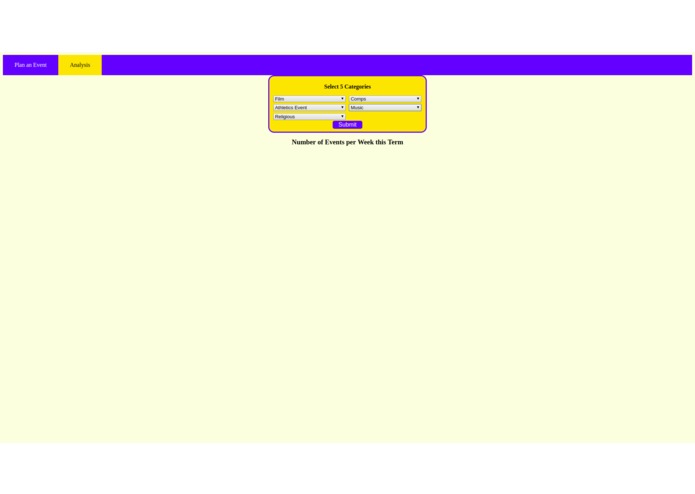
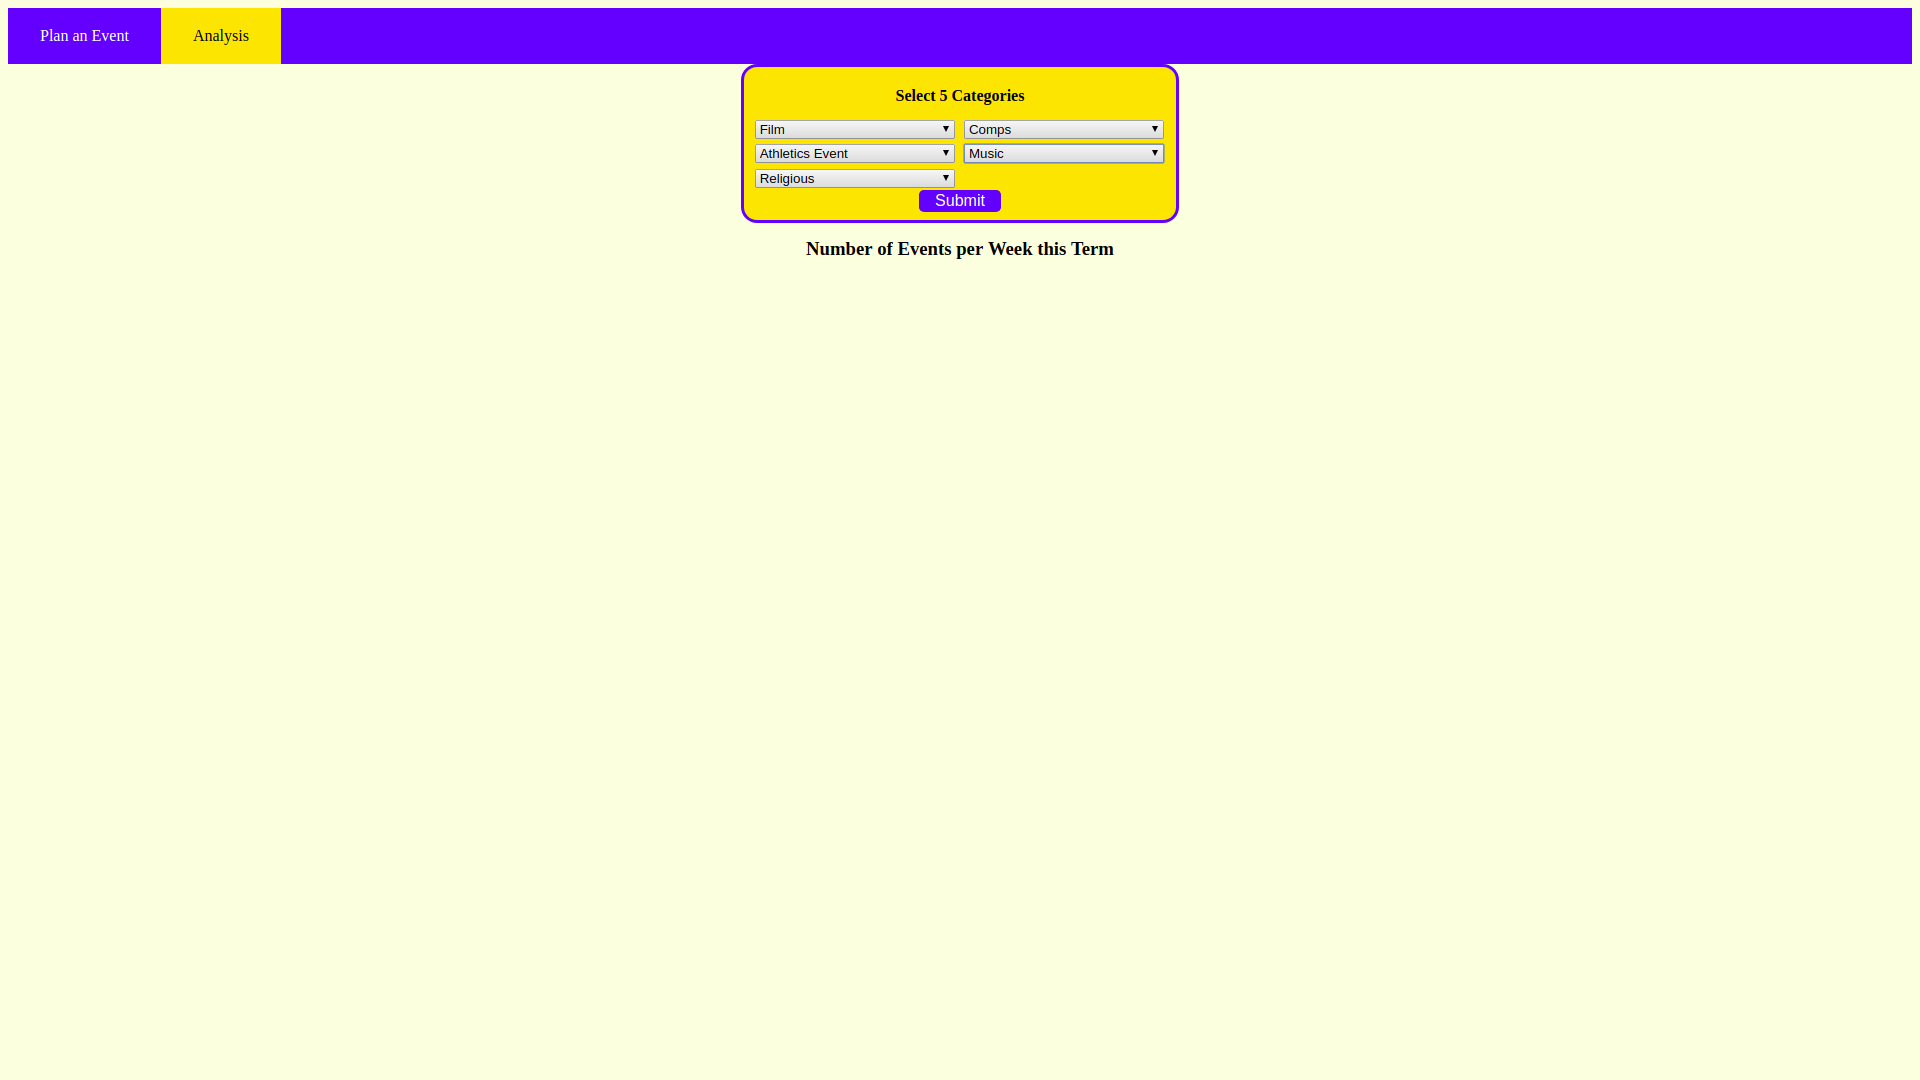
In the Analysis tab, multiple event types can be compared over the course of a term, revealing trends over time.
-
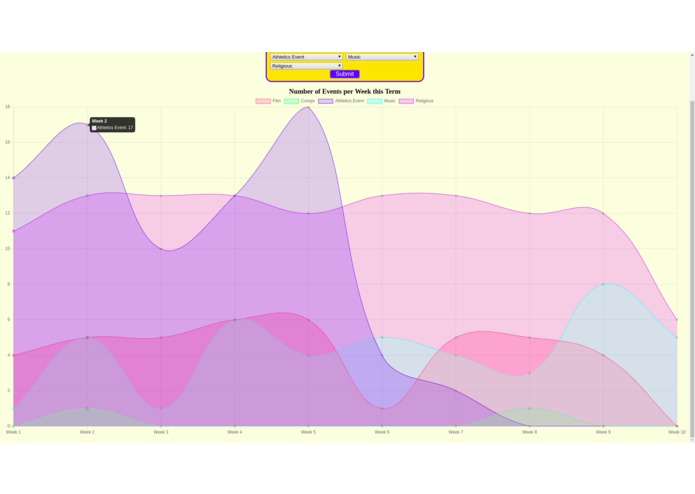
The frequencies of multiple event types are overlaid.
-
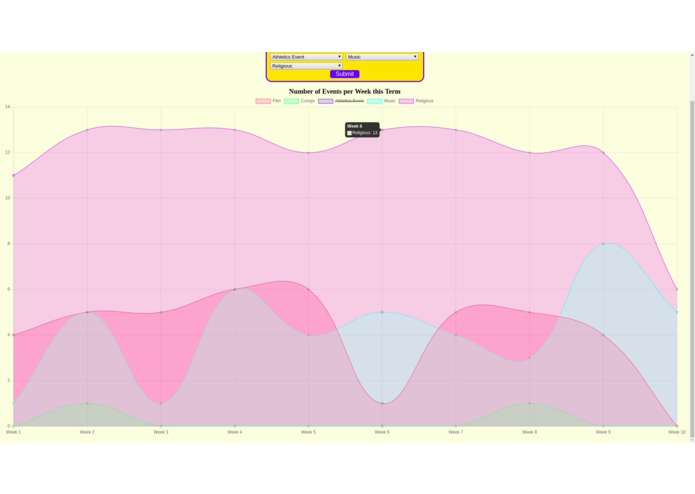
If one category is deselected, the others auto-scale to fit the graph size.


EventTiller
Developed by:
- Daniel Busis
- Oliver Calder
- Zack Johnson
- Ankit Sanghi
Carleton Hackathon 2019
Idea
This project considers data about events on campus, with the goals of:
- analyzing the distribution of events
- building visual tools to display trends and gaps
Tools Used
- Event scraping from Carleton Campus Calendar using BeautifulSoup (Python module)
- Event processing using Python
- Local server hosted using Flask
- Visualizations built using Chart.js and HTML
Built With
- bs4
- chartjs
- css
- flask
- html
- javascript
- python

Log in or sign up for Devpost to join the conversation.