Hackathon Tracker
Inspiration
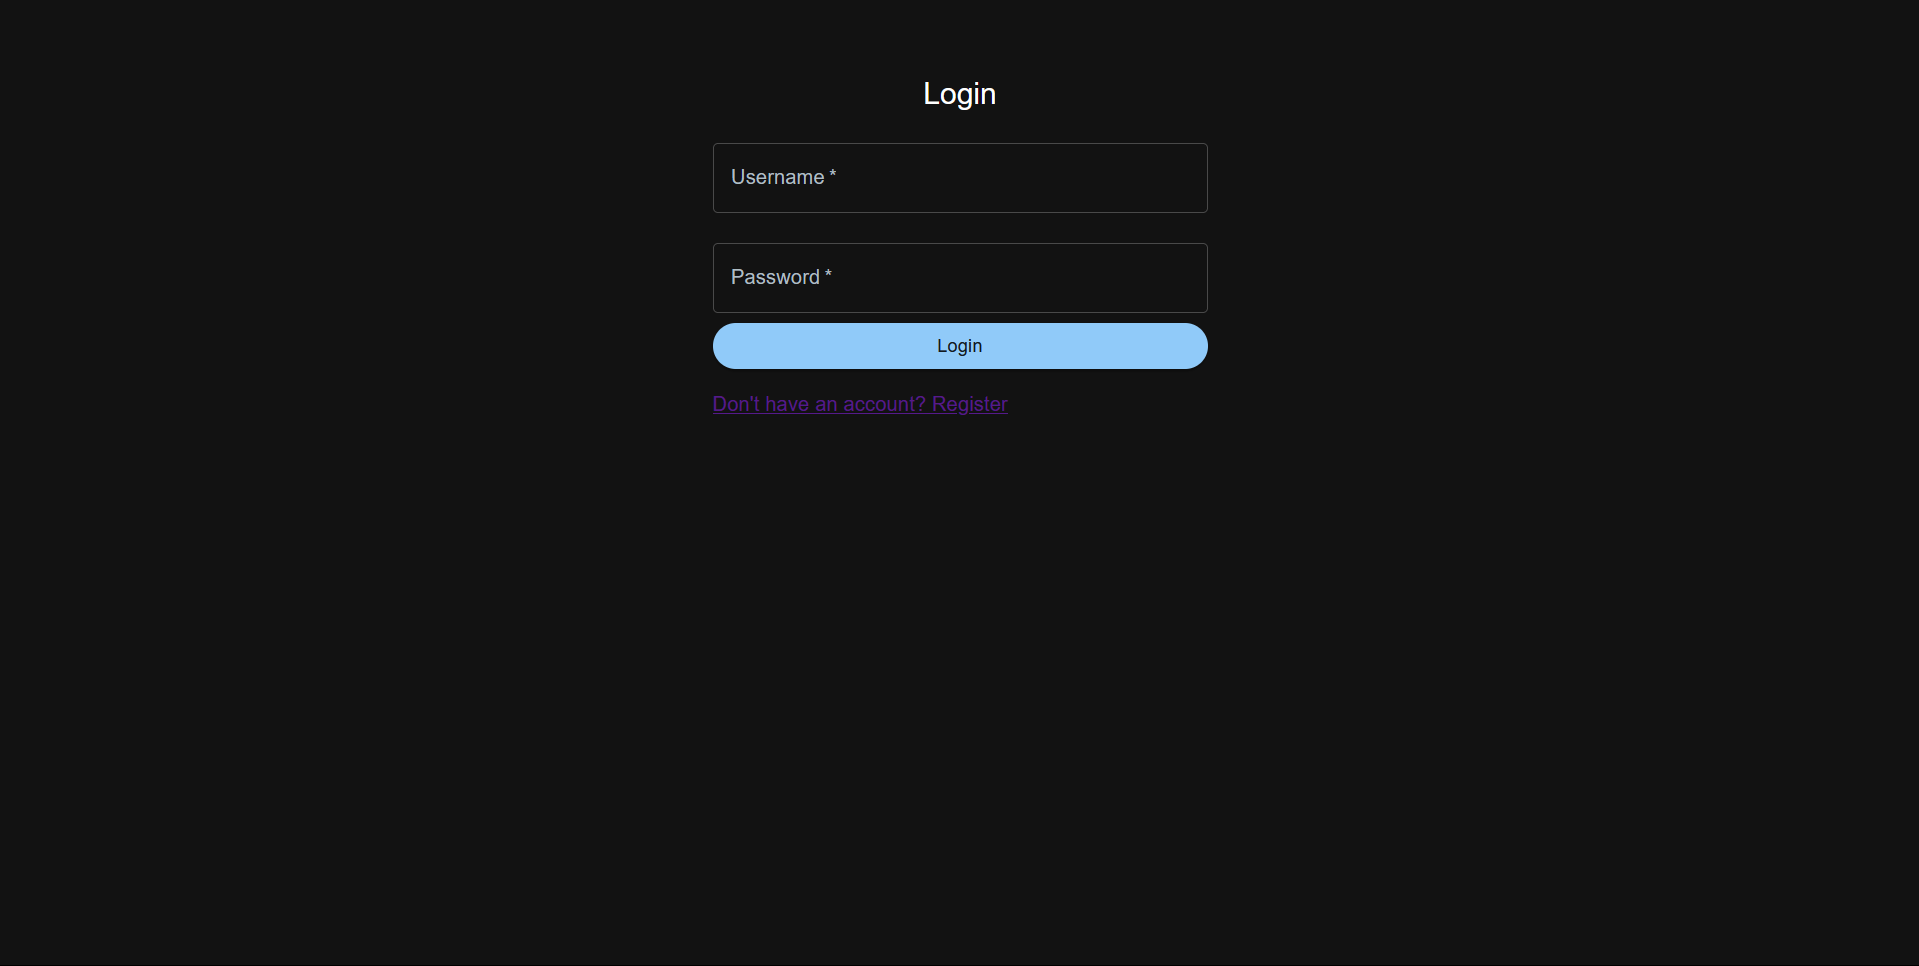
We created Hackathon Tracker to help us and others keep track of hackathon experiences, celebrate successes, and learn from challenges. It’s a tool to visualize your hackathon journey and stay motivated.
What it does
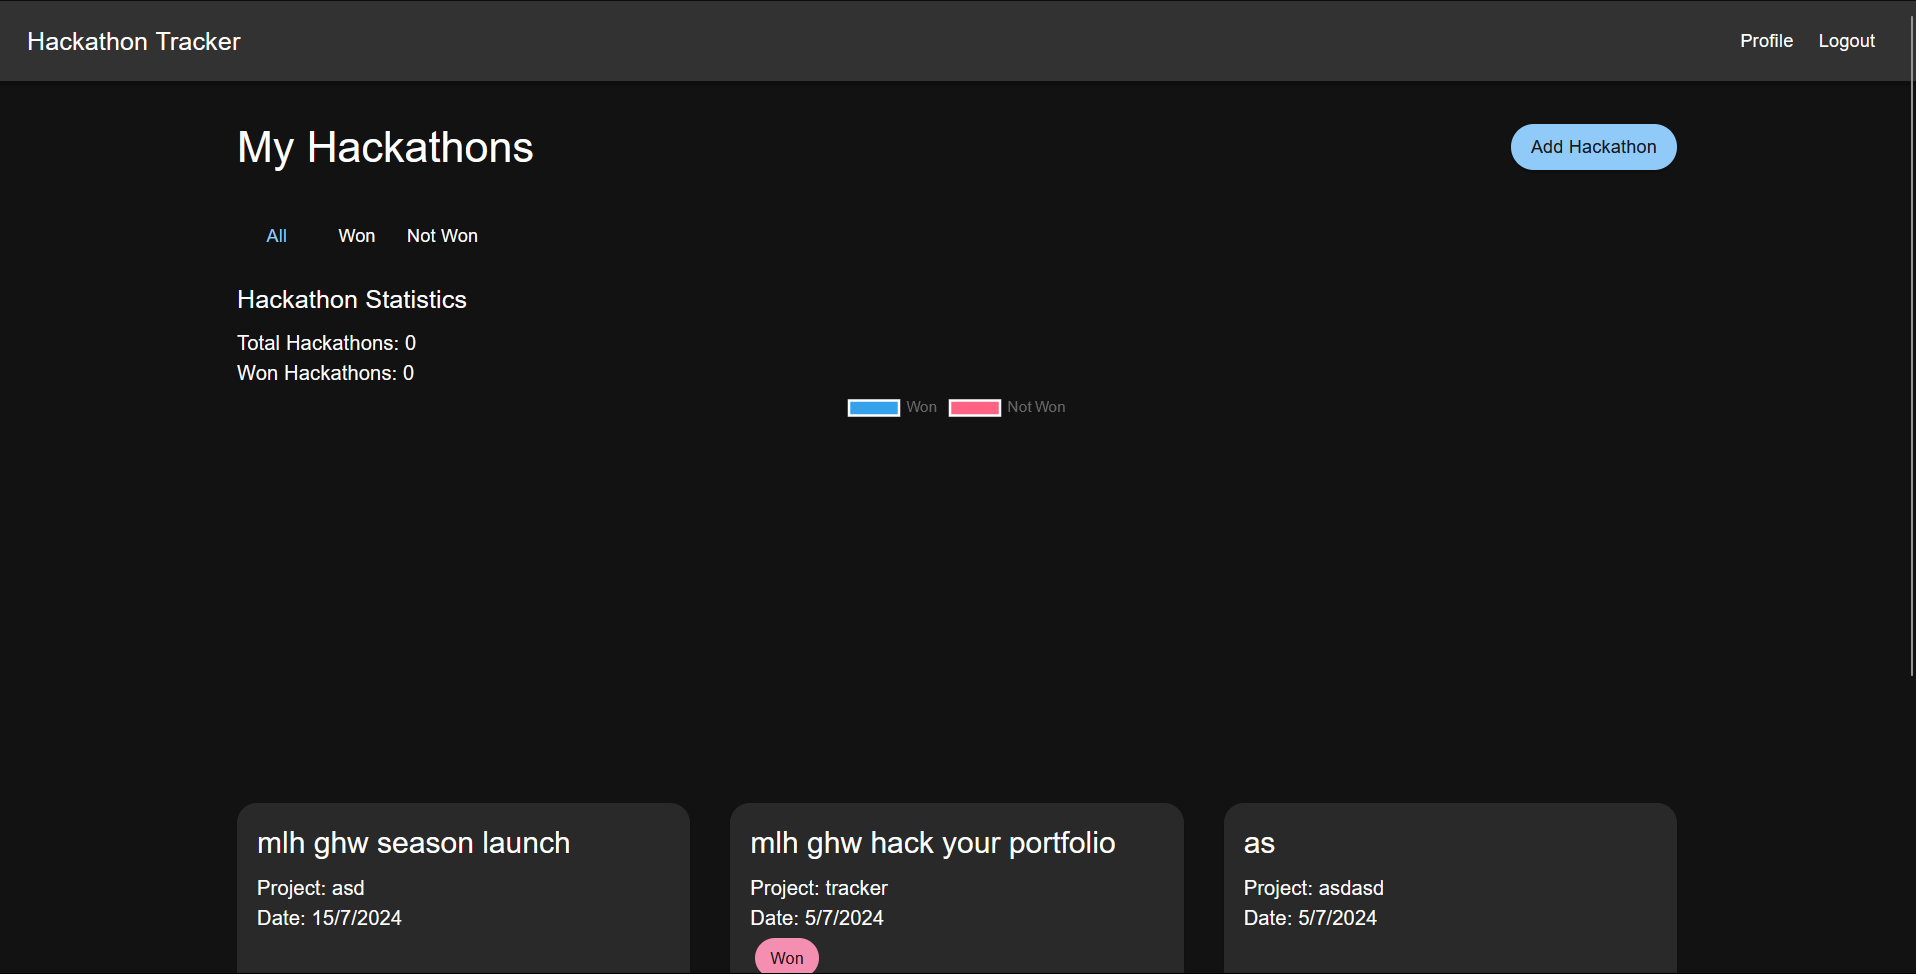
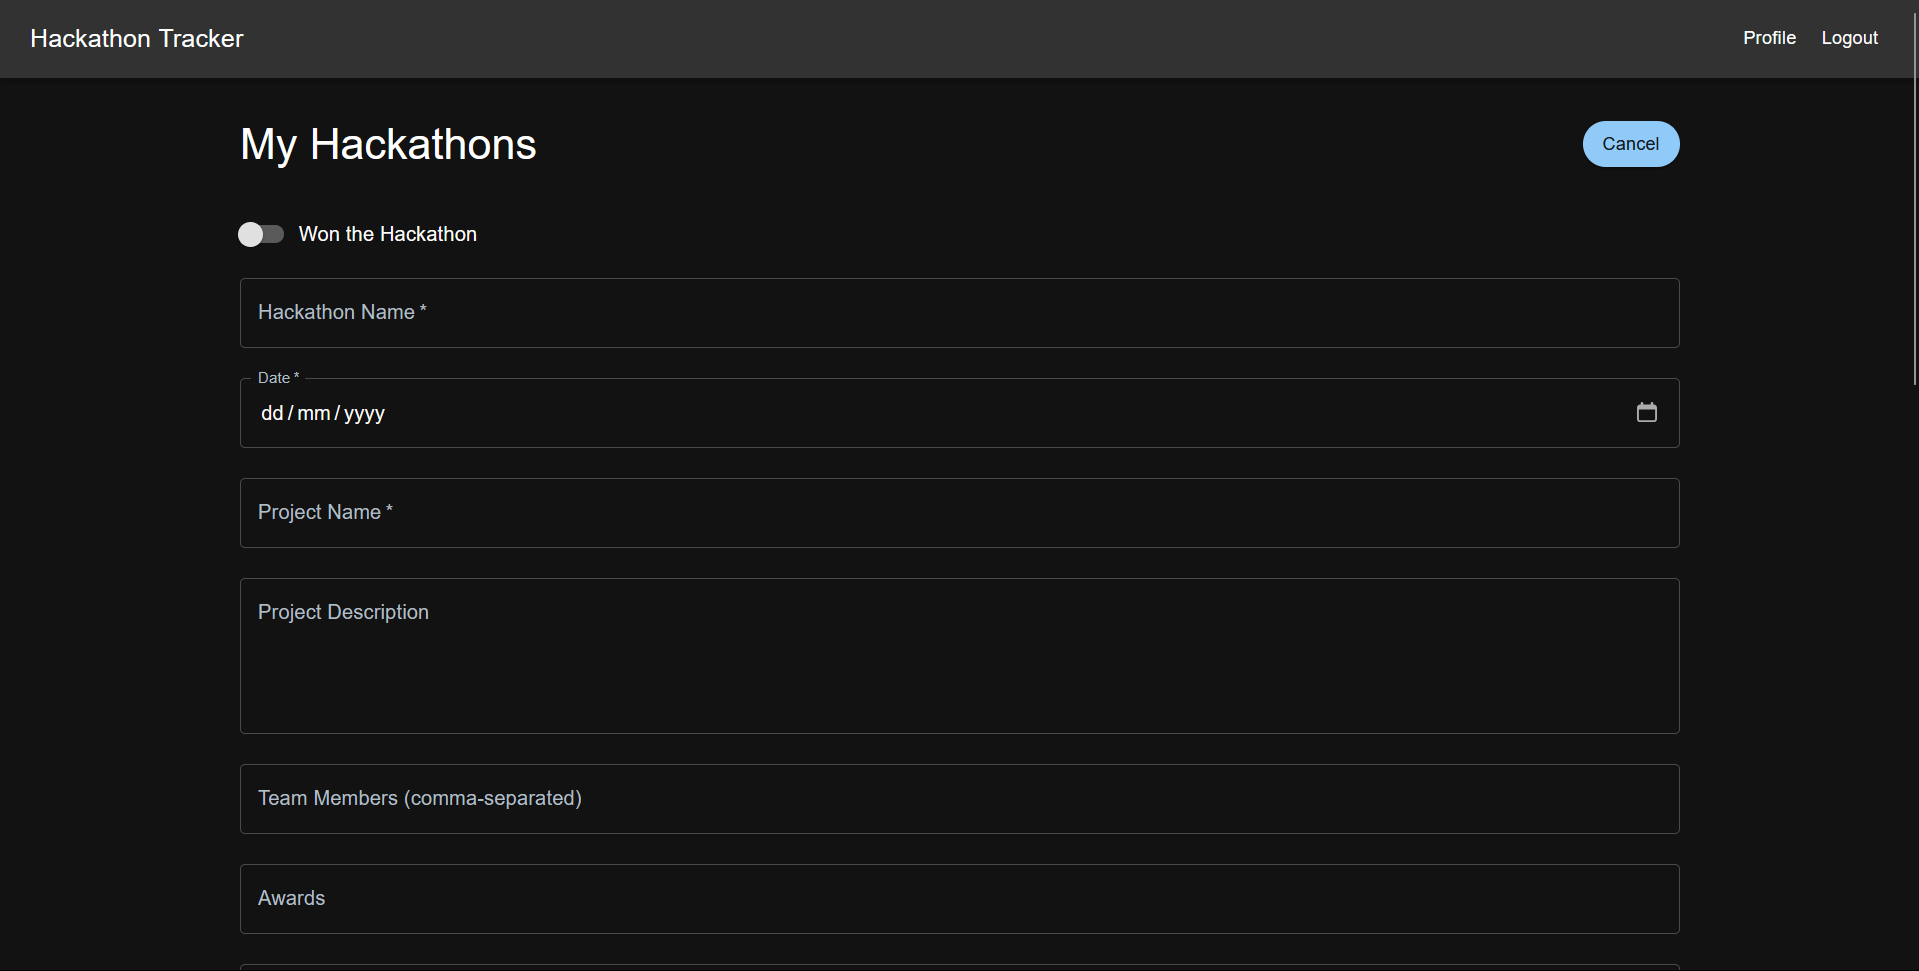
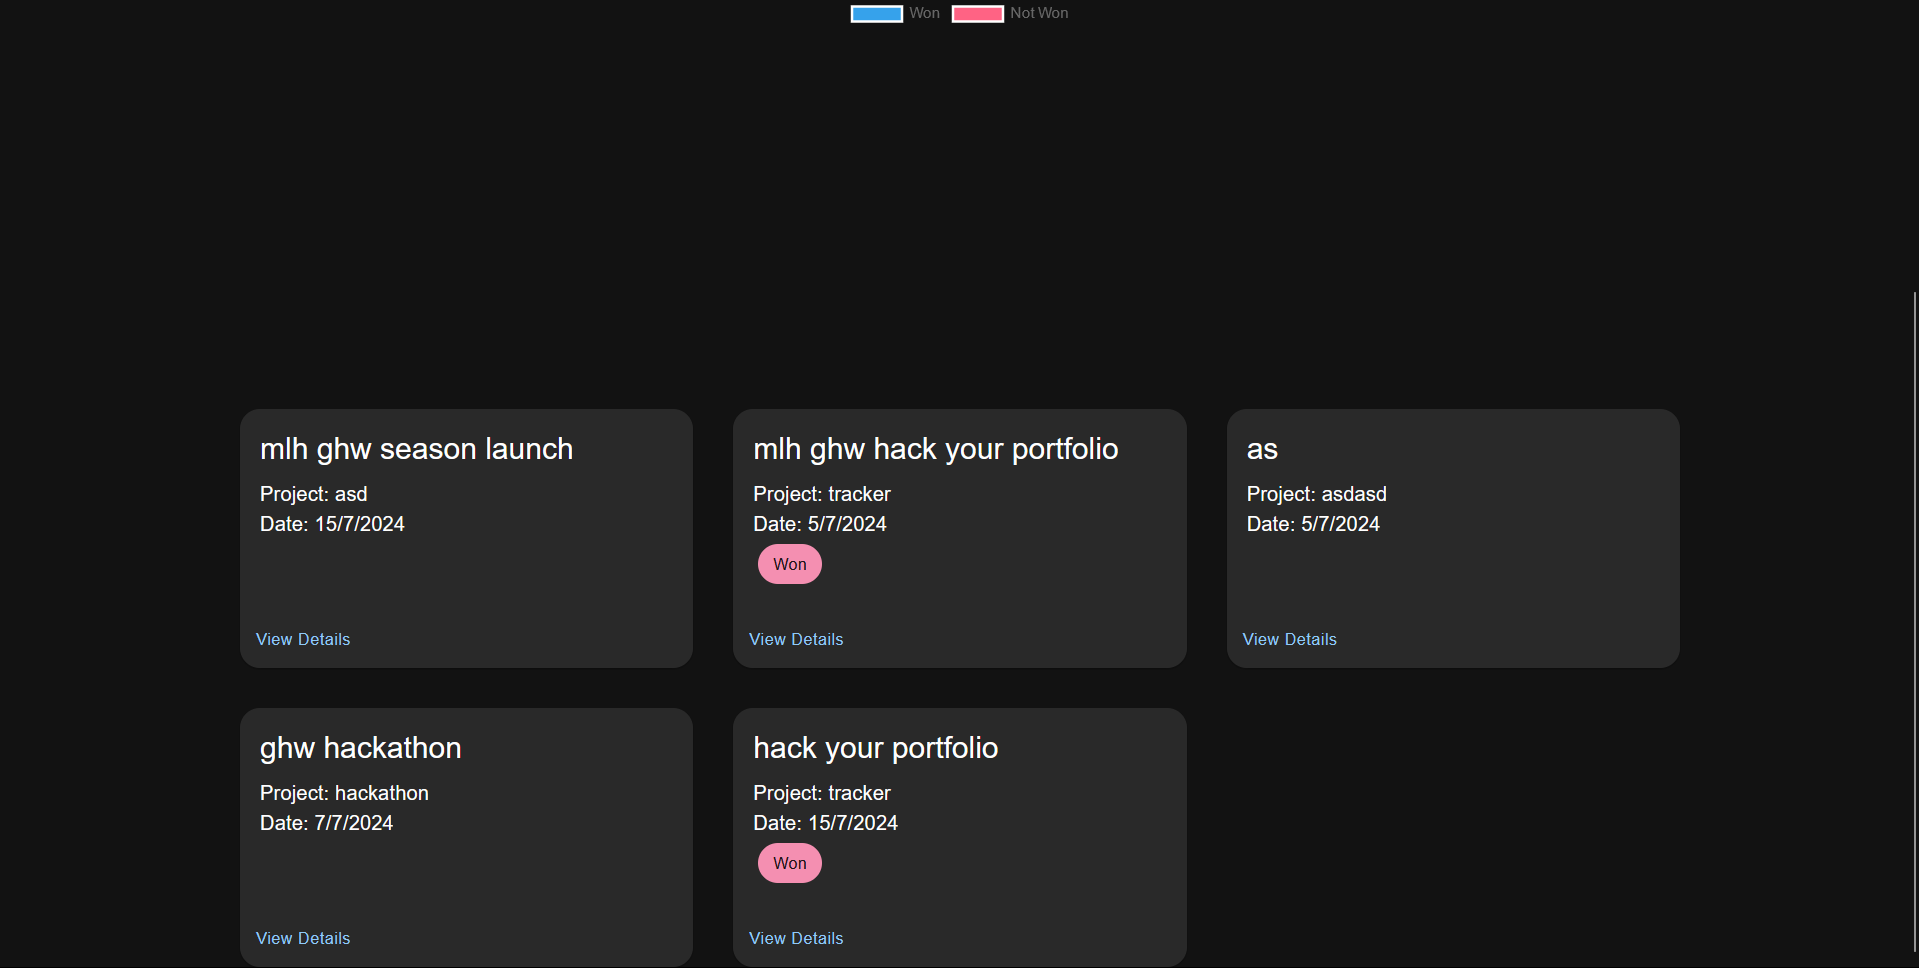
Hackathon Tracker logs hackathon events, tracks wins and losses, and displays a pie chart showing your success rate. It’s designed for easy use and clear insights into your hackathon performance.
How we built it
We built Hackathon Tracker using:
- Frontend: HTML, CSS, JavaScript
- Backend: Node.js with Express
- Data Visualization: Chart.js for the pie chart -DataBase: MongoDB for the storing Users, hackathon data and profile pictures
The frontend handles user interactions, while the backend manages data storage and API requests.
Challenges we ran into
- Data Visualization: Configuring Chart.js for accurate win/loss representation.
- User Interface Design: Creating a balance between functionality and visual appeal.
Accomplishments that we're proud of
We’re proud of developing a user-friendly app that effectively tracks hackathon events and visually represents success through a pie chart.
What we learned
We learned about data visualization techniques, user interface design principles, and integrating frontend and backend technologies.
What's next for Hackathon Tracker
Next, we plan to add features like event reminders, performance analytics, and user profiles. We also aim to improve interactivity and explore community engagement opportunities.


Log in or sign up for Devpost to join the conversation.