Inspiration
Having competed in several hackathons, we’re familiar with the kinds of projects hackers do. However, our real-world perspective is limited to the present day and to Irvine. We want the bigger picture, across various years and locations, so we created Hackalytics.
What it does
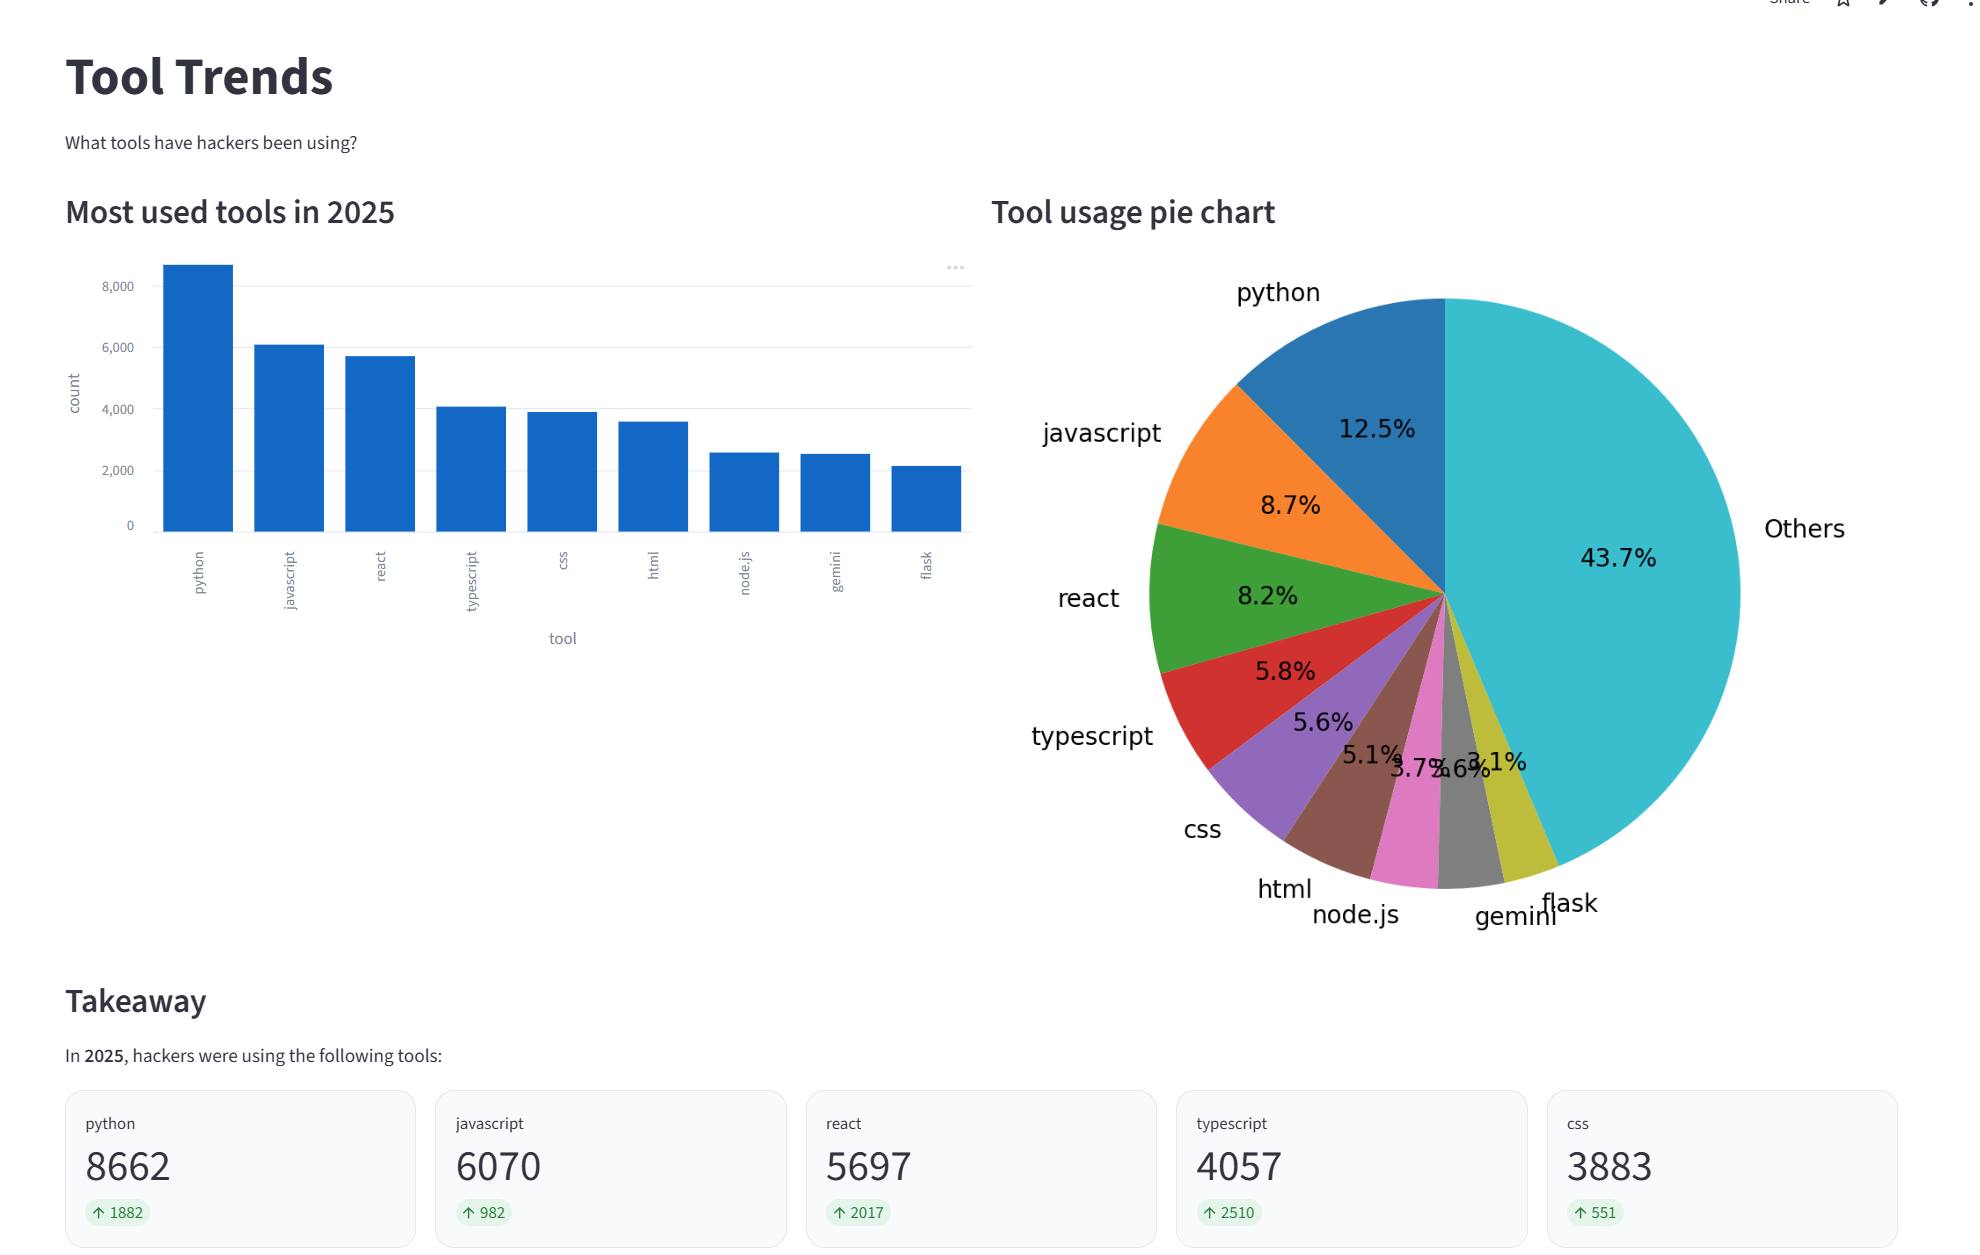
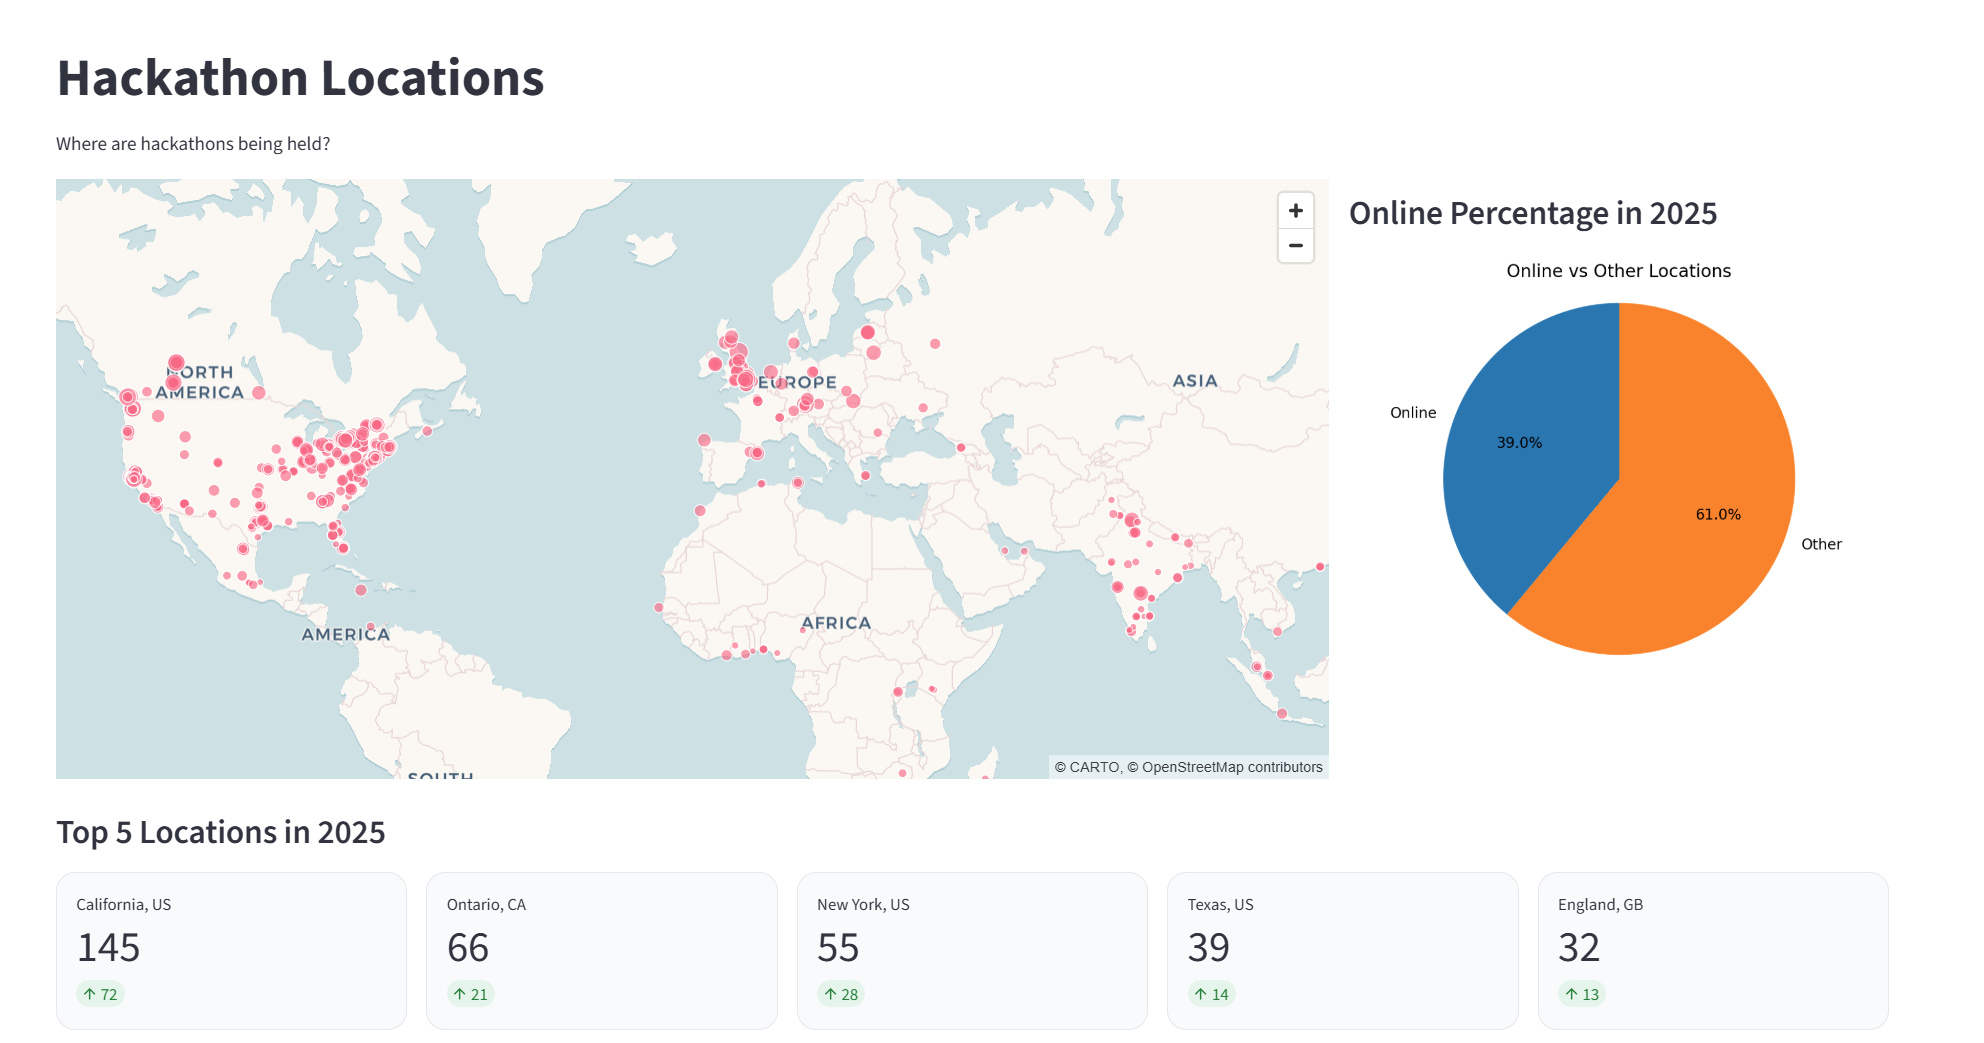
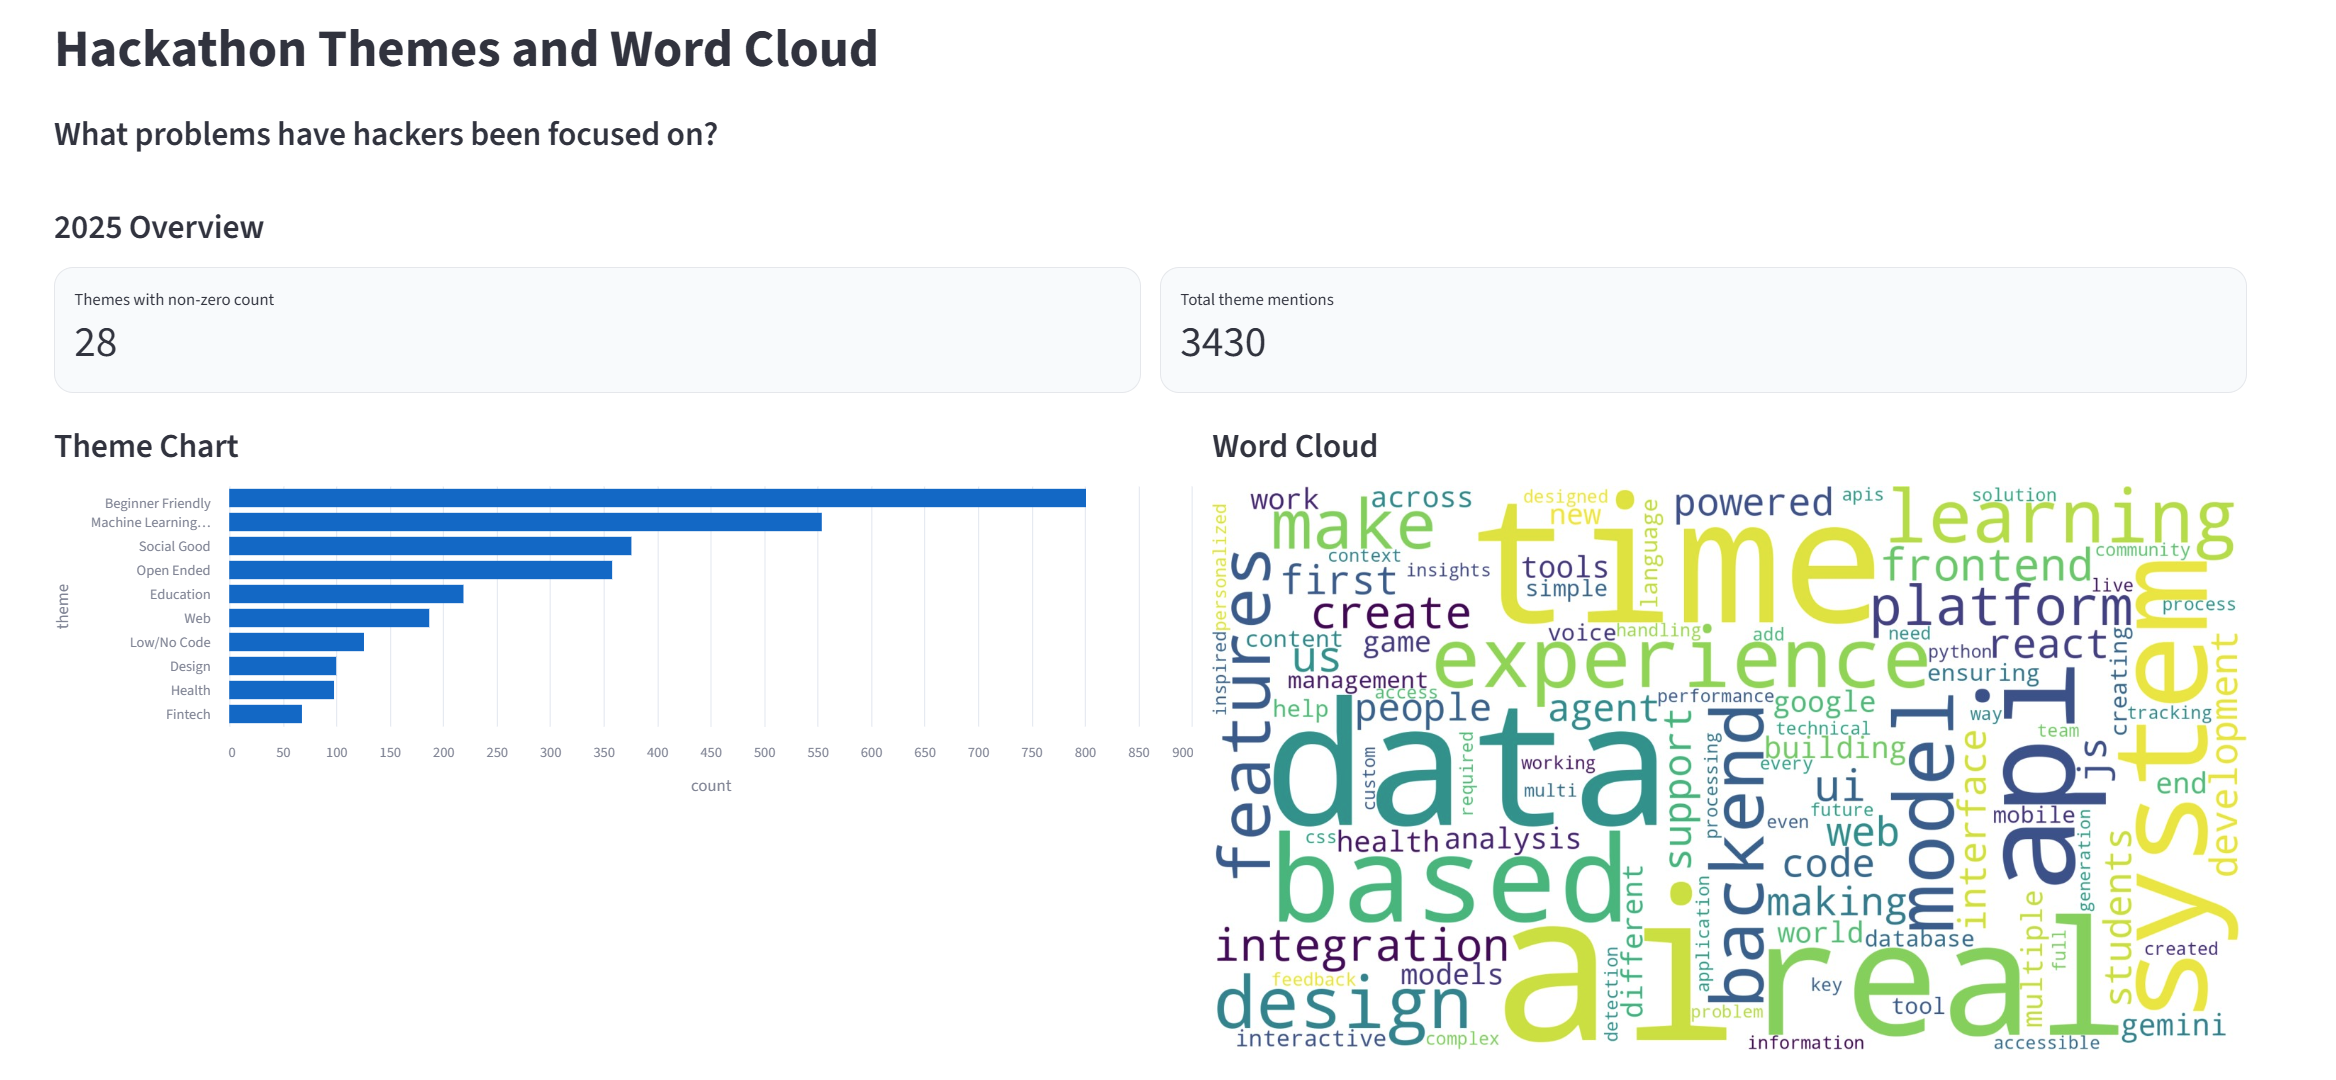
Hackalytics answers three main questions about hackathons across the years 2009 to 2025: What problems are hackers focused on? What tools are hackers using? Where are hackathons being held? We used a word cloud to show the most frequent words in the descriptions for all the years. We also used a line chart to show themes and tools. Users can select tools like “react” or “javascript” and then see a line chart of its usage over time. We also included a map to see where hackathons have been located over the years.
How we built it
We gathered the data on devpost from 2009 to 2025 for all the hackathons and most of the projects. We used the Scrapy and requests libraries to scrape hackathon data directly from Devpost. For each hackathon we collected its name, date, themes, and location. For each project we collected name, description, date, tools used, if it won, and the hackathon it was a part of. We then processed this data and cleaned it using python so we could clearly visualize it. To process the data and store it as a dataframe, we used pandas. We used matplotlib to generate graphs, pydeck for the map, and wordcloud to display a cloud of what words showed up most in the project descriptions. Finally, our webpage was made using streamlit, which we used to render the visuals we generated. To reduce the latency of our webpage, we implemented caching, so the data for each year is only processed once and reused afterwards.
Challenges we ran into
Data on Devpost isn’t in a csv format; it requires a lot of preprocessing. For example, in the “Built With” section, a lot of hackers included tools, like fastapi or tailwind, not recognized by Devpost. In our preprocessing, we disregarded these tools as they would’ve skewed our data. In addition, Devpost pages for projects include long descriptions, which mostly consist of filler words. To generate the word cloud, we had to clean that data as well. Finally, we wanted to show the most common locations of hackathons, but since many of them are online, we had to disregard those.
Initially, every time we changed the year, Streamlit was reloading and processing all the data, which negatively impacted the latency of the map. We fixed that by adding caching so the data is only processed once and reused after that.
There was also a performance issue when generating the word cloud, which took a long time to compute. We were able to reduce the computation by preprocessing the word cloud for each year’s submissions and rendering a static image, which was much faster.
Accomplishments that we're proud of
Although we had plenty of experience with Python, we were new to the streamlit library. Despite this, we were able to seamlessly integrate our graphs, tables, map, and word cloud with its interface. We collected data from nearly 9000 hackathons, compiled it into several visual representations, and designed a webpage for it, all in under 24 hours.
What we learned
We learned how to gather our own real world data and display it clearly and analyze it. We also learned how to use new libraries and frameworks like Scrapy and Streamlit.
What's next for Hackalytics
Automate scraping process and continue to add data to our database and make it run using a cron job to continually collect data.


Log in or sign up for Devpost to join the conversation.