-
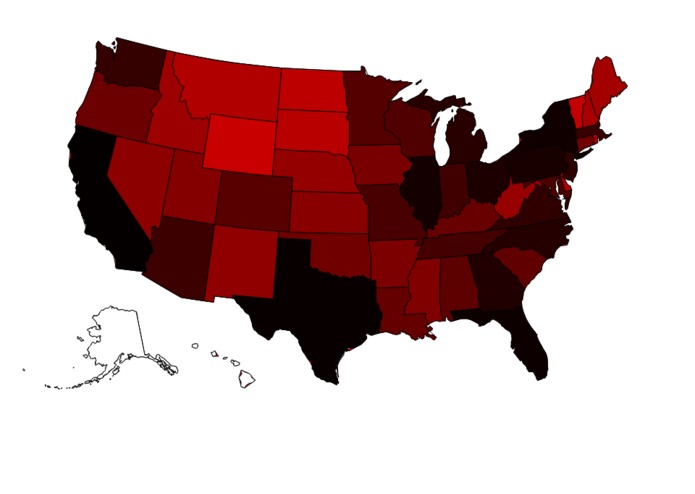
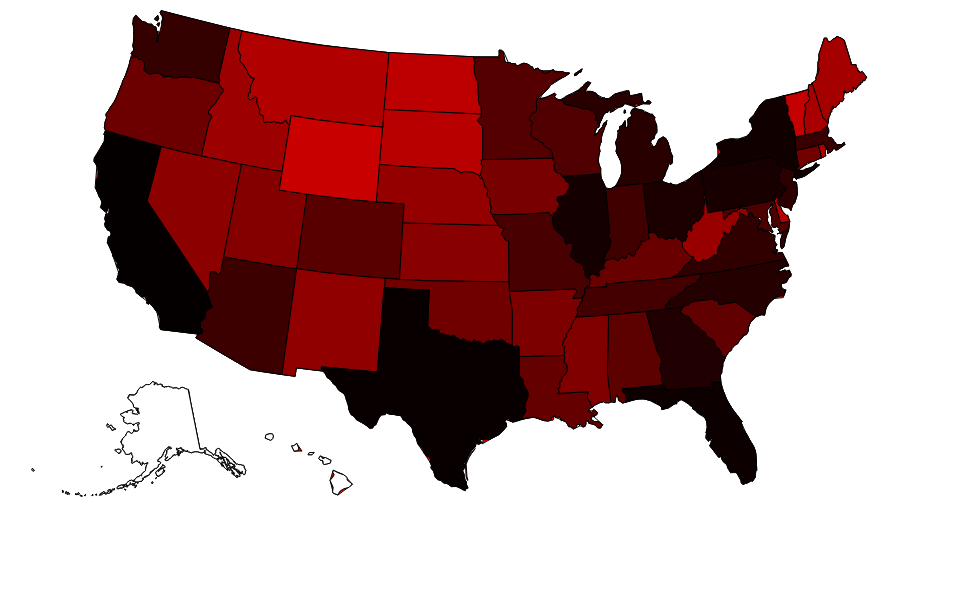
Population by state
-
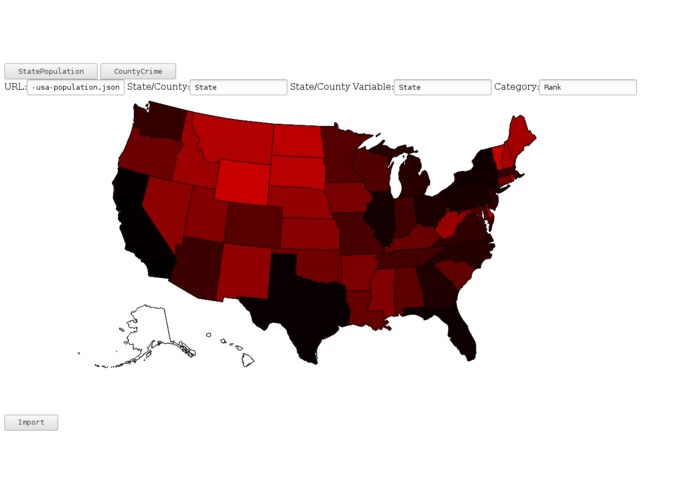
Imported Population
-
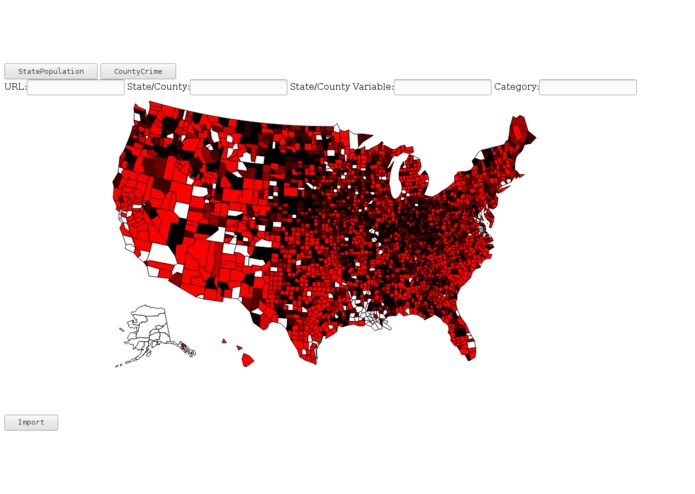
Crime Rates by county, incomplete dataset

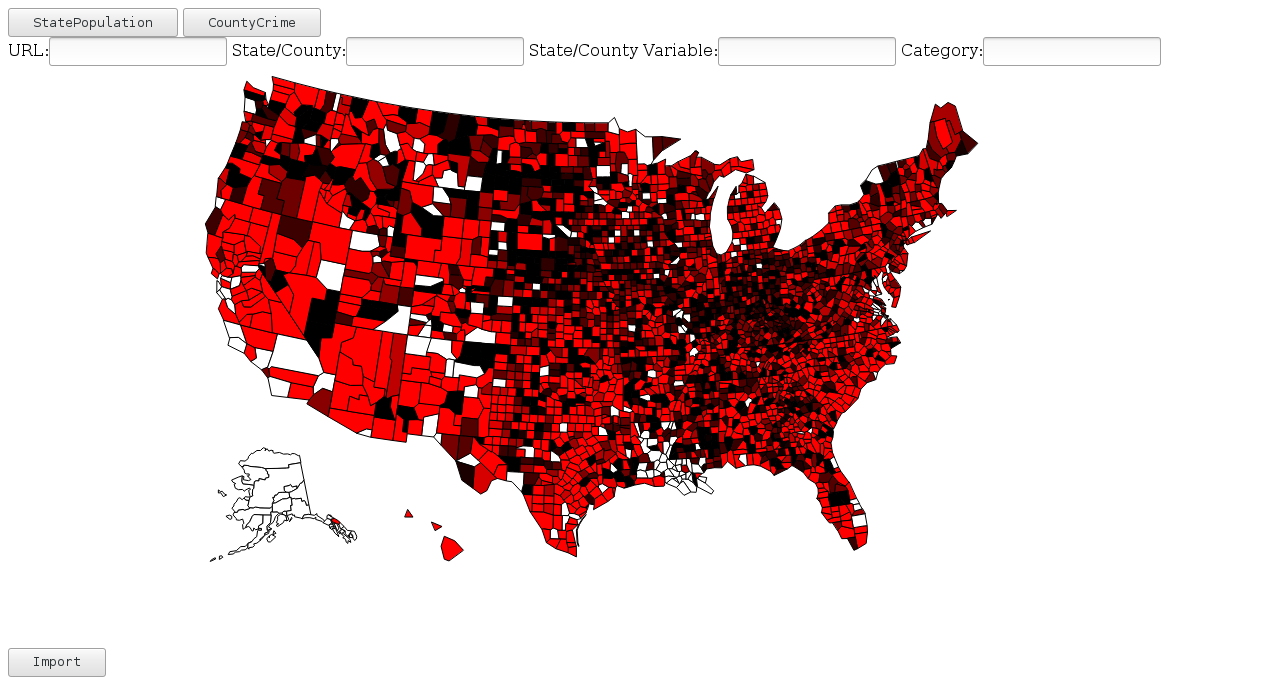
Hack_2017
We took GeoJson data to get state and county borders to visualize data on a web page. GeoJson is a data format the to contains the geographic border coordinates of objects. From this, we drew SVG lines around the the borders of each state or county depending on the data set. From this, we used crime and population data sets to colored counties and states red to black based on the density of both properties. We used NodeJs with Javascript for the entire project, making it a complete web application.


Log in or sign up for Devpost to join the conversation.