-
-

The team
-
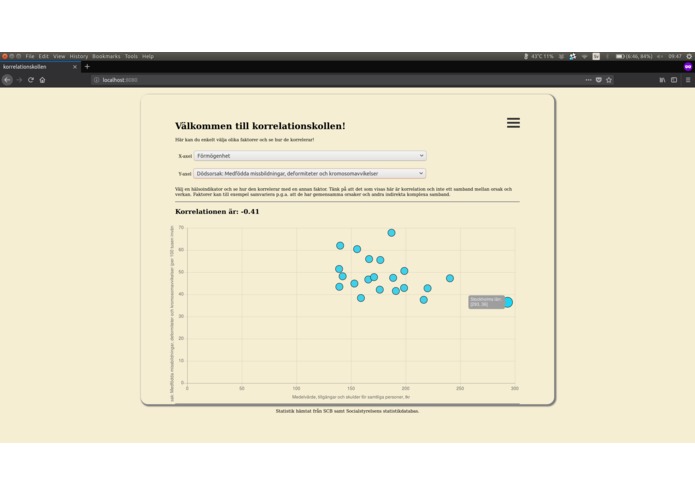
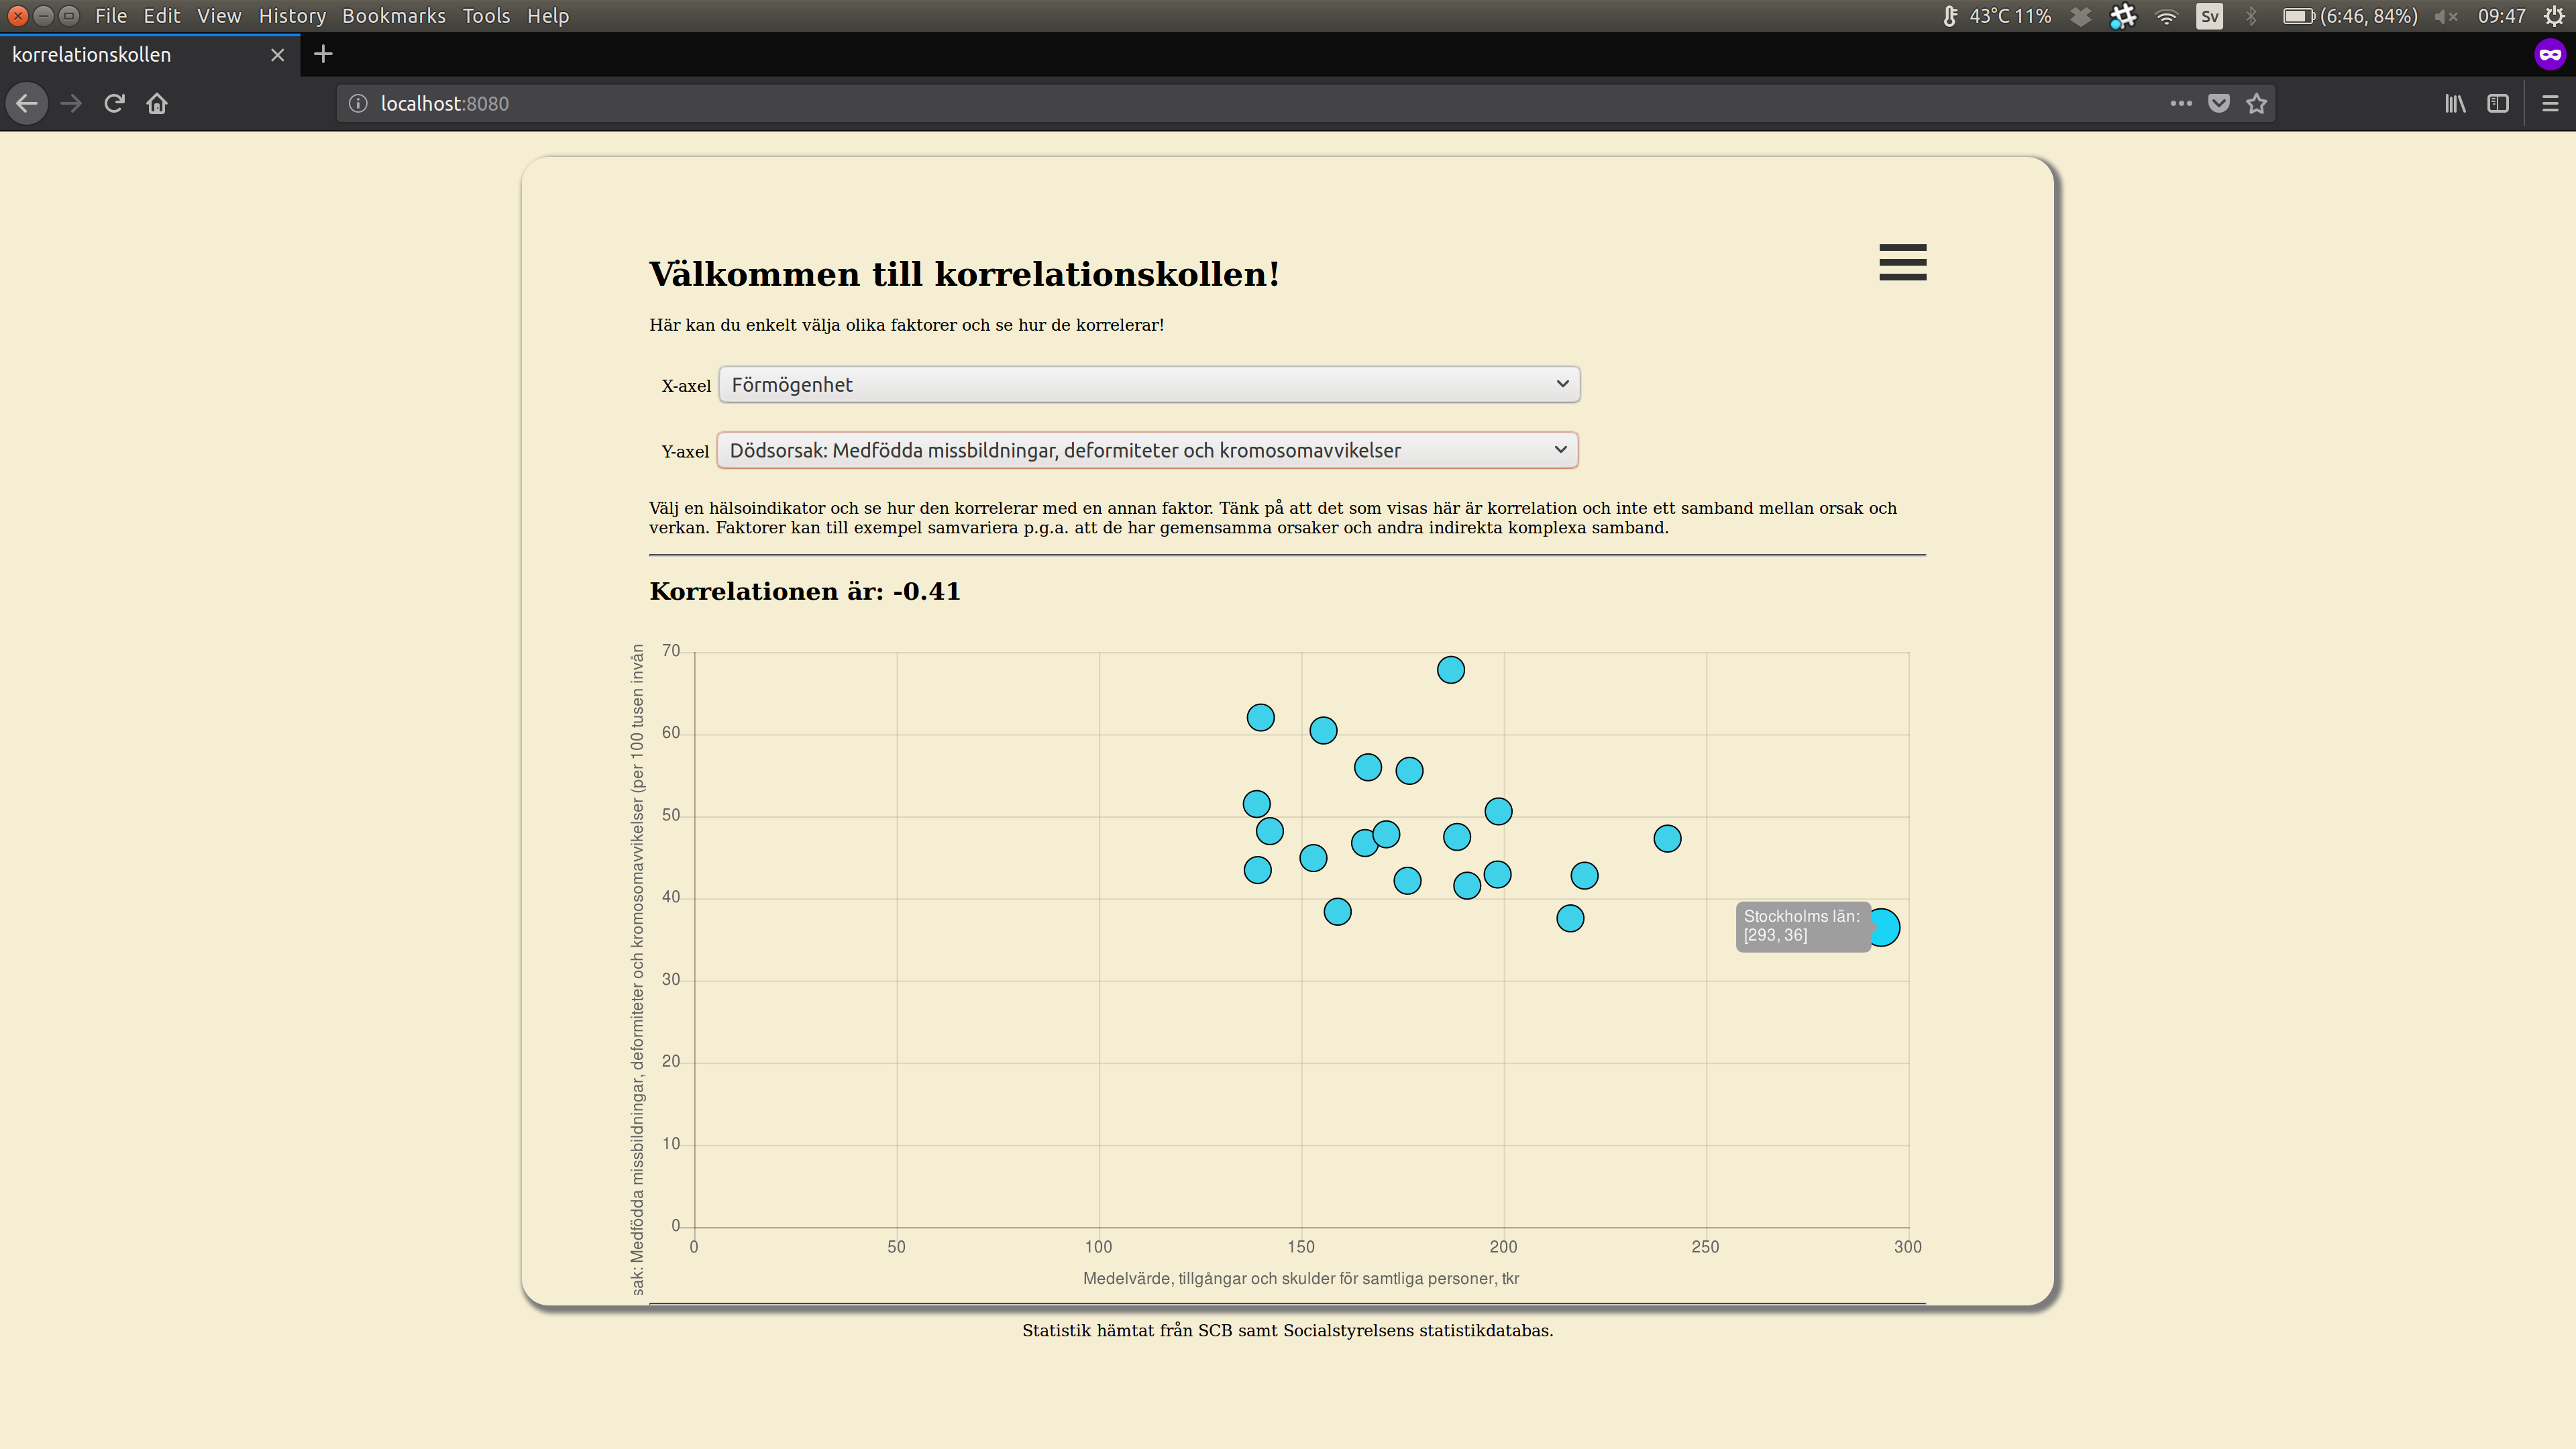
Screenshot of Korrelationskollen
-

working
-

ideation
-

working at night
-
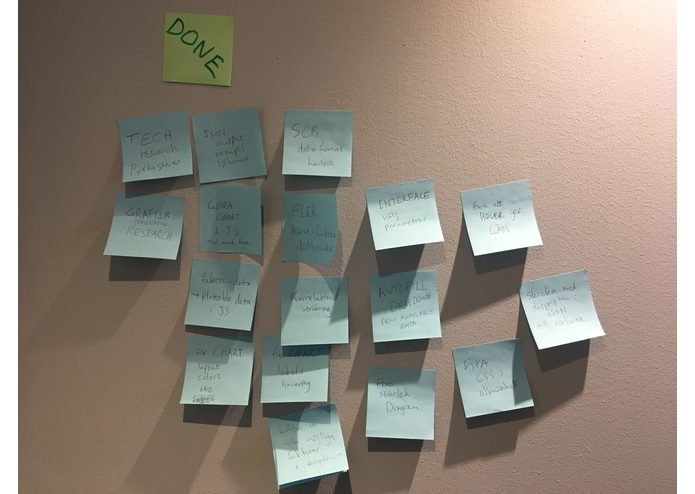
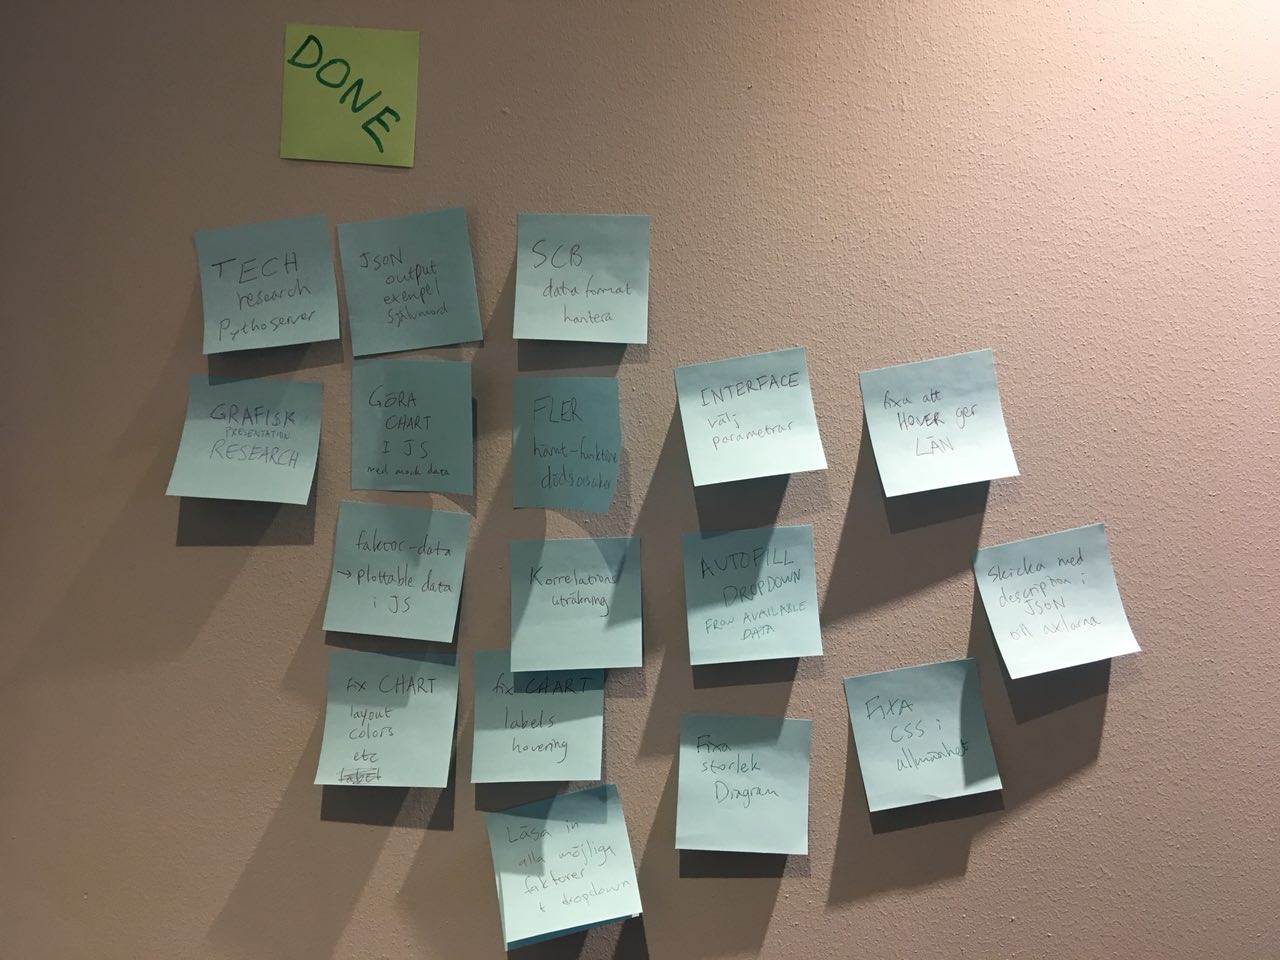
Kanban


TEAM MUMEÅ
Inspiration
The different Swedish governments agencies have a variety of data open for the public. They are however not aggregated in the same place, but rather the different institutions have their own data access points. This makes it difficult to gather and compare data from several actors, which have the possibility to give new insight into the state of Sweden and its population. Our mission was to combine different data to see wether any correlation could be found between health data and other factors in order to indentify and visualize health beneficial factors.
What it does
The application "Korrelationskollen" gathers data from Socialstyrelsen and Statistiska Centralbyrån where the former provides causes of death and the latter factors like unemployment and economic fortune. By choosing two factors, the data is averaged for each region (län) in Sweden and presented in a graph for easy visualization. The correlation between the two dataseries is calculated and presented as well.
How we build it
With a strong backend knowledge base, the focus was put on building an API that could be used with different user interfaces, or as input to other applications. We used a python server coupled with a simple javascript app.
Challenges we run into
The main challenge was to find relevant data, that was both accessible in a managable format and had the right geographical resolution (Sweden's 21 regions in our case).
Accomplishments
We managed to write a generalized API that can access the data that is available, which means that it will be updated when the data sources are.
What we learned
We learned the potential in looking at data from different sources, since even though the governmental agencies have their separate subject areas, there are most likely correlations to be found and evaluated!
Whats next
- Include more agencies and more data factors.
- Use more data for the correlation calculations (match time periods)
- Extend the functionality to handle data for each municipality in Sweden for example.
- Map visualizations.
Nima
Backend
CSS
Bash Ninja
DJ
Louise
Backend
Frontend
Statistics
Miriam
Frontend
API
Fredrik
Backend
API
Emilia
Backend
API


Log in or sign up for Devpost to join the conversation.