-
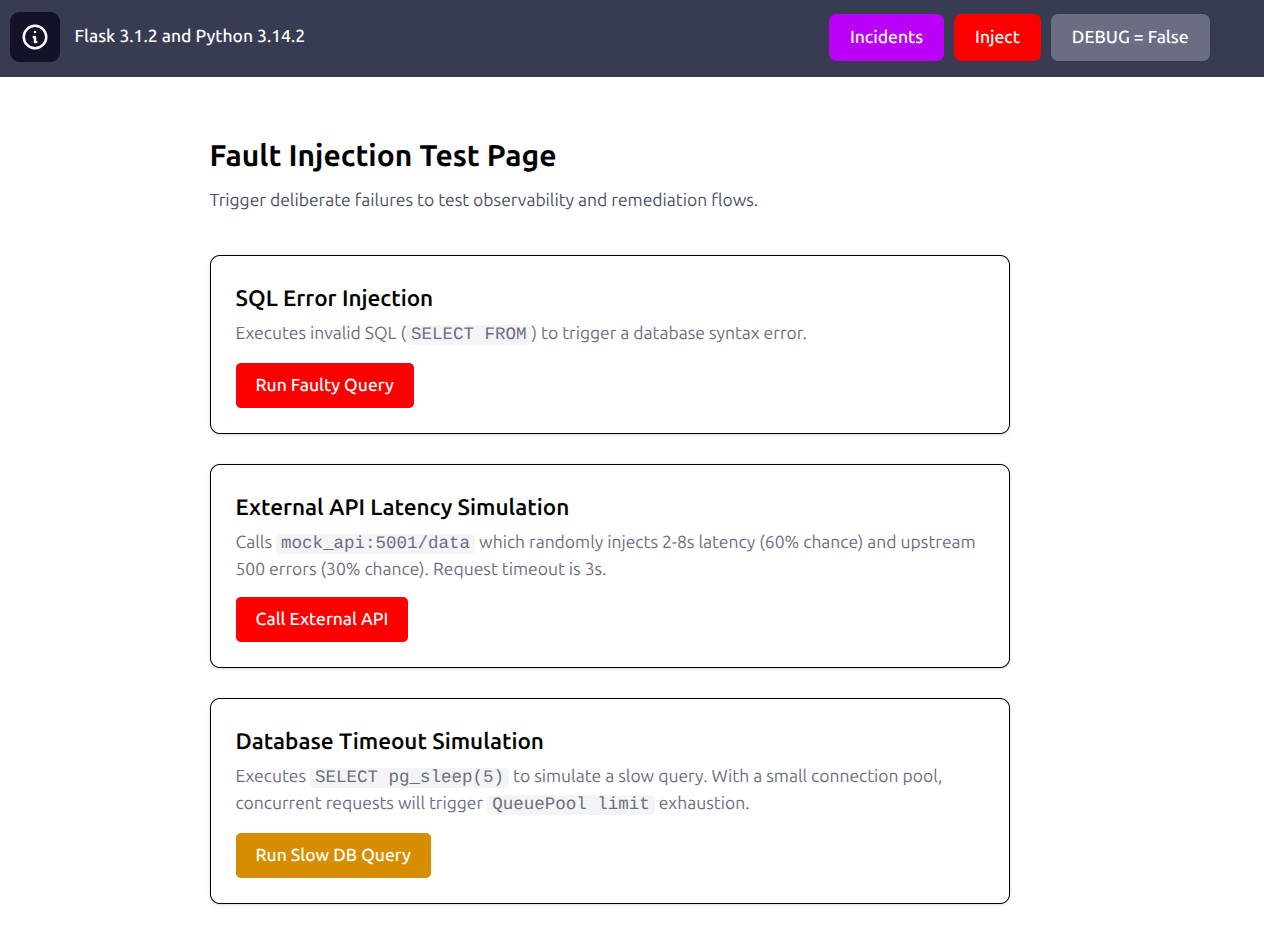
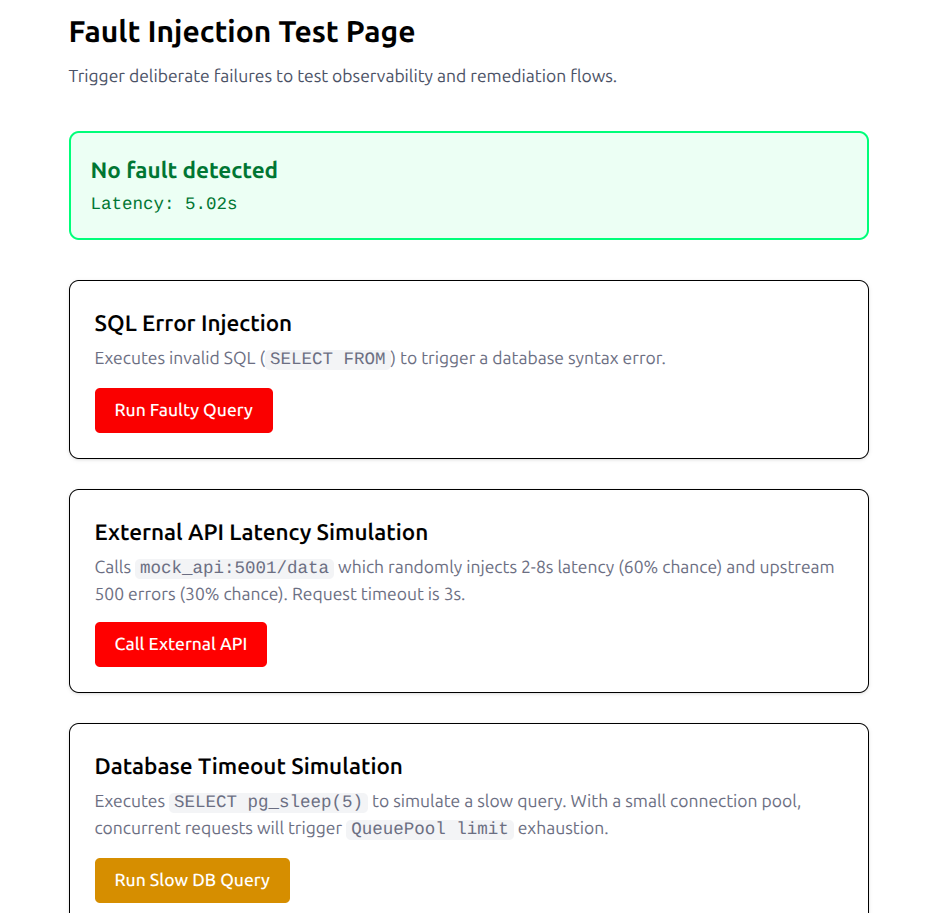
Error Injection Page
-
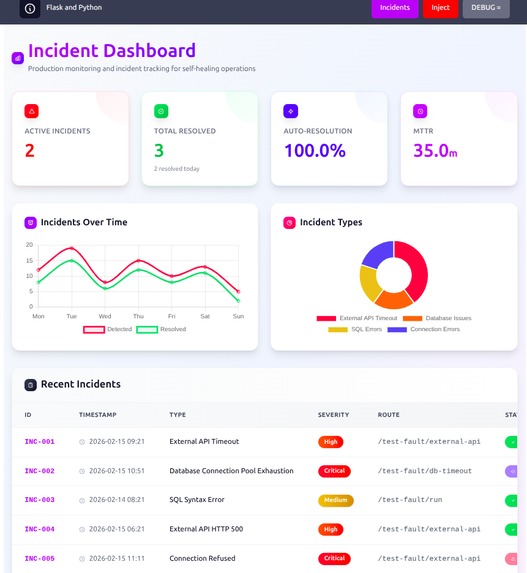
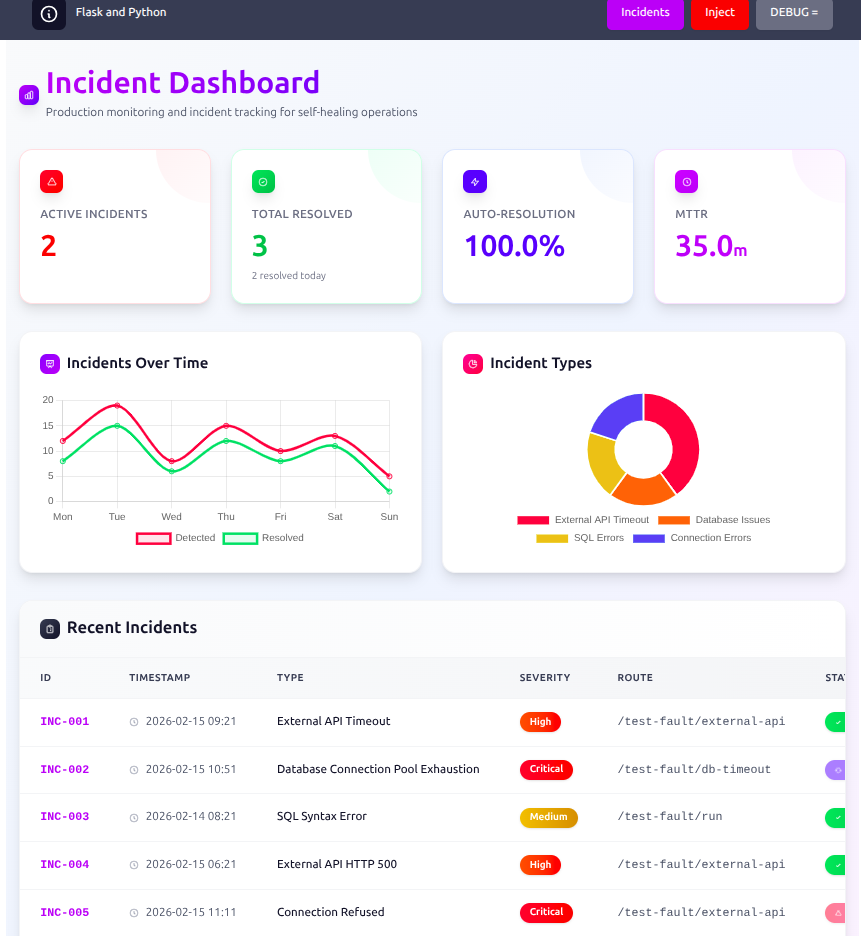
DashBoard Overview
-

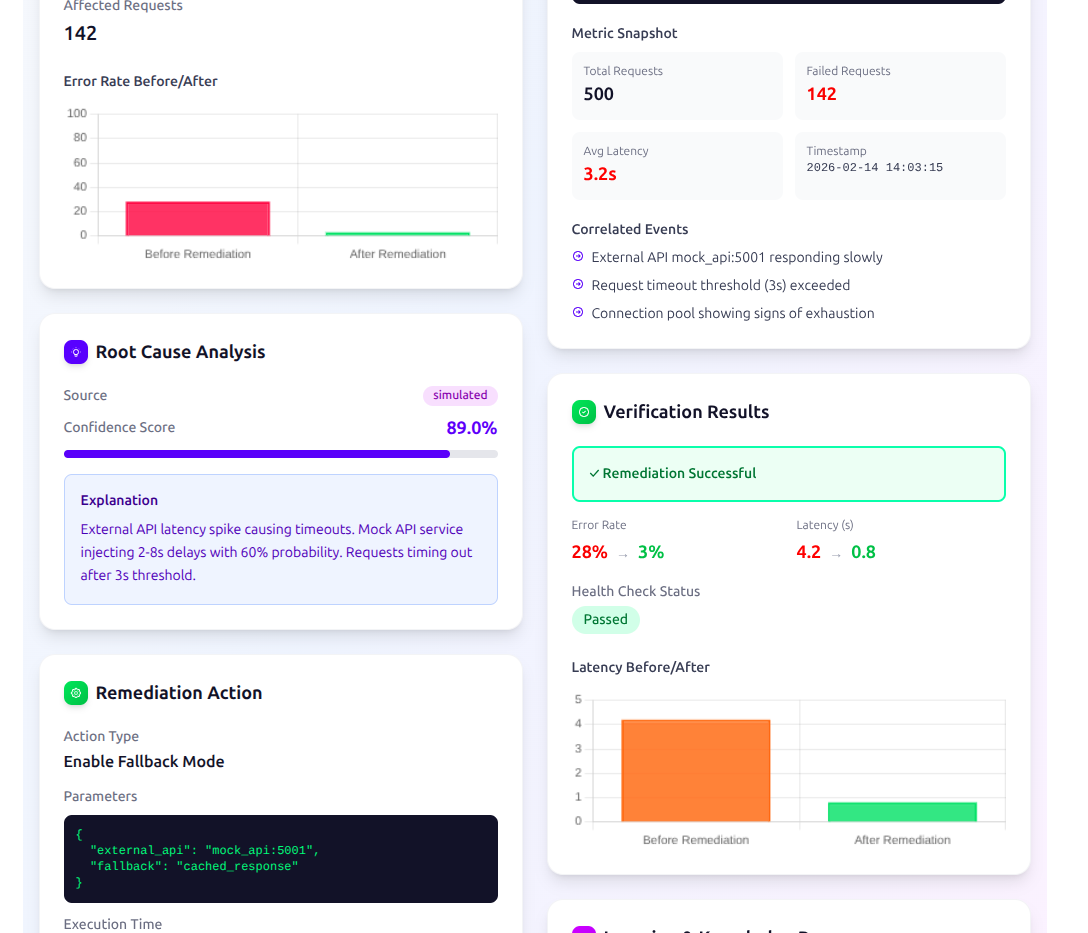
Root Cause Analysis
-
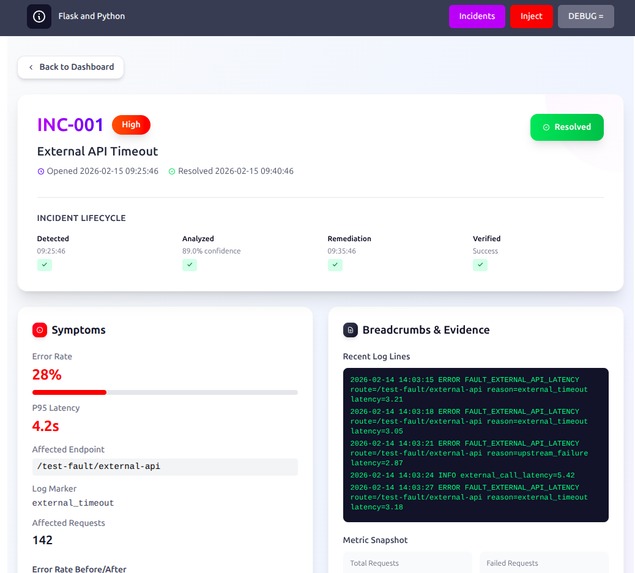
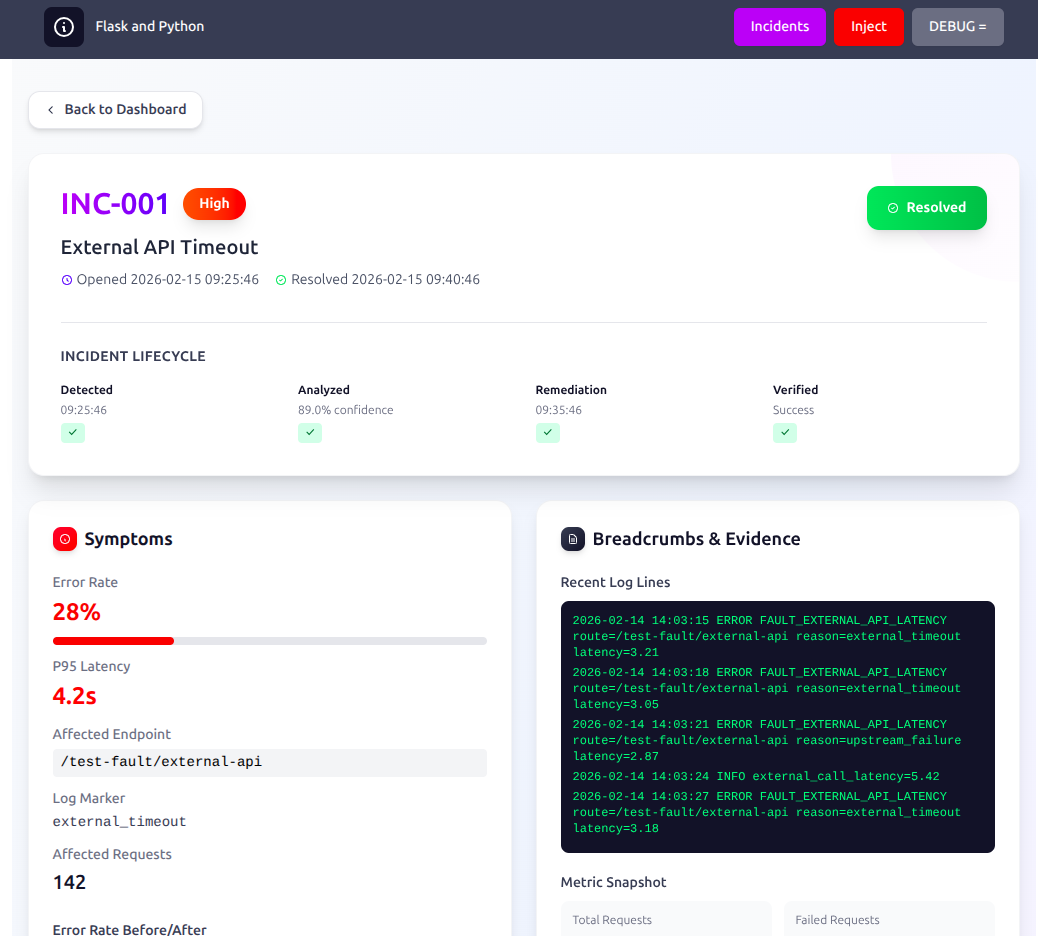
Particular Ticket detail view
-

DB Timeout Issue
CreamAndOnion — AI-Assisted Self-Healing Web Application
HackNC State | Software Reliability Engineering
Inspiration
Modern production systems fail even when the code is perfect. You can have 100% test coverage and still get paged at 3 AM because an upstream payment API started timing out, a missing database index triggered a full table scan under real traffic, or a connection pool silently drained while background jobs piled up.
Standard CI/CD pipelines catch code bugs. They don't catch runtime behavior under real load. They can't see that your ORM query takes 12 seconds on production data, that a retry storm is amplifying a transient upstream blip into a cascading outage, or that a circuit breaker should have opened ten seconds ago.
We wanted to build a system that does exactly that — one that watches a live application, detects anomalies as they happen, reasons about root causes using AI, and presents safe remediations automatically. Not a monitoring dashboard you have to look at. An autonomous reliability layer that acts.
What It Does
CreamAndOnion is a containerized, production-grade Flask web application layered with an autonomous incident response system. When a fault is triggered:
- Fault fires — the endpoint executes the fault, catches the exception, and emits a structured log marker to stdout
- Incident recorded — a structured
Incidentrecord is immediately created in PostgreSQL with the error code, symptoms, and breadcrumbs - RAG retrieval runs — the incident is sent to Backboard.io, which performs semantic vector search over 15 pre-seeded incident examples and returns the most relevant past incidents as context
- Lambda triggers Gemini — an AWS Lambda function picks up the incident, combines the RAG context with the error details, and calls the Gemini API to generate a concrete code fix
- Fix merged and deployed — the Gemini-generated patch is committed, pushed to
main, and the CI/CD pipeline deploys it automatically to ECS Fargate - Dashboard updates live — the developer dashboard receives the event over Server-Sent Events backed by Redis pub/sub — no page refresh needed
- System learns — the resolved incident is re-indexed into Backboard so future queries benefit from accumulated history
The entire pipeline — from fault trigger to AI-generated code fix deployed to production — runs without any human intervention.
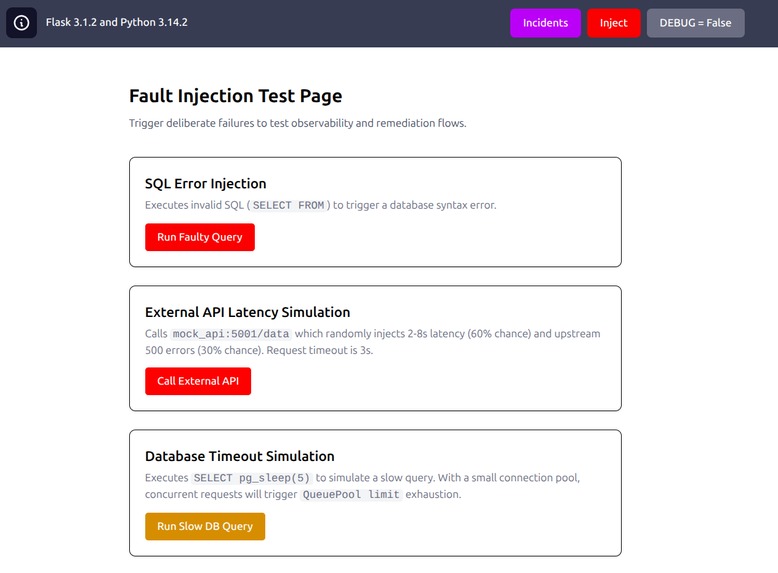
Fault Injection Layer
We built three controlled fault modes, each mapped to a distinct real-world failure class. Fault injection is gated behind an ENABLE_FAULT_INJECTION environment flag — enabled in staging, disabled in production.
| Fault Endpoint | Failure Simulated | Log Marker |
|---|---|---|
POST /test-fault/run |
Malformed SQL → application 500 | FAULT_SQL_INJECTION_TEST |
POST /test-fault/external-api |
Upstream latency + HTTP 500 | FAULT_EXTERNAL_API_LATENCY |
POST /test-fault/db-timeout |
pg_sleep(5) → connection pool exhaustion |
FAULT_DB_TIMEOUT |
Each fault emits a deterministic, machine-readable log marker on stdout that CloudWatch ingests and the RAG system queries downstream.
SQL Syntax Error
Executes a deliberately malformed SQL statement (SELECT FROM with no columns or table) directly against PostgreSQL. The application catches the database exception, emits FAULT_SQL_INJECTION_TEST, and returns a controlled HTTP 500 rather than leaking raw SQL error details to the caller.
Real-world analogy: ORM misconfiguration or broken migration reaching production.
External API Latency & Errors
The mock API randomly introduces 2–8 second delays (60% probability) or HTTP 500 failures (30% probability). The Flask endpoint calling this mock API exercises the full resilience stack: exponential backoff retry and a circuit breaker.
Real-world analogy: A payment gateway or OAuth provider degrading during peak traffic.
Database Connection Pool Exhaustion
Executes SELECT pg_sleep(5) — a blocking query that holds a database connection for 5 seconds. Under concurrent load this saturates the SQLAlchemy connection pool, causing subsequent requests to time out waiting for a free connection.
Real-world analogy: A missing index causing a full table scan on a large dataset, or a long-running transaction left open by a background job.
Resilience Patterns
The external API fault path was hardened with two production-grade resilience patterns applied directly in application code — not at the infrastructure level.
Exponential Backoff Retry
- Up to 3 retry attempts on timeout or upstream server error
- Delay doubles on each attempt: 1s → 2s → 4s
- Handles
TimeoutError,HTTPError, andConnectionError - Resets failure count on a successful response
Circuit Breaker
- Tracks consecutive failure count in Flask application context, persisted across requests
- Opens the circuit after 3 consecutive upstream failures
- While open, returns HTTP 503 immediately — no upstream call is made, request latency stays low
- Holds the open state for a 60-second cooldown window before allowing traffic through again
- Prevents a struggling dependency from cascading its instability into the rest of the application
These two patterns together mean the application degrades gracefully under upstream pressure rather than queueing up blocked threads until the process dies.
Mock External API
A standalone Flask service (mock_api.py) runs on port 5001 and simulates an unreliable upstream dependency:
- 60% of requests: random latency between 2–8 seconds injected before responding
- 30% of requests: immediate HTTP 500 upstream failure returned
- Controlled via
API_FAULT_MODE=latency,errorenvironment variable — can be switched to fully healthy or fully broken mode for testing
This gives the circuit breaker and retry logic a realistic failure surface to operate against without relying on an actual third-party service being degraded.
RAG-Powered Incident Analysis
When an incident is recorded, it is immediately sent through a full Retrieval-Augmented Generation pipeline backed by Backboard.io.
Setup: A persistent Backboard assistant is created and primed with a system prompt defining its role as an incident analysis engine with knowledge of the application's architecture, fault types, and allowed remediation actions.
Knowledge Base Seeding: 15 hand-authored incident examples — 5 per fault type — are uploaded as documents to the Backboard vector store via flask seed-kb. Each entry contains:
- Symptom description and raw log markers
- Breadcrumb trail of events leading to the fault
- Root cause analysis
- Step-by-step remediation procedure
- Verification steps to confirm recovery
Query: When a new incident arrives, a natural language query is constructed from its symptoms and log markers and sent to Backboard. The platform retrieves semantically similar past incidents from the vector store and returns them as grounded context for the next stage.
Gemini Code Fix: The retrieved context is passed to an AWS Lambda function, which calls the Gemini API with the incident details, error trace, and RAG context. Gemini reasons about the root cause and generates a concrete code-level fix.
Auto-deploy: The generated patch is committed and pushed to main, triggering the CI/CD pipeline which builds, pushes to ECR, and deploys the fix to ECS Fargate automatically.
Storage: The RAG response, Gemini output, and confidence score are written back to the incident record in PostgreSQL.
Re-indexing: Once the fix is deployed and the incident is marked resolved, it is uploaded as a new document to Backboard. The system's knowledge base grows with every incident handled — next time a similar fault appears, the retrieval is richer.
Incident Recording
Every fault is captured as a structured Incident record in PostgreSQL via SQLAlchemy ORM, with schema managed by Alembic migrations:
error_code— the deterministic fault marker (FAULT_SQL_INJECTION_TEST, etc.)symptoms— description of observed behaviorbreadcrumbs— JSON list of log markers and event trailroot_cause— extracted from the RAG responseremediation— recommended action from RAGverification— verification steps from RAGrag_query— the exact query sent to Backboardrag_response— the full LLM-synthesized analysisrag_confidence— confidence score returned by Backboardbackboard_doc_id— document ID after the resolved incident is re-indexedresolvedflag,detected_at,updated_attimestamps
Developer Dashboard & SSE Stream
The developer dashboard at /developer/incidents gives a real-time view into the incident pipeline as it runs.
New incidents are pushed to the browser over Server-Sent Events (SSE) backed by a Redis pub/sub channel — no polling, no page refresh. The moment a fault is triggered and the RAG pipeline writes its result, the dashboard updates live. A heartbeat is sent every 25 seconds to keep the connection alive, and per-thread queues are cleaned up on client disconnection.
Events published on the incidents:sse channel:
created— new incident recordedanalyzed— RAG analysis completed and storedresolved— incident marked resolved and re-indexed
Each incident detail view shows the full RAG analysis output — root cause, remediation steps, confidence score — alongside the raw log markers that triggered it.
Infrastructure & Deployment
Containerization
Multi-stage Dockerfile in three stages:
- Stage 1 (assets): Node 24 — builds JavaScript and CSS via esbuild and Tailwind CSS
- Stage 2 (app-build): Python 3.14 + uv — installs Python dependencies
- Stage 3 (app): Minimal runtime image — copies compiled assets and Python environment, no build tooling in production
Docker Compose orchestrates local development with services for the Flask web server, PostgreSQL, Redis, asset builders, and the mock API.
Amazon ECR
All Docker images are built and pushed to Amazon Elastic Container Registry (creamandonion repository, us-east-1). Each image is tagged with the commit SHA and latest. The CI/CD pipeline uses these tags to guarantee every deployment is traceable to an exact source commit.
Amazon ECS Fargate
The application runs on ECS Fargate — no EC2 instances to provision or manage:
- Cluster:
creamandonion| Service:cream-task-service - 3 containers per task: Flask app (port 8000), PostgreSQL (port 5432), Mock API (port 5001)
- Network mode:
awsvpc— each task gets its own ENI and private IP - CPU: 512 units / Memory: 3072 MB
- PostgreSQL health check:
pg_isready -U hellowith 10s interval and 5 retries
ECS handles container scheduling, health-based replacement, and rolling deploys triggered automatically by the CI/CD pipeline on every push to main.
Amazon CloudWatch
All container stdout/stderr ships to CloudWatch Logs automatically via the awslogs log driver:
- Log Group:
/ecs/cream-taskwith per-container log streams - Structured fault markers (
FAULT_SQL_INJECTION_TEST,FAULT_EXTERNAL_API_LATENCY,FAULT_DB_TIMEOUT) are queryable via CloudWatch Logs Insights for post-incident analysis and pattern correlation - The application also supports the
watchtowerPython library for more granular log stream control when needed
Secret Management
SECRET_KEYstored as a GitHub Actions secret, injected into the ECS task definition at deploy time — never in source control- Task Execution Role (
ecsTaskExecutionRole): ECR pull + CloudWatch write — containers never hold these credentials directly - Task Role (
cream-task-role): short-lived, automatically rotated IAM credentials available via the ECS metadata endpoint - No long-lived credentials embedded in containers, environment files, or images at any layer
CI/CD Pipeline
| Workflow | Trigger | Action |
|---|---|---|
aws.yml |
Push to main |
Build all 3 images → push to ECR → render task definition with injected secrets → force new ECS deployment |
build-and-push.yml |
Push to main or manual |
Build app image → push to GitHub Container Registry |
ci.yml |
PRs + daily schedule | Run full test suite inside Docker Compose |
Technology Stack
| Layer | Technology |
|---|---|
| Web Framework | Flask 3.1.2 |
| ORM + Migrations | SQLAlchemy 2.0 + Alembic |
| Database | PostgreSQL 18.1 |
| Cache / Pub-Sub | Redis 8.4.0 |
| RAG Platform | Backboard.io (vector retrieval) |
| LLM / Code Fix | Gemini API |
| Serverless Trigger | AWS Lambda |
| Async HTTP | httpx 0.28 |
| WSGI Server | Gunicorn 25.0 |
| Container Registry | Amazon ECR |
| Container Compute | Amazon ECS Fargate |
| Observability | Amazon CloudWatch Logs |
| Secret Management | GitHub Secrets + AWS IAM Roles |
| CI/CD | GitHub Actions |
| Frontend Build | esbuild + Tailwind CSS |
Architecture Flow
User clicks "Trigger Fault"
        ↓
Flask Fault Endpoint (/test-fault/run | /test-fault/external-api | /test-fault/db-timeout)
        ↓
Exception caught → structured log marker emitted to stdout
        ↓
Incident recorded in PostgreSQL
        ↓
ECS Fargate → CloudWatch Logs (/ecs/cream-task)
        ↓
RAG Retrieval → Backboard.io (vector search over 15 seeded examples)
        ↓
Similar past incidents returned as context
        ↓
AWS Lambda → Gemini API (incident + RAG context → code fix generated)
        ↓
Fix committed → pushed to main → CI/CD deploys to ECS Fargate
        ↓
Results stored on Incident record
        ↓
Redis pub/sub → SSE stream → Developer Dashboard (live update)
        ↓
Resolved incident re-indexed into Backboard knowledge base
        ↓
Next similar incident benefits from accumulated memory
Challenges We Ran Into
Circuit breaker state across requests: Flask workers are stateless — a module-level variable resets when a Gunicorn worker restarts. We stored the circuit breaker's failure count and open timestamp in the Flask application context so the state persists across requests on the same worker.
Deterministic fault signals: Designing log markers that are structurally unambiguous required care. Every fault marker is prefixed FAULT_ followed by an uppercase identifier — distinct enough to query in CloudWatch Logs Insights without false-positives on normal error output.
RAG + Gemini latency in the synchronous path: Backboard retrieval followed by the Gemini API call adds 2–4 seconds of latency. We moved the analysis into a post-commit step so the incident creation response returns immediately and the Gemini output is written to the record asynchronously, keeping the SSE event stream responsive.
ECS networking with multiple containers: In awsvpc network mode, containers within the same task share a network namespace and reach each other on localhost. This simplified Flask → mock API calls but required careful port coordination in the task definition to avoid conflicts between the app, PostgreSQL, and mock API containers.
Knowledge base design: Designing the 15 pre-seeded incident documents to give Gemini enough signal to produce meaningful root cause analysis — without being so specific that they fail to generalize — required several iterations. The final format includes structured sections for symptoms, breadcrumbs, root cause, remediation, and verification.
Accomplishments We're Proud Of
- A fully automated pipeline: fault trigger → RAG retrieval → Lambda → Gemini code fix → auto-deploy to production — no human steps anywhere in the chain
- Three distinct fault classes covering the most common runtime failure categories, each with a real resilience pattern implemented in application code
- Gemini API generating actual code fixes, not just remediation suggestions — the system self-heals by pushing a real patch
- A RAG knowledge base that improves over time — every resolved incident is re-indexed and feeds future analysis
- Real SSE streaming over Redis pub/sub working across multiple Gunicorn workers
- A multi-stage Docker build producing a lean production image, deployed through a CI/CD pipeline with secret injection and IAM least-privilege on ECS Fargate
What We Learned
The hard part of reliability engineering is not detecting that something broke — your logs will tell you that. The hard part is building the scaffolding that makes the detection signal useful downstream: structured log markers that are machine-queryable, a knowledge base that doesn't require a human to curate it after every incident, and a pipeline that is decoupled enough that each layer can fail or be replaced independently.
RAG closes the curation loop. Instead of maintaining a runbook that goes stale, the system indexes its own incident history and retrieves relevant context dynamically. Each incident handled makes the next one faster to diagnose.
What's Next
- CloudWatch Alarm trigger: Wire CloudWatch Alarms to automatically fire the Lambda → Gemini pipeline the moment a fault marker appears in the log stream — removing the manual fault trigger entirely.
- Richer observability: Prometheus exporter + Grafana dashboards for latency histograms, error rate SLOs, and circuit breaker state over time.
- More fault classes: Memory pressure, queue backlog saturation, session token expiry, and retry storm patterns added to the knowledge base.
- Alerting integrations: Push incident summaries with RAG context to Slack and PagerDuty automatically so on-call engineers get signal-rich alerts instead of raw log links.
Credits & Acknowledgments
This project was built on top of docker-flask-example by Nick Janetakis — a production-ready Flask + Docker boilerplate that provided the foundational project structure, Docker Compose setup, multi-stage Dockerfile, asset pipeline, and deployment scaffolding.
All fault injection logic, resilience patterns (circuit breaker, exponential backoff), incident recording, RAG integration with Backboard.io, Gemini API code-fix pipeline, AWS Lambda trigger, SSE streaming, developer dashboard, Alembic migrations, and CI/CD workflows were designed and implemented by our team for this hackathon.
We are grateful to Nick for open-sourcing a well-structured starting point that let us focus on building reliability engineering features rather than boilerplate.
Built With
- alembic
- amazon-cloudwatch
- amazon-lambda
- aws-iam
- backboard.io
- css
- docker
- ecs
- fargate
- flask
- github-actions
- gpt
- gunicorn
- html
- javascript
- python
- redis
- sql

Log in or sign up for Devpost to join the conversation.