-
-
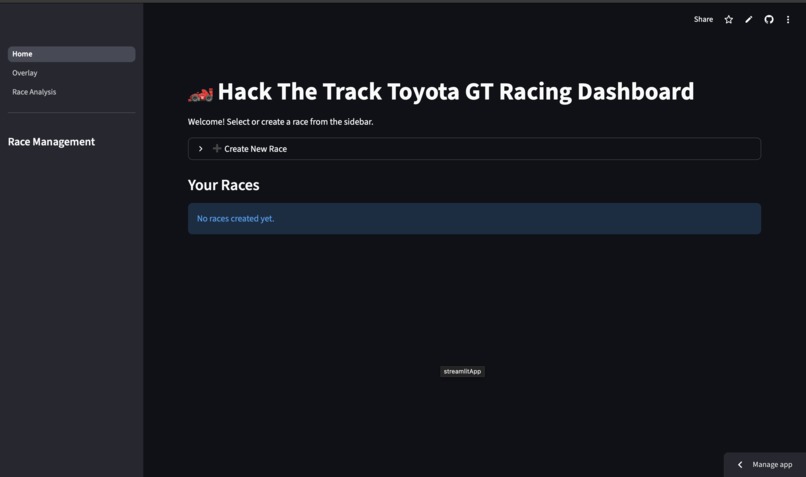
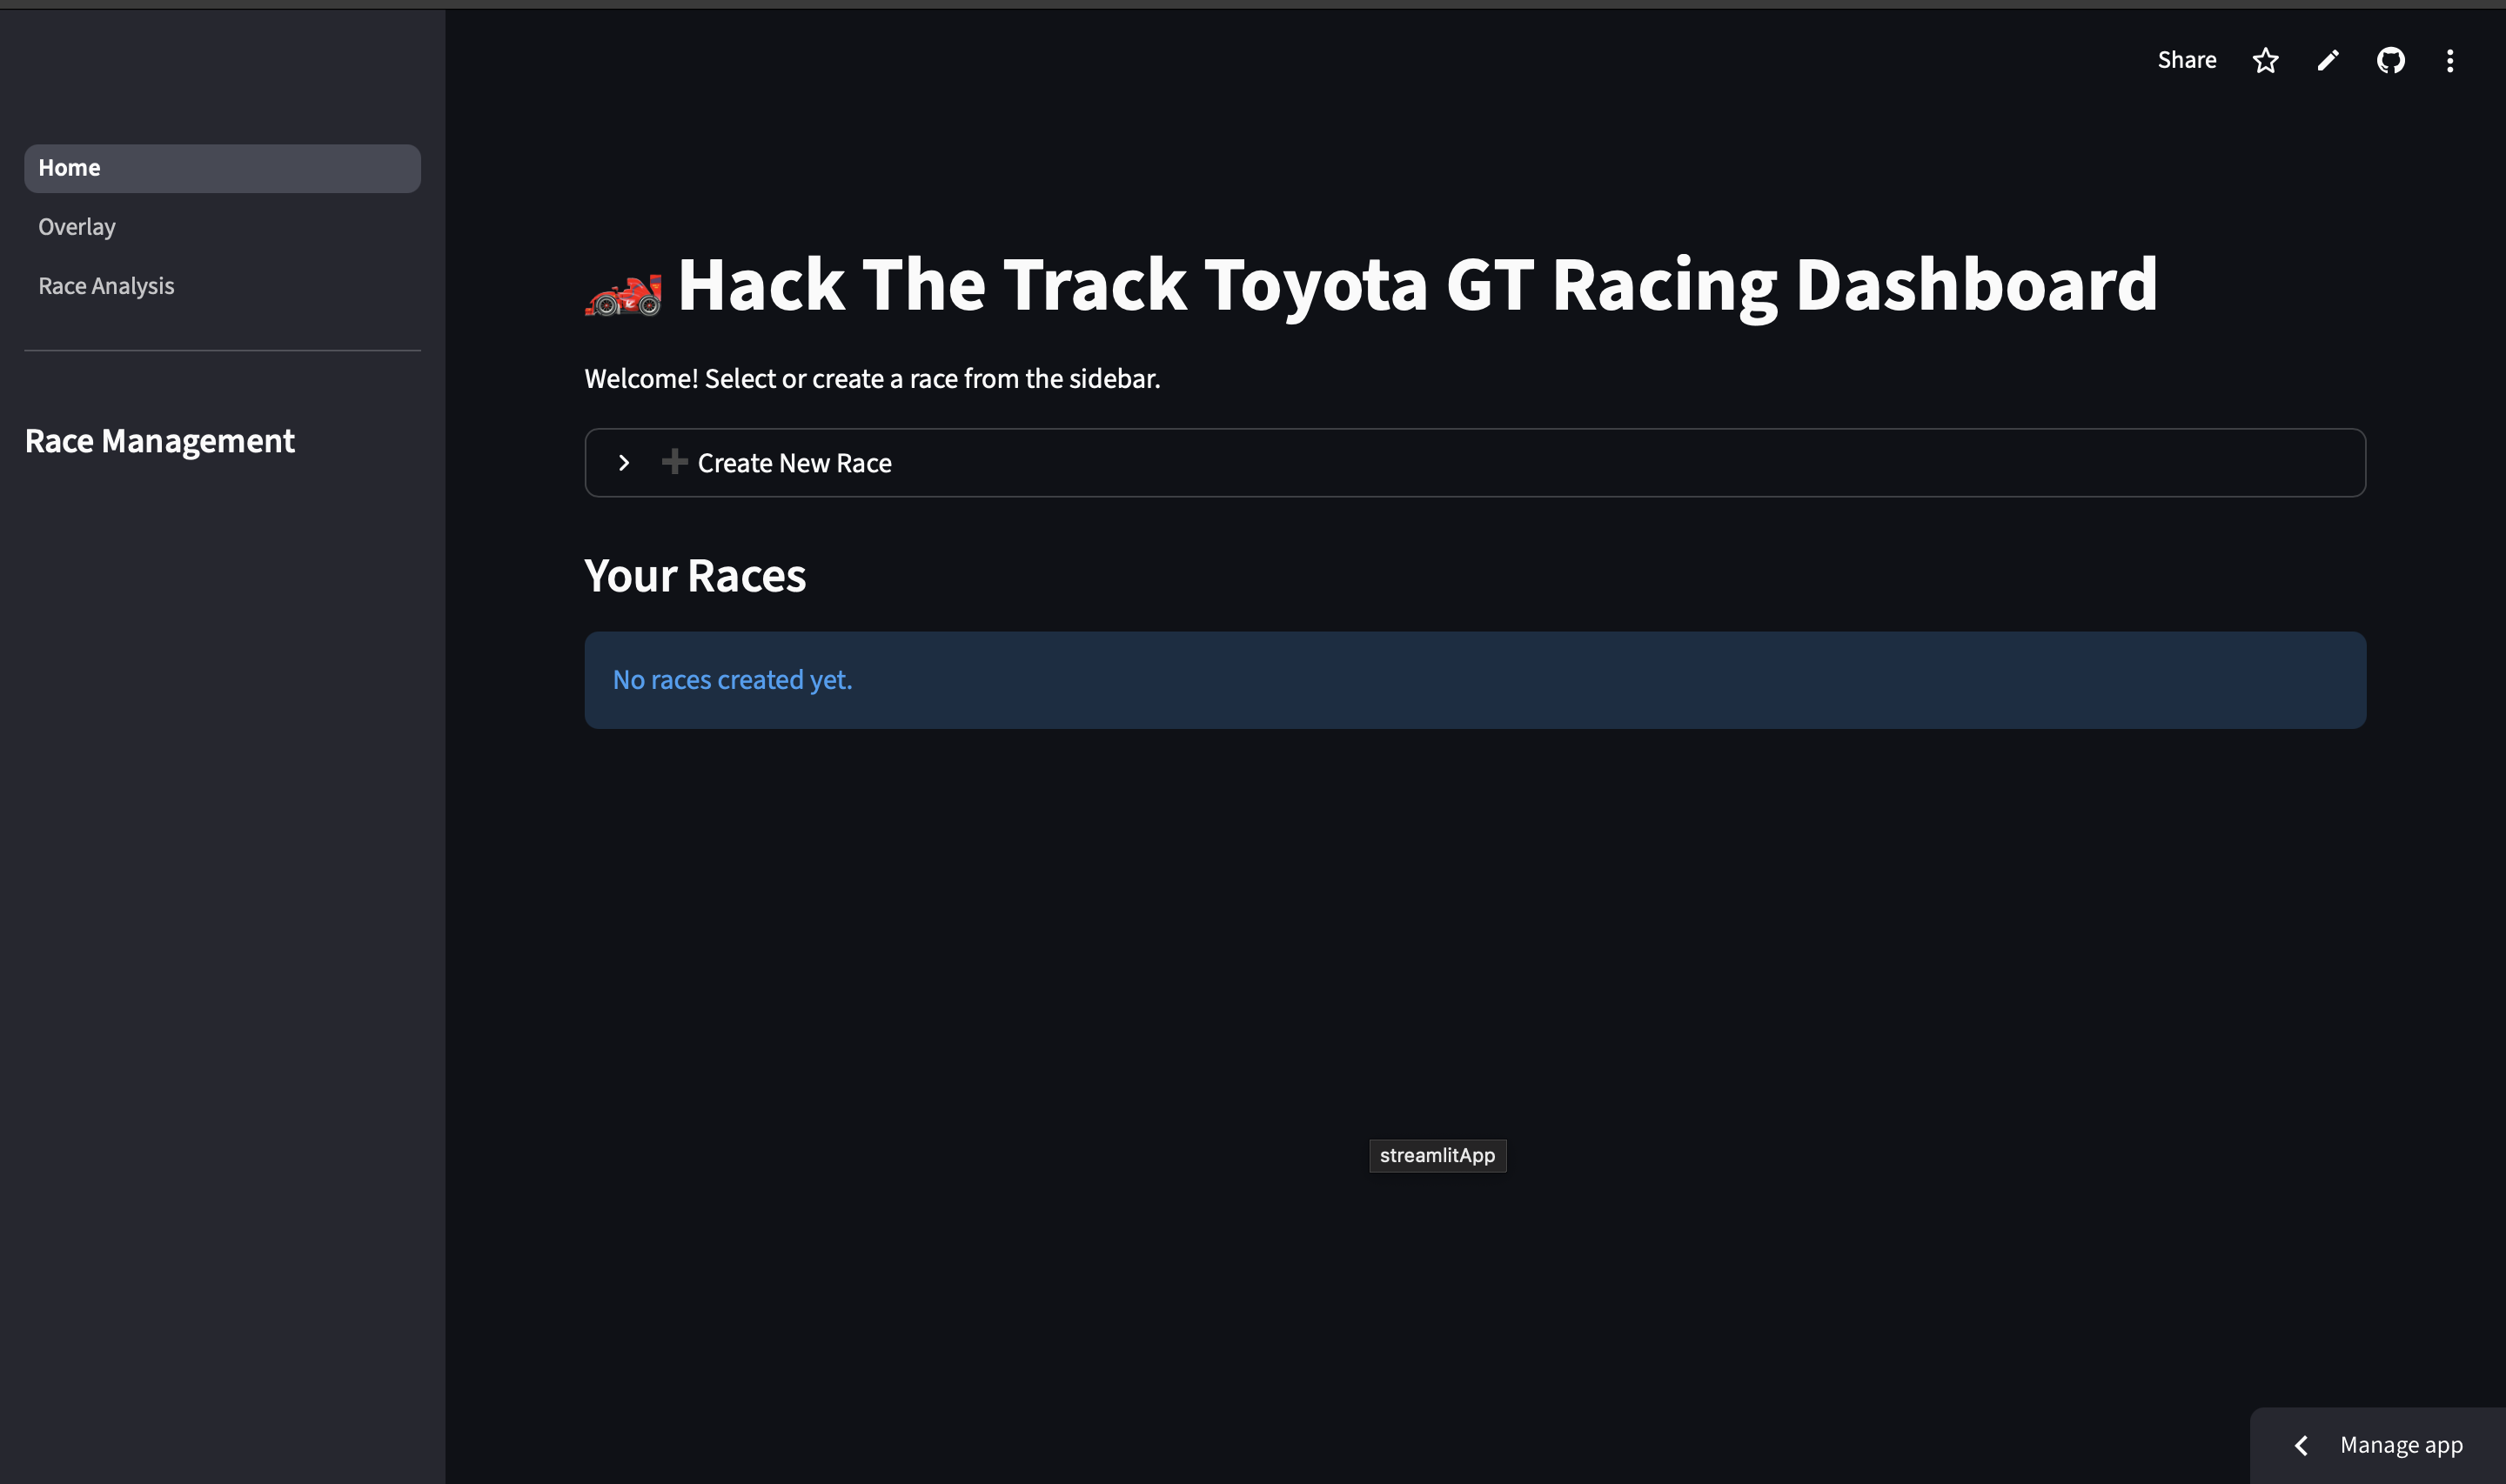
Home Page
-
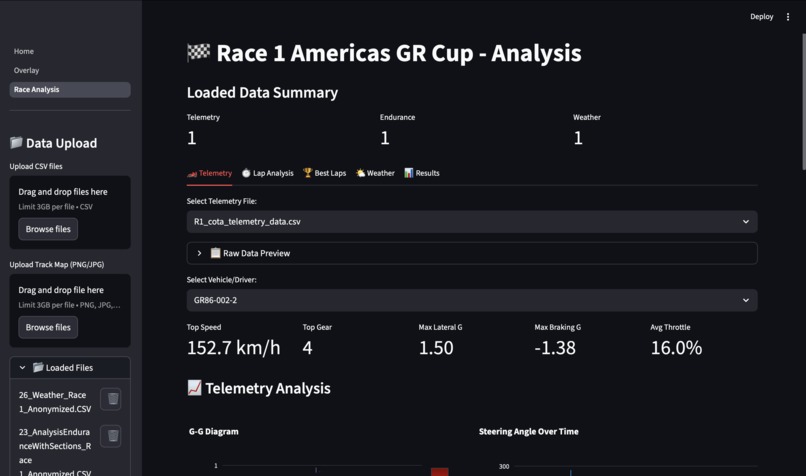
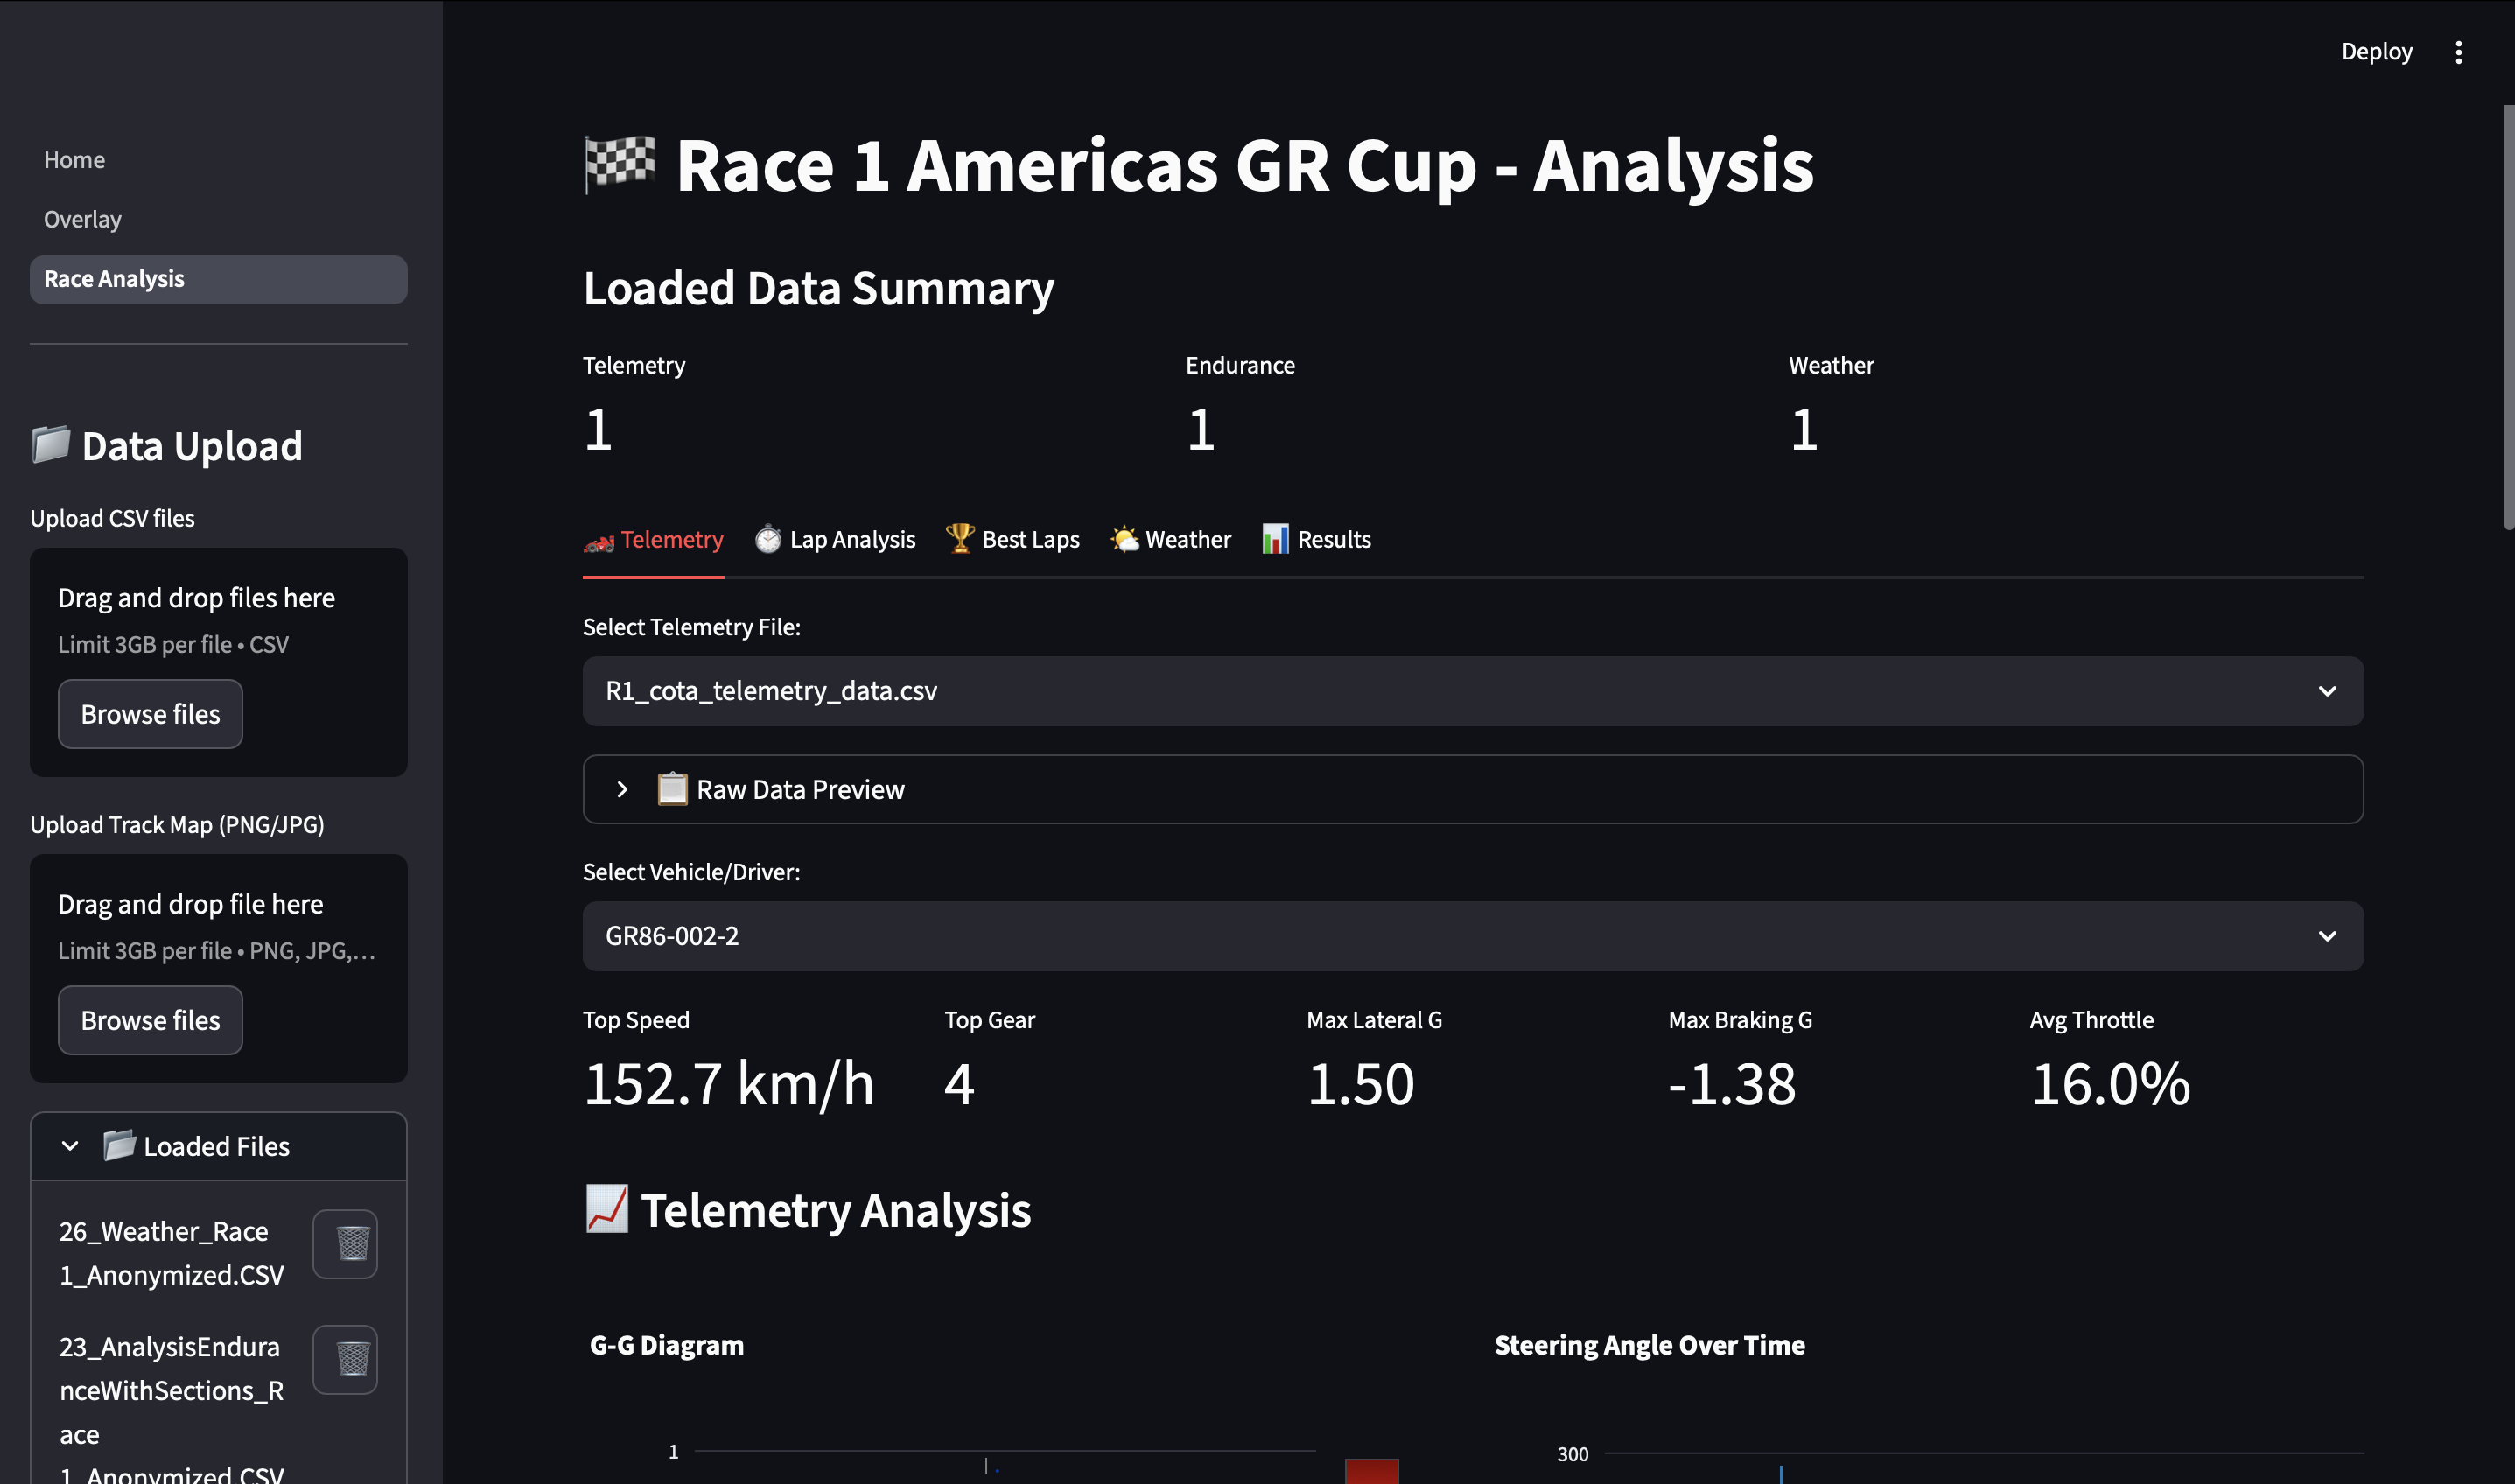
Race Analysis Dashboard Sample
Inspiration
The inspiration for this project came from my fascination with understanding how to extract the utmost performance from a car under any set of conditions. As a postgraduate student in motorsports engineering with a strong inclination toward race engineering, performance, and strategy, this hackathon presented the perfect opportunity to explore tools I hope to use throughout my future career.
My initial idea was to develop a predictive model capable of estimating key performance metrics and analysing how certain variables (e.g., weather conditions) could influence them. However, three factors led me to pivot:
Engineering Need: My Formula Student team is currently exploring the development of a race dashboard, and this project gave me a way to test that idea using Python and Streamlit.
Time Constraints: Creating a robust predictive model requires a substantial amount of structured time, which simply wasn’t feasible given the short hackathon timeline.
Dataset Complexity: The provided telemetry datasets were too large to handle comfortably in Excel or similar tools, making a dedicated interface the most practical first step.
In the end, building an interactive dashboard became the most natural foundation to understand, visualise, and explore the data properly before creating a meaningful predictive model.
What it does
The interactive dashboard is separated into three pages:
Home: Create, store, and manage races in a clean grid-style interface.
Race Analysis: View uploaded datasets in a structured and intuitive layout.
Overlay: Compare datasets or laps visually to spot trends and performance differences.
It is designed to be modular, easy to extend, and flexible enough to integrate with future analytical or predictive tools.
How I built it
The dashboard was built using Python and Streamlit, with additional custom utilities for state management and dynamic UI behaviour. It was first developped on VScode and tested locally using my laptop's terminal. Upon completion it was transferred to GitHub for publication.
The development process involved:
Creating a custom race-management system using
st.session_state.Designing a scalable grid-based interface to store races dynamically.
Building a multi-page navigation with Streamlit and integrating file handling of racing datasets.
Styling the UI interface briefly using HTML/CSS to improve clarity and usability (learnt).
Making sure the structure of the presented solution gave space for future incorporation of prediction modelling tools and visualisation or lap-time simulations based on existing data variables such as weather or track conditions.
Challenges I ran into
The biggest challenge was time management. I found out about this hackathon roughly one to two weeks before the deadline while balancing a full MSc workload, my responsibilities in the university racing team, and a university-level sports competition. Thus the real challenge became not the coding itself, but creating enough focused work time to make meaningful progress.
Data handling presented another significant challenge. Each race contained a large amount of information that required careful inspection, structuring, and filtering to identify what was useful and complete. Designing a tool that could handle this challenge efficiently whilst beign as user friendly and lightweight as possible was also a challenge, and a central part of the process.
Accomplishments that I'm proud of
Building a functional, clean and scalable interactive dashboard in a very short timeframe.
Designing and interface that my Formula Student team can realistically build upon.
Creating a strong foundation for future predictive modelling work.
Learning how to integrate UX/UI principle into a technical engineering tool (and the importance of it).
Overcoming multiple challenges with Streamlit's state management, file handling and UI layout.
What I've learned
This project has pushed me to improve in several areas:
Practical race data handling with large motorsport datasets.
Efficient UI design for engineering tools.
Coding skill adaptation and rapid learning for completion of set goals or realisation of ideas.
State management in Streamlit, including dynamic rendering, reruns, and nested components.
How to properly structure a project for future scalability, instead of building a rigid fixed-purpose tool.
The importance of designing a clear workflow before diving into predictive modelling or data analysis.
What's next for Hack The Track Toyota GT Racing Dashboard
As mentioned before, the dashboard presented is simply the beggining.
The next steps include:
Developing a predictive performance model for parameters such as lap time, grip evolution, or tyre/stint degradation.
Adding a dedicated simulation page to test how changes in conditions (weather, fuel load, tyre compound) may affect performance.
Implementing real-time visualisation tools for faster dataset comparisons.
Expanding the UI with richer analysis modules and more efficient plotting.
Potentially evolving the project into my MSc thesis, focusing on creating a robust, data-driven race-engineering tool.


Log in or sign up for Devpost to join the conversation.