-
Scroll to see some data visualizations on gender and wage gaps!
-
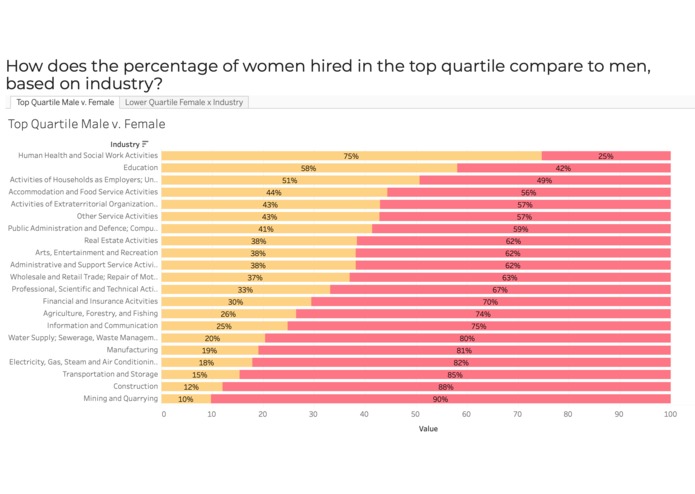
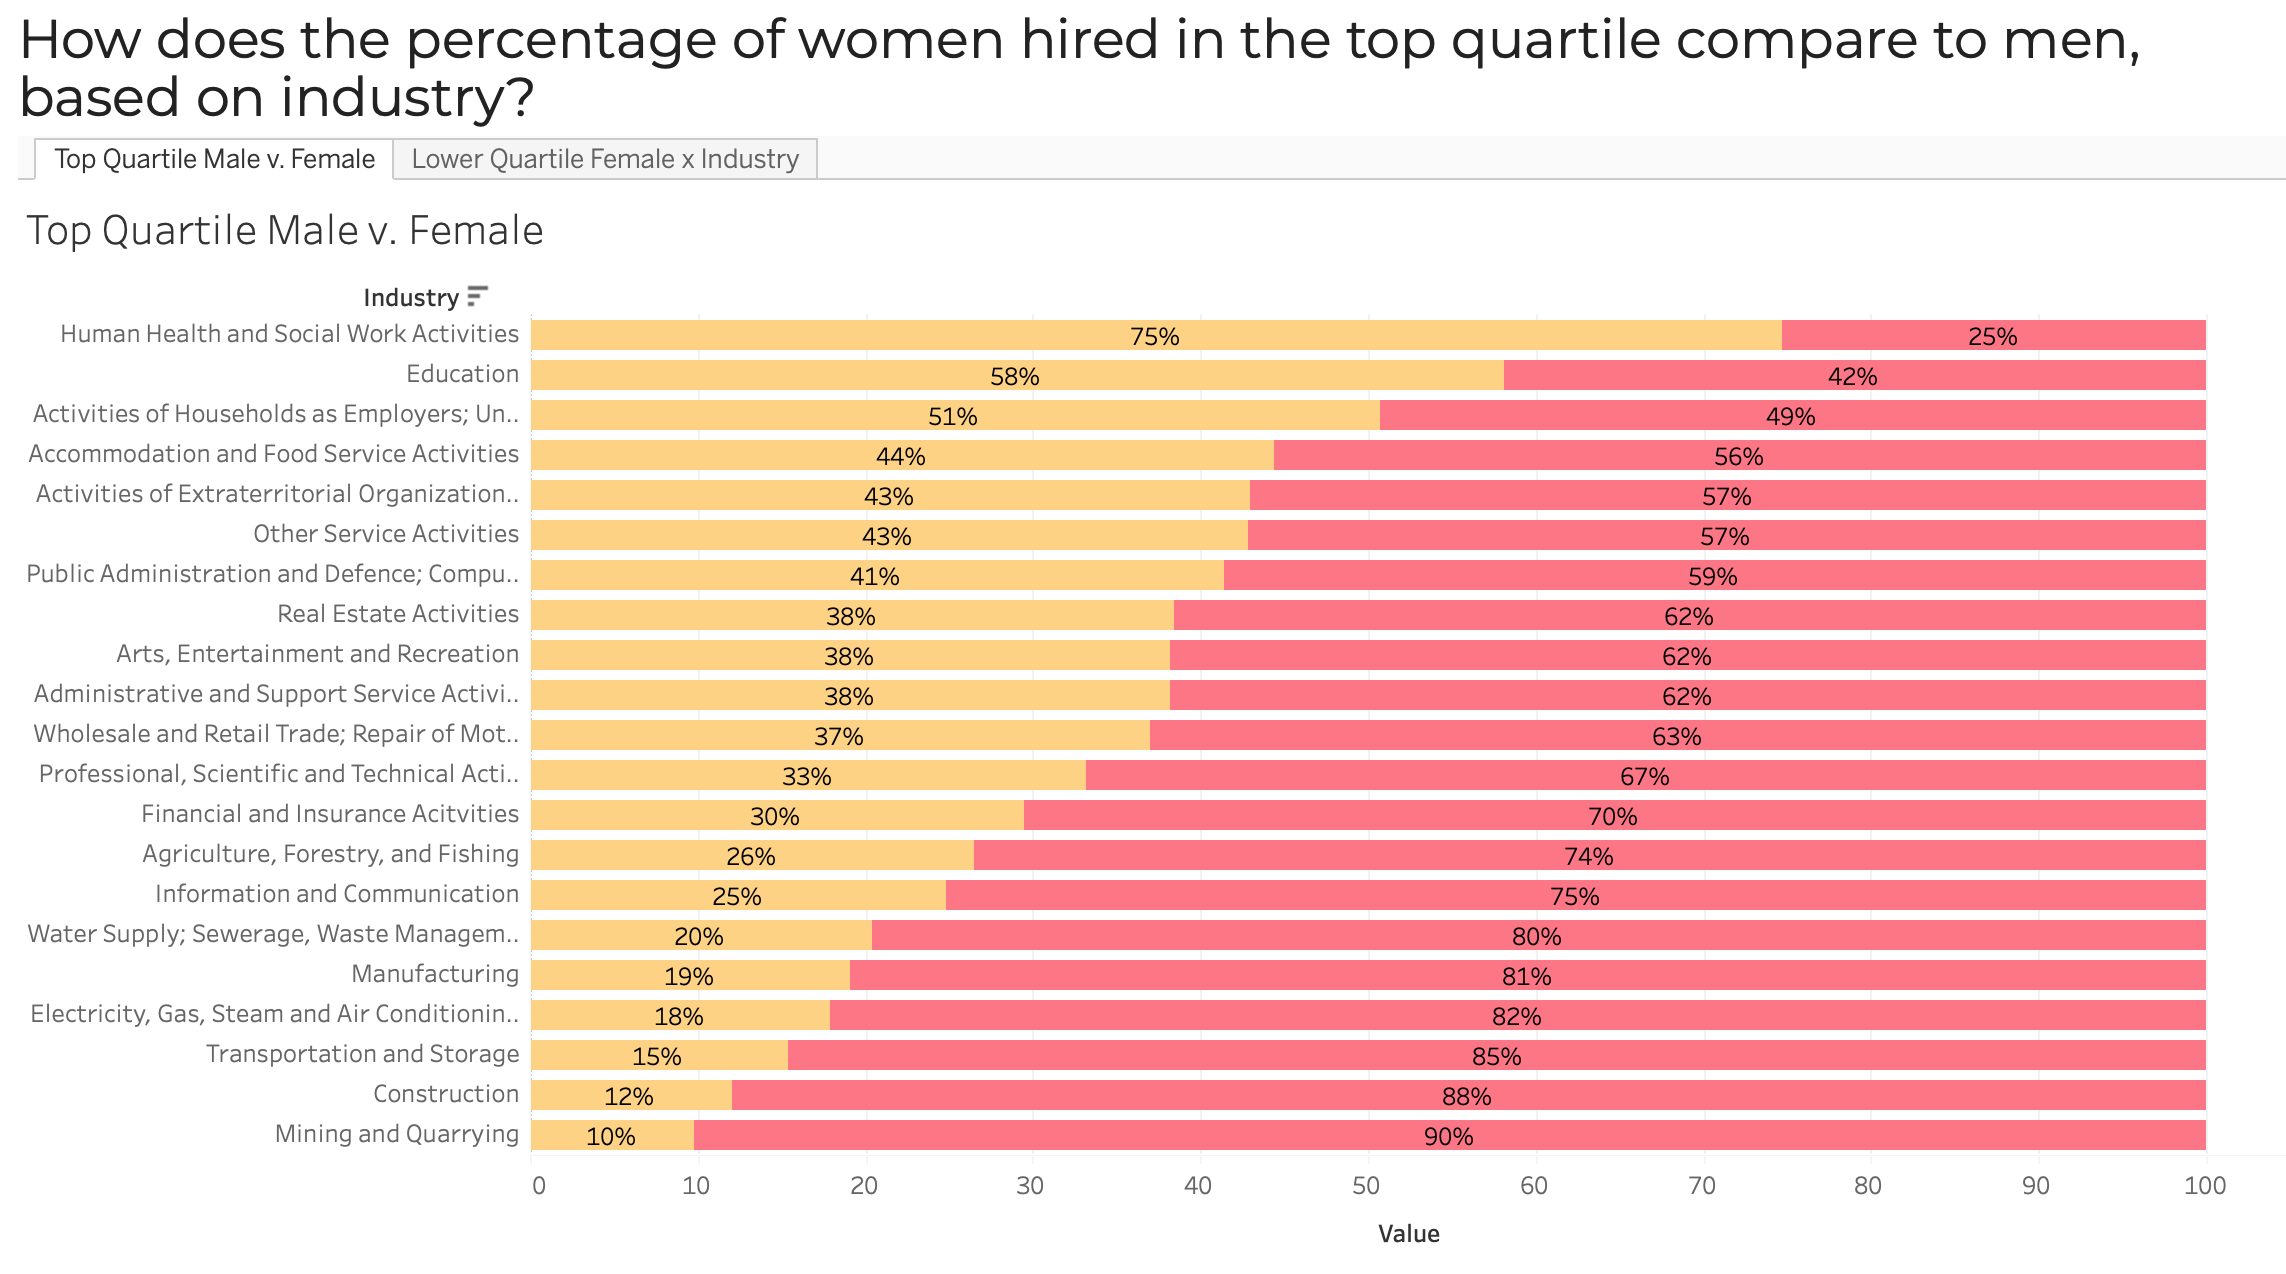
Percentage of women in the top quartile compared to men, by industry
-

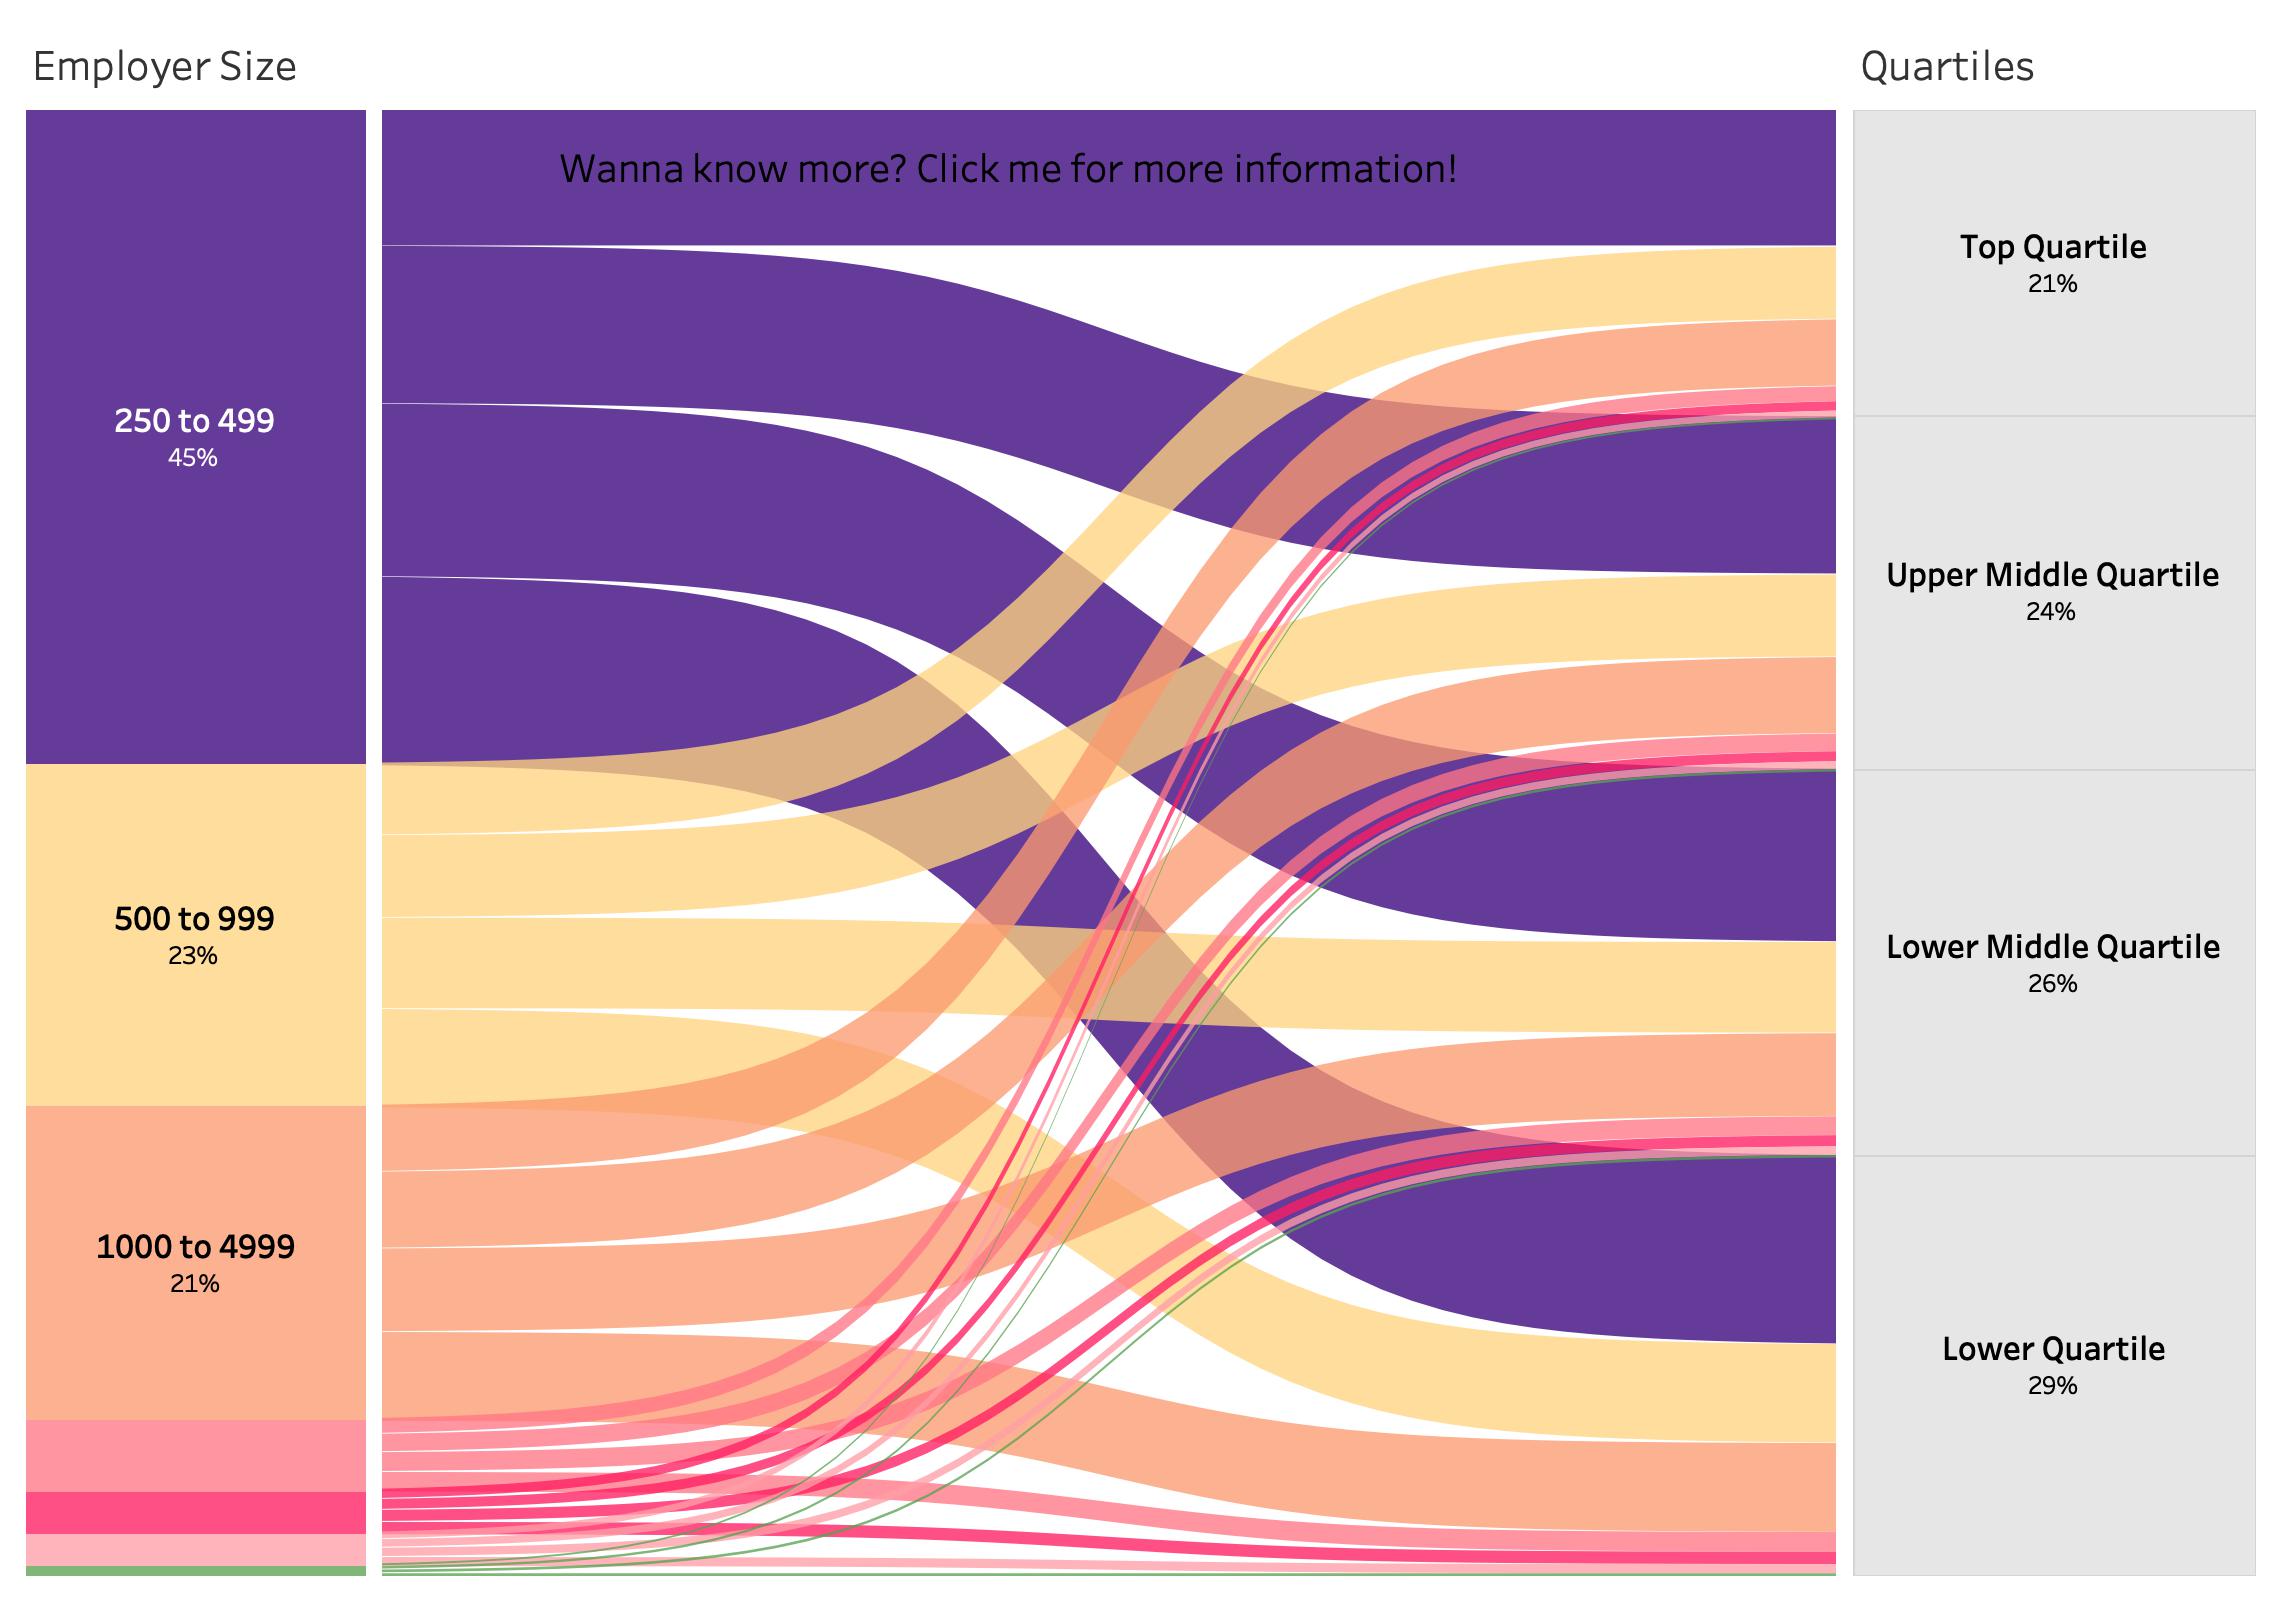
How does company size affect distribution between quartiles?
-
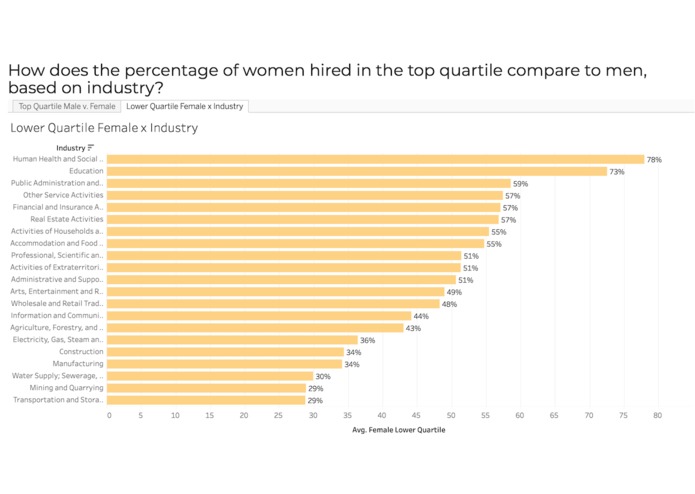
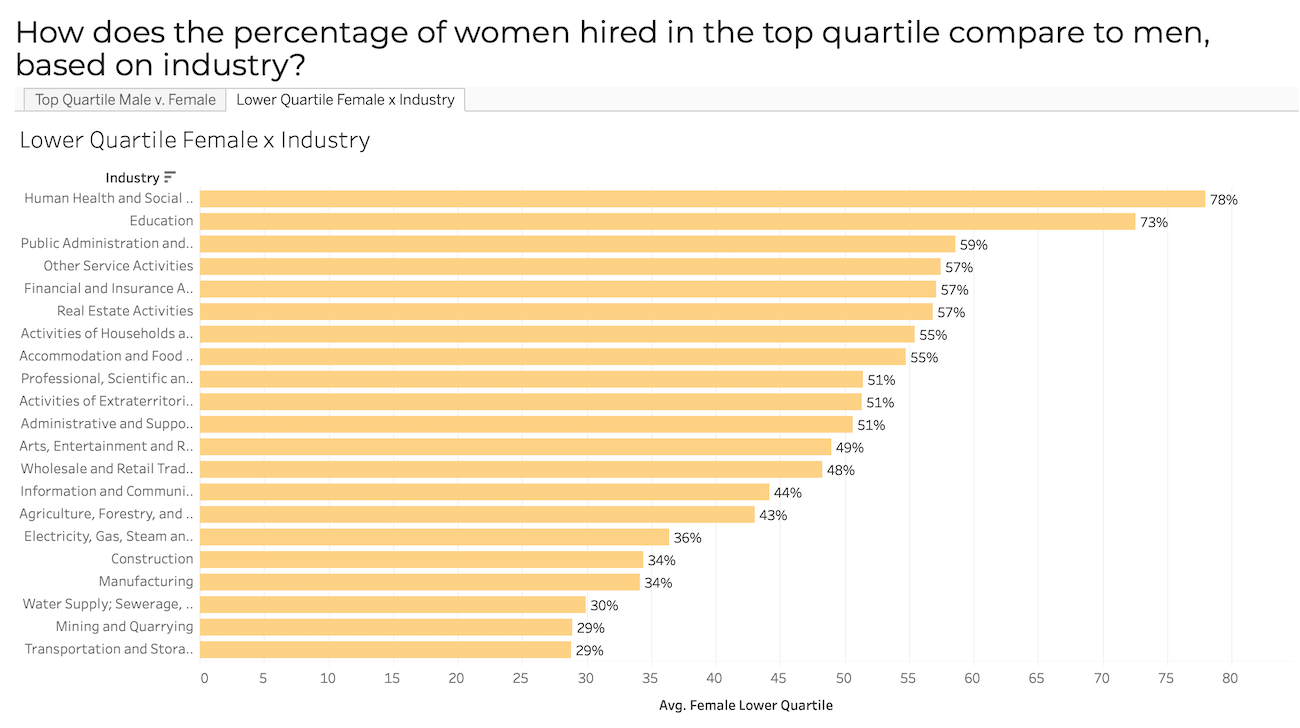
Percentage of women in the lowest quartile by industry
-
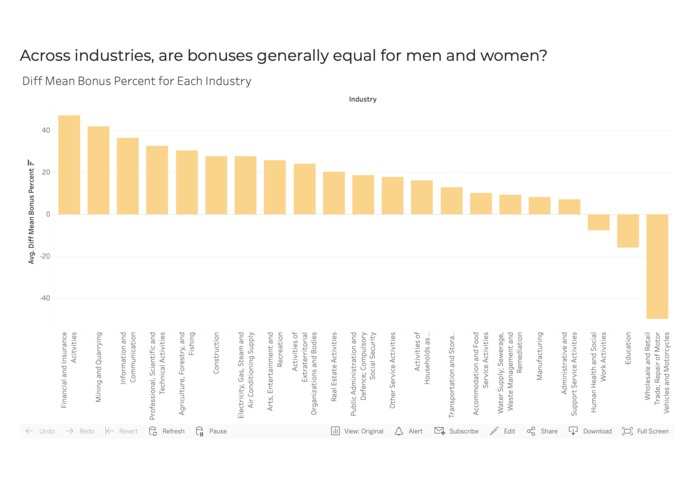
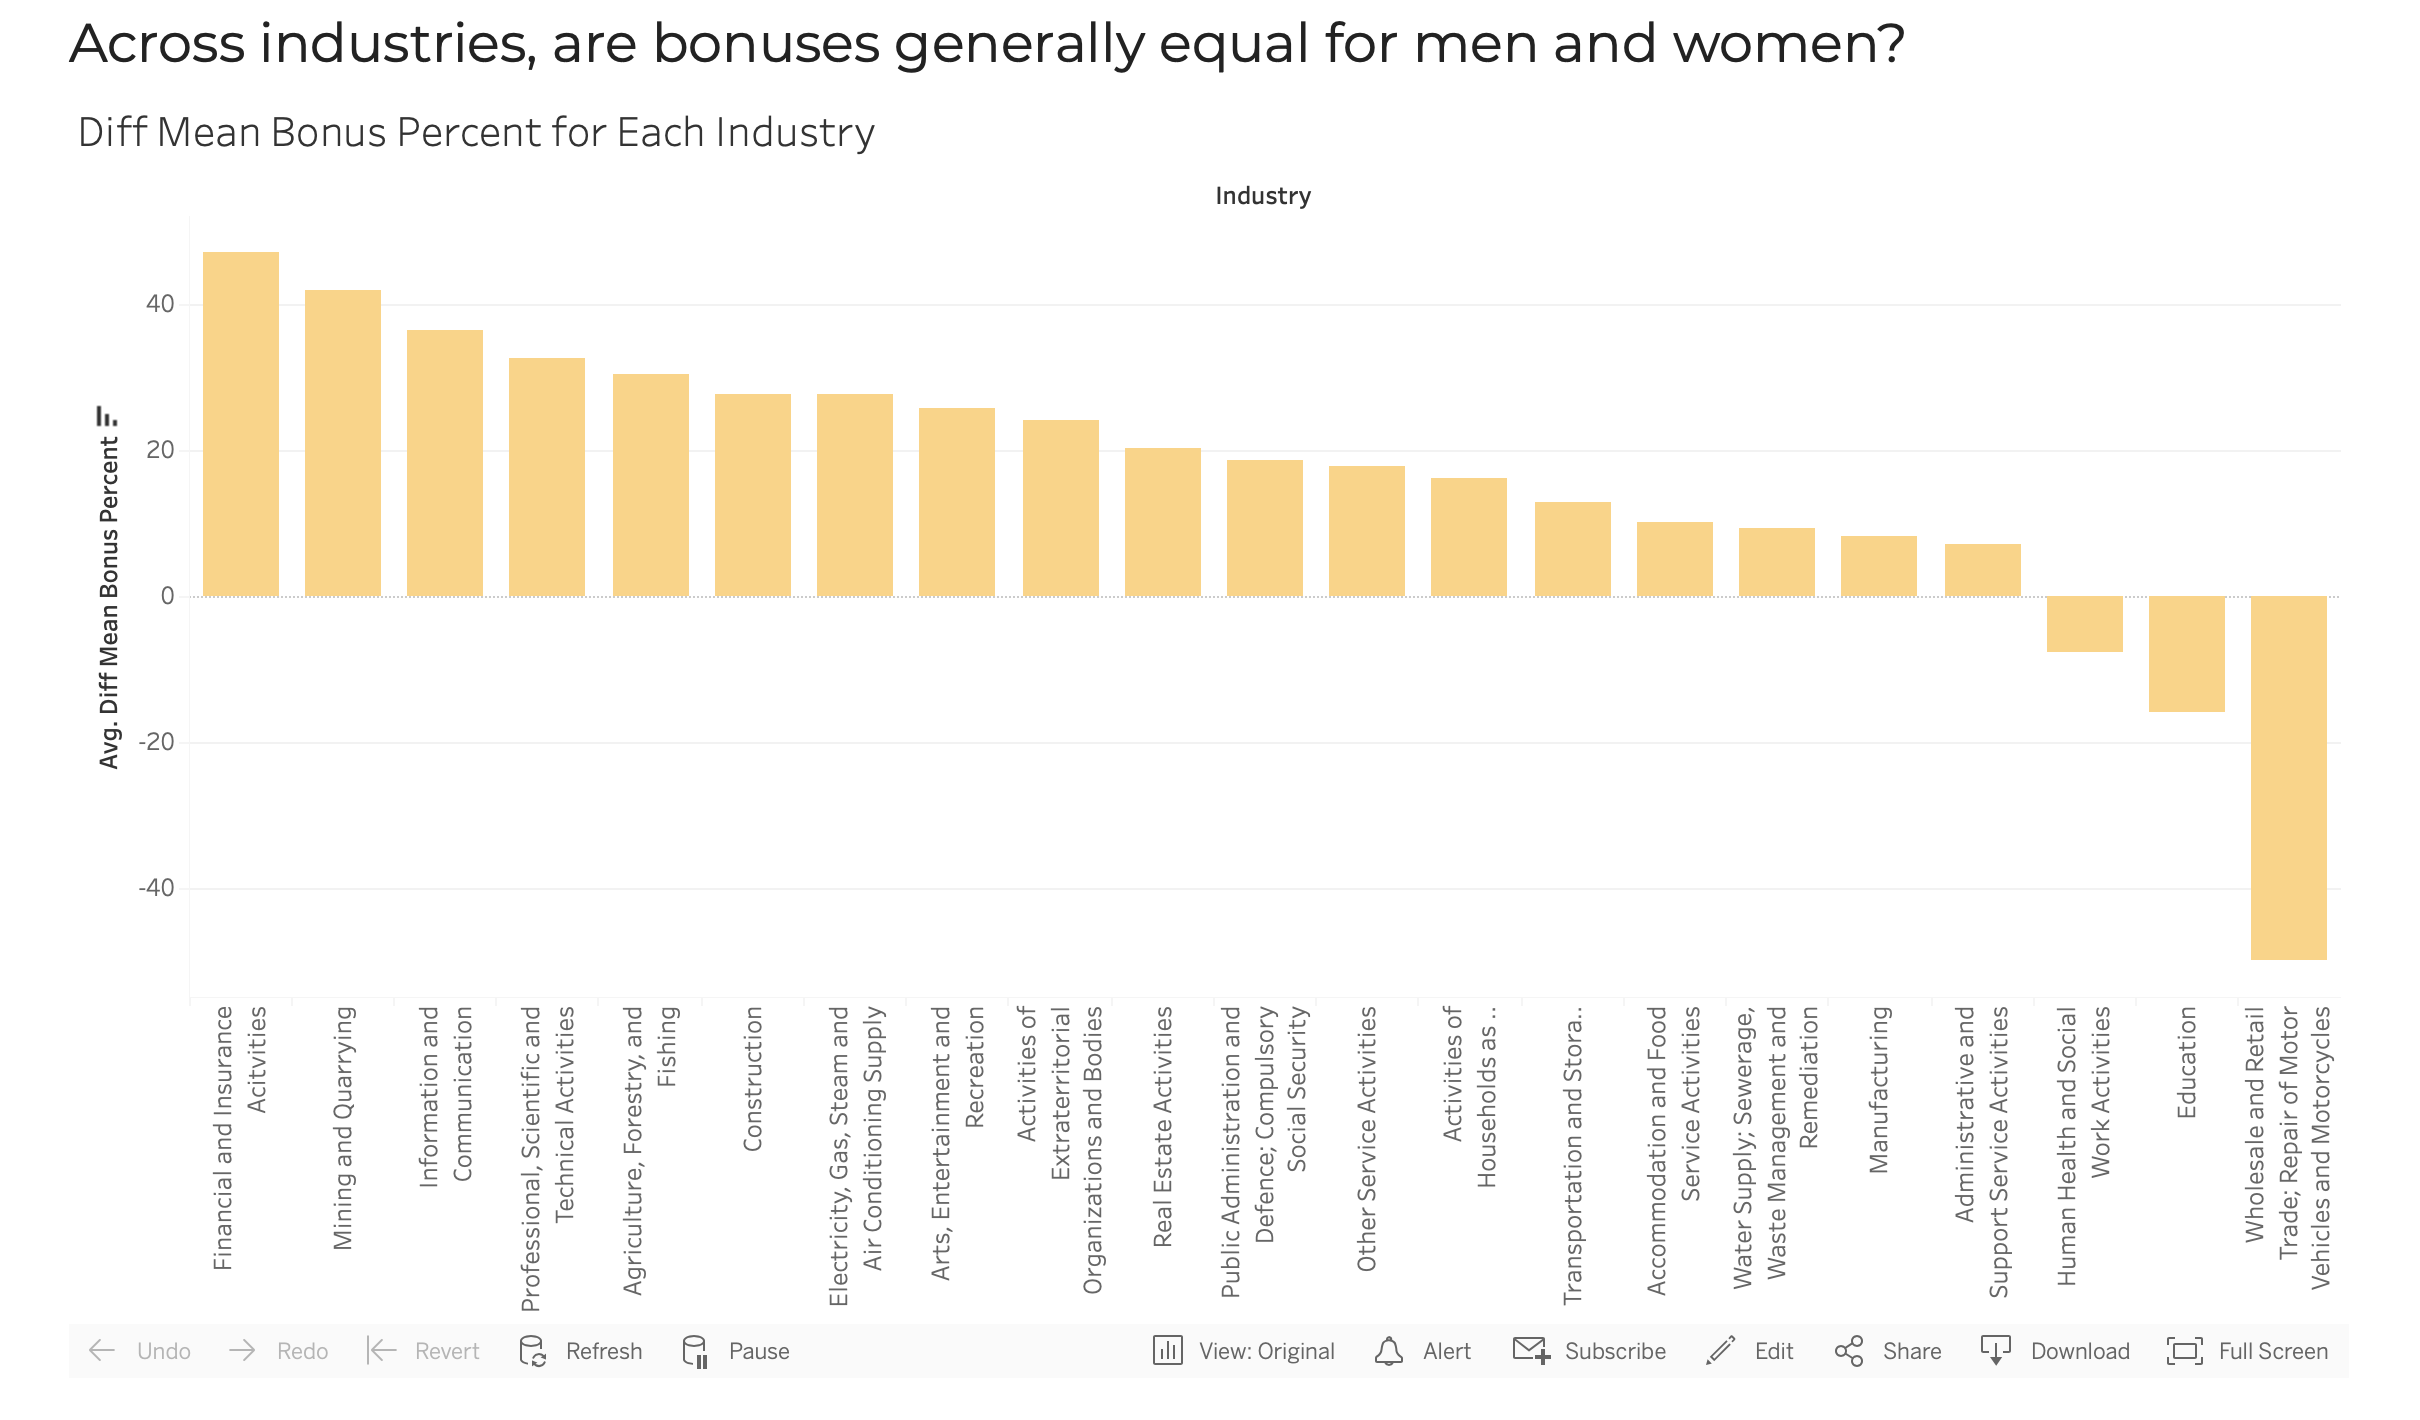
Across industries, how are bonuses distributed to men vs women?
-
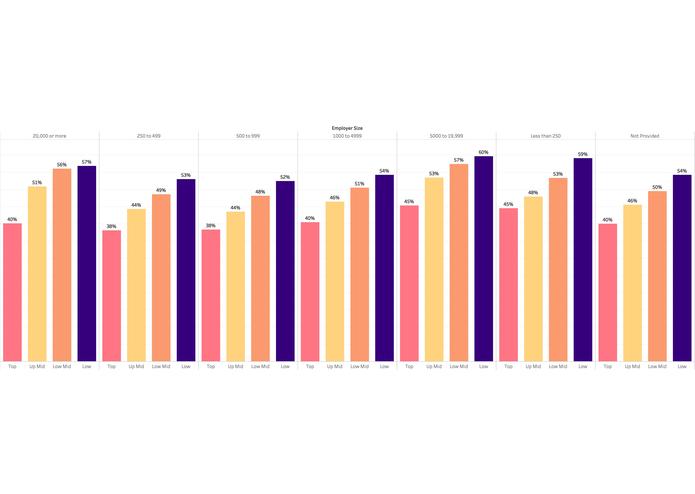
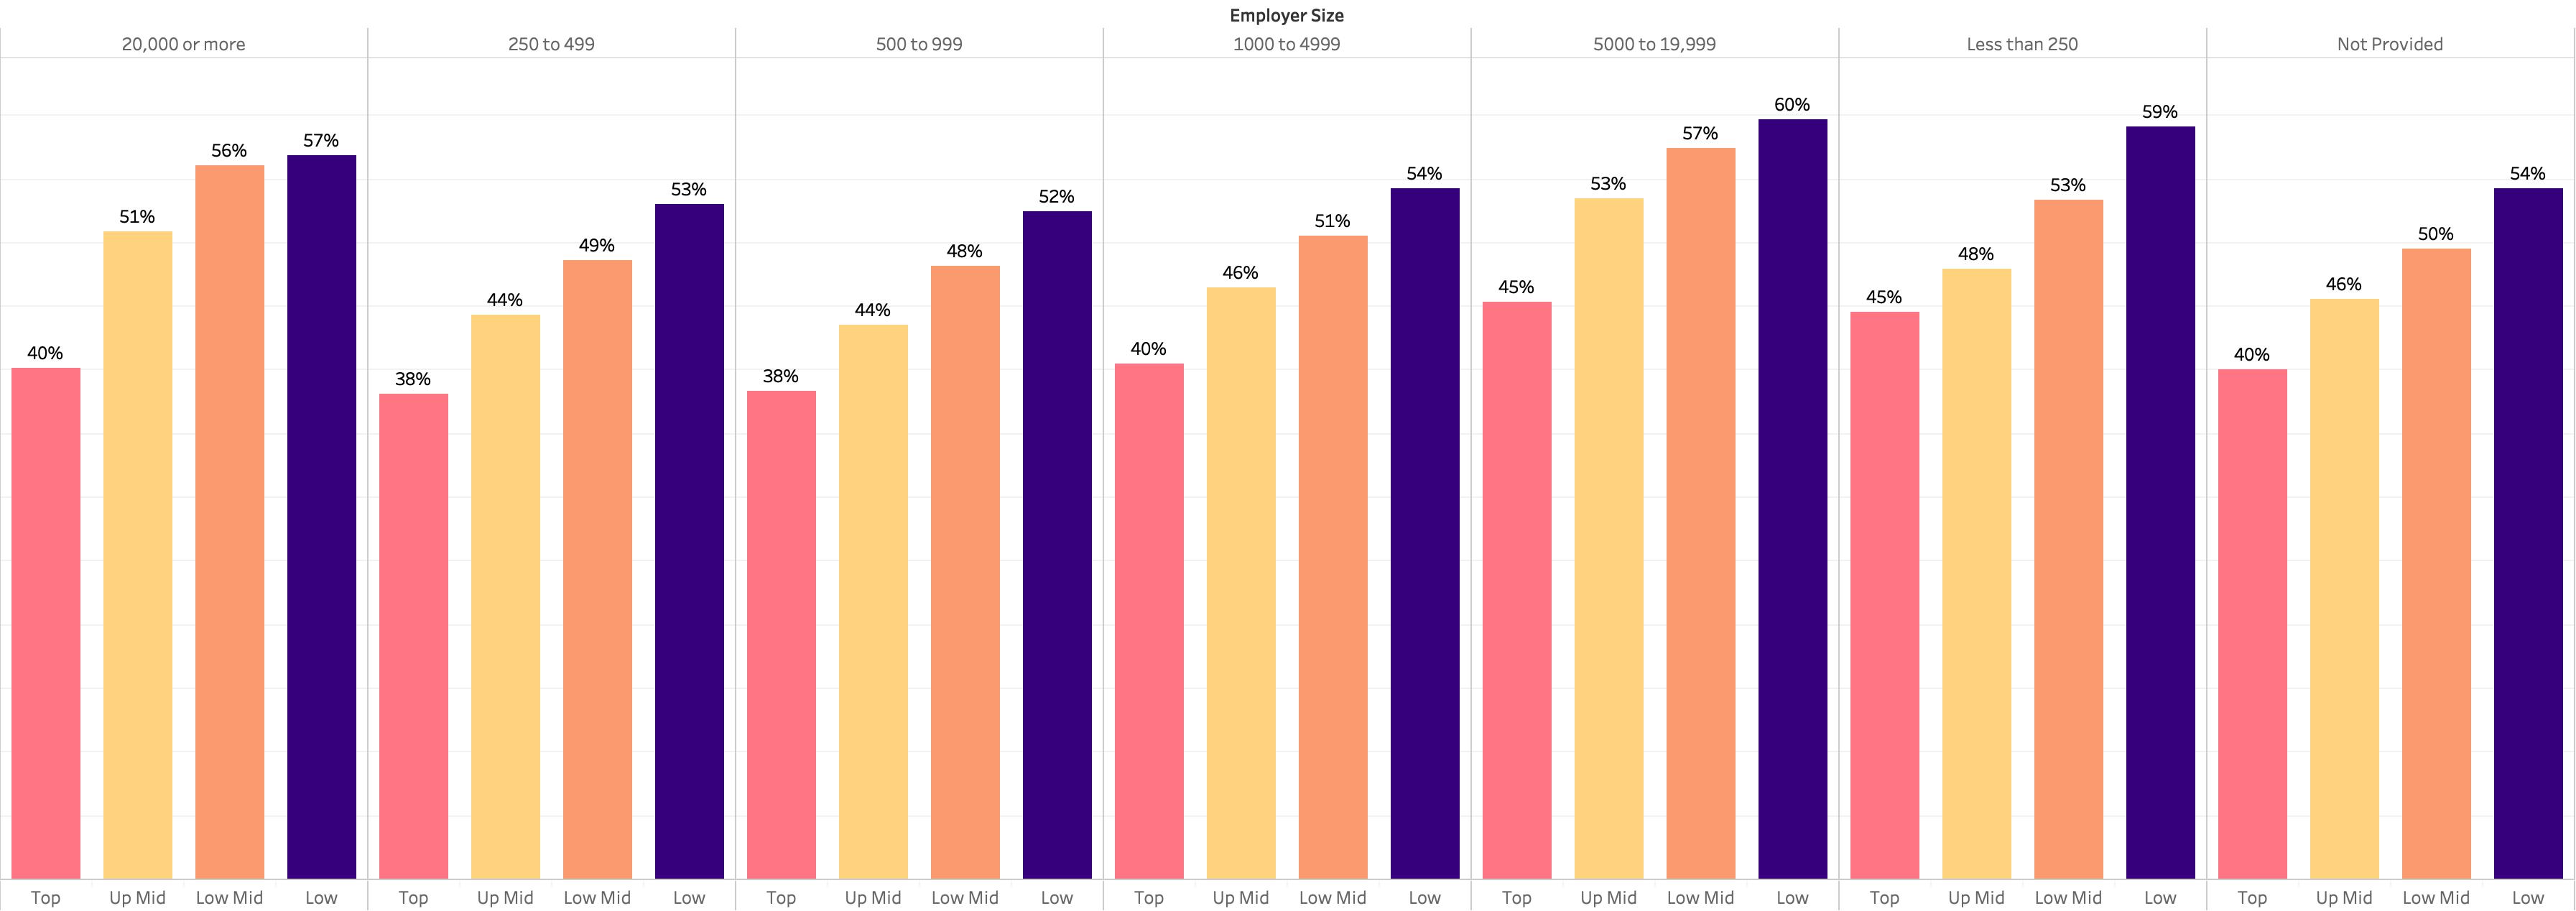
What are the specific percentages of women in different quartiles by company size?
Inspiration
Our inspiration for this project was simply to find a way to organize some data about the wage gap, and gain insight using visualizations in Tableau.
What it does
Our Tableau visualization is embedded on the website we built and is able to be filtered based on different data categories that we analyzed. Based on the initial raw data on the wage gap in the United Kingdom, we found that the wage gap between men and women tended to be minimal for entry level positions but increase as the level of seniority increased. This motivated us to focus on the wage gap between employees in higher level positions within their respective companies.
How we built it
We used MySql to filter the data and conduct initial queries on the raw data. We used Tableau to build the charts that display our findings in a visually appealing manner so that we could see trends and patterns. The website was built using HTML, CSS, JavaScript, and BootStrap.
Challenges we ran into
A large challenge that we encountered was that the different data sets that we used came from different sources and therefore did not contain all the same categories of data. We also had initial issues parsing the raw data that we were able to resolve after a few attempts. A lot of time was spent on configuring Tableau to display the data in the ways that we wanted as well.
Accomplishments that we're proud of
We are very proud to have been able to find meaningful information on a topic that affects all women. It is exciting to think that we might have taken just one step closer to closing the gender wage gap! We worked hard on all the components of our project so that we can walk away with a finished website that neatly houses all the data visualizations we were able to come up with.
What we learned
We learned how to use Tableau, how to commit and push site updates from the terminal, and how to compile raw data into more concise and consumable formats!
What's next for Hack the Gap
We would love to find even more raw data to analyze. We designed our Tableau project to be scalable, so that we could insert more data and make similar visualizations. Our next project could definitely be to use machine learning to be able to predict future trends regarding the wage gap. We would love to be able to bring data from the United States in and analyze that as well.


Log in or sign up for Devpost to join the conversation.