-
-

Distance total nitrogen
-

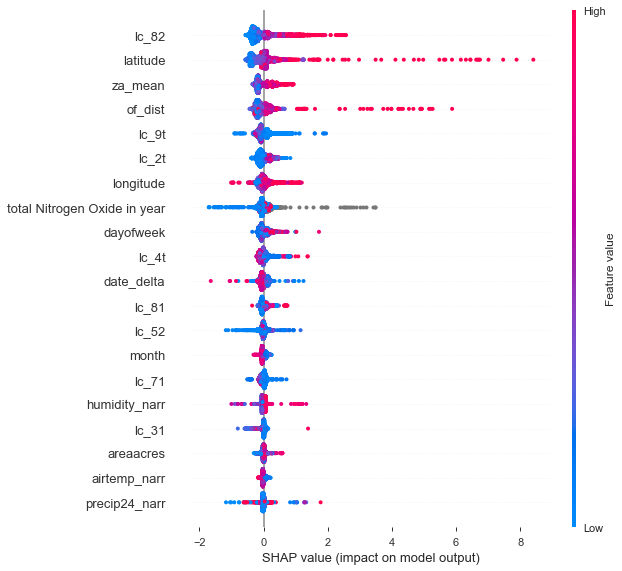
catboost model shap values
-

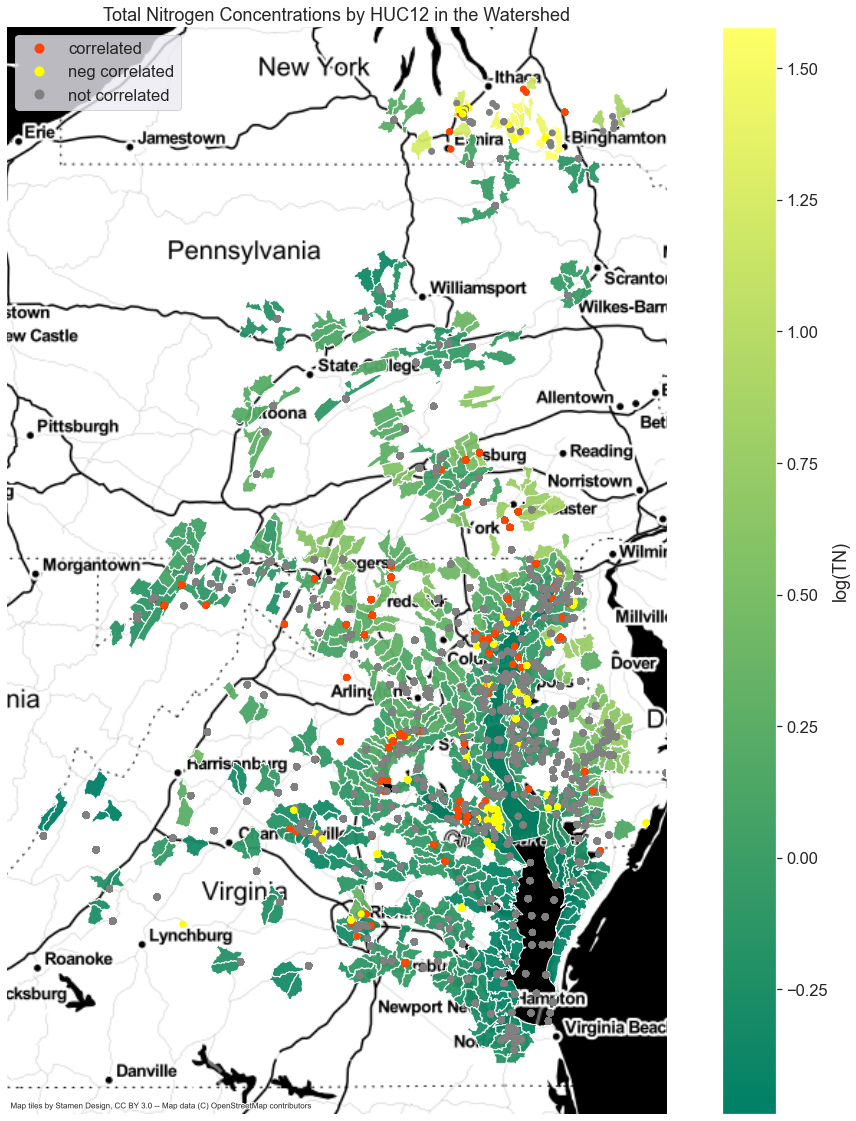
correlation of total nitrogen
-

segmented model
-

Distribution of ph, salinity and temperature
-

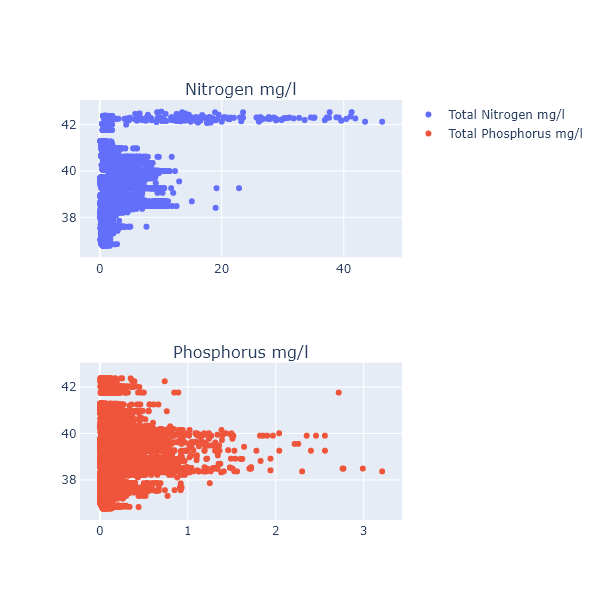
nitrogen and phosphorus scatter plots
-

Indicator of nitrogen
-

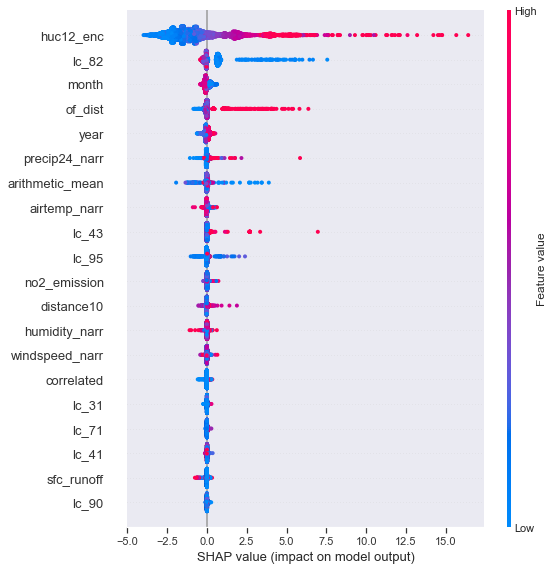
Shap of huc12_ separation
-

feature importance huc12_ separation


Inspiration
The Chesapeake Bay’s pollution levels and water quality have flattened out in recent years, however that quality is near 47% in 2012. Excess nutrients such as Nitrogen & Phosphorous are leading causes of the current state of the bay. The goal was to predict total nitrogen in the bay with a focus on finding patterns found from different features expressed by Total Nitrogen when examining the predictive model.
What it does
Predicts TN in the Chesapeake Bay watershed using land cover, weather, nitrogen oxide emission, and air nitrogen oxide monitoring data.
Data Sources:
Land Cover
- Multi-Resolution Land Characteristics (MRLC) Check it out
Weather
- North American Regional Reanalysis (NARR) Check it out
NO2 Pollution
- Point Source NO2 | EPA Air Quality System (AQS) Check it out
- Air NO2 Monitoring Data | EPA National Enforcement and Compliance History Online Data Downloads (ECHO) Check it out
Challenges we ran into
- Finding relevant and complete data to use.
- The lack of domain knowledge.
- The major challenge was collecting land cover data beyond and before the year 2016. We had to rely heavily on the 2016 land feature data set making generalizations that land features stayed the same from 2016 to the end of 2019.
- Determining the important features to predict TN throughout the whole watershed. Some HUC12 areas had different correlated features than other areas. To achieve scalability an overall model approach was taken but to solve the differences in areas an ensemble model was also created.
- Data sparsity with data sources - NO2 emissions data was provided in a yearly format vs a weekly/monthly format. Air NO2 monitoring stations were sparse in terms of location throughout the watershed, and consistent values being recorded for the duration of the dataset
- TN values were highly skewed. It was difficult determining what values may be determined as outliers from the dataset without specific domain knowledge.
Accomplishments that we’re proud of
- The team’s openness and tenacity to complete our first hackathon.
- Data wrangling from multiple datasets given the data sparsity.
- The insights gained from the data revealing the complex relationships of pollutant flow into the bay.
What we learned
We learned how different models reveal different relationships of how pollutants make it into the Chesapeake Bay How to utilize and incorporate shap for explaining ML models
Making it better
- The improvements of the model would be to collect each year how land cover changed from 2016 to 2020.
- Collecting more frequent measures of nitrogen oxide emissions instead of making a generalization of a yearly value.
- Look to promote a more uniformed method of collection and to promote people who go into the field to label the type of body of water they are collecting from.


Log in or sign up for Devpost to join the conversation.