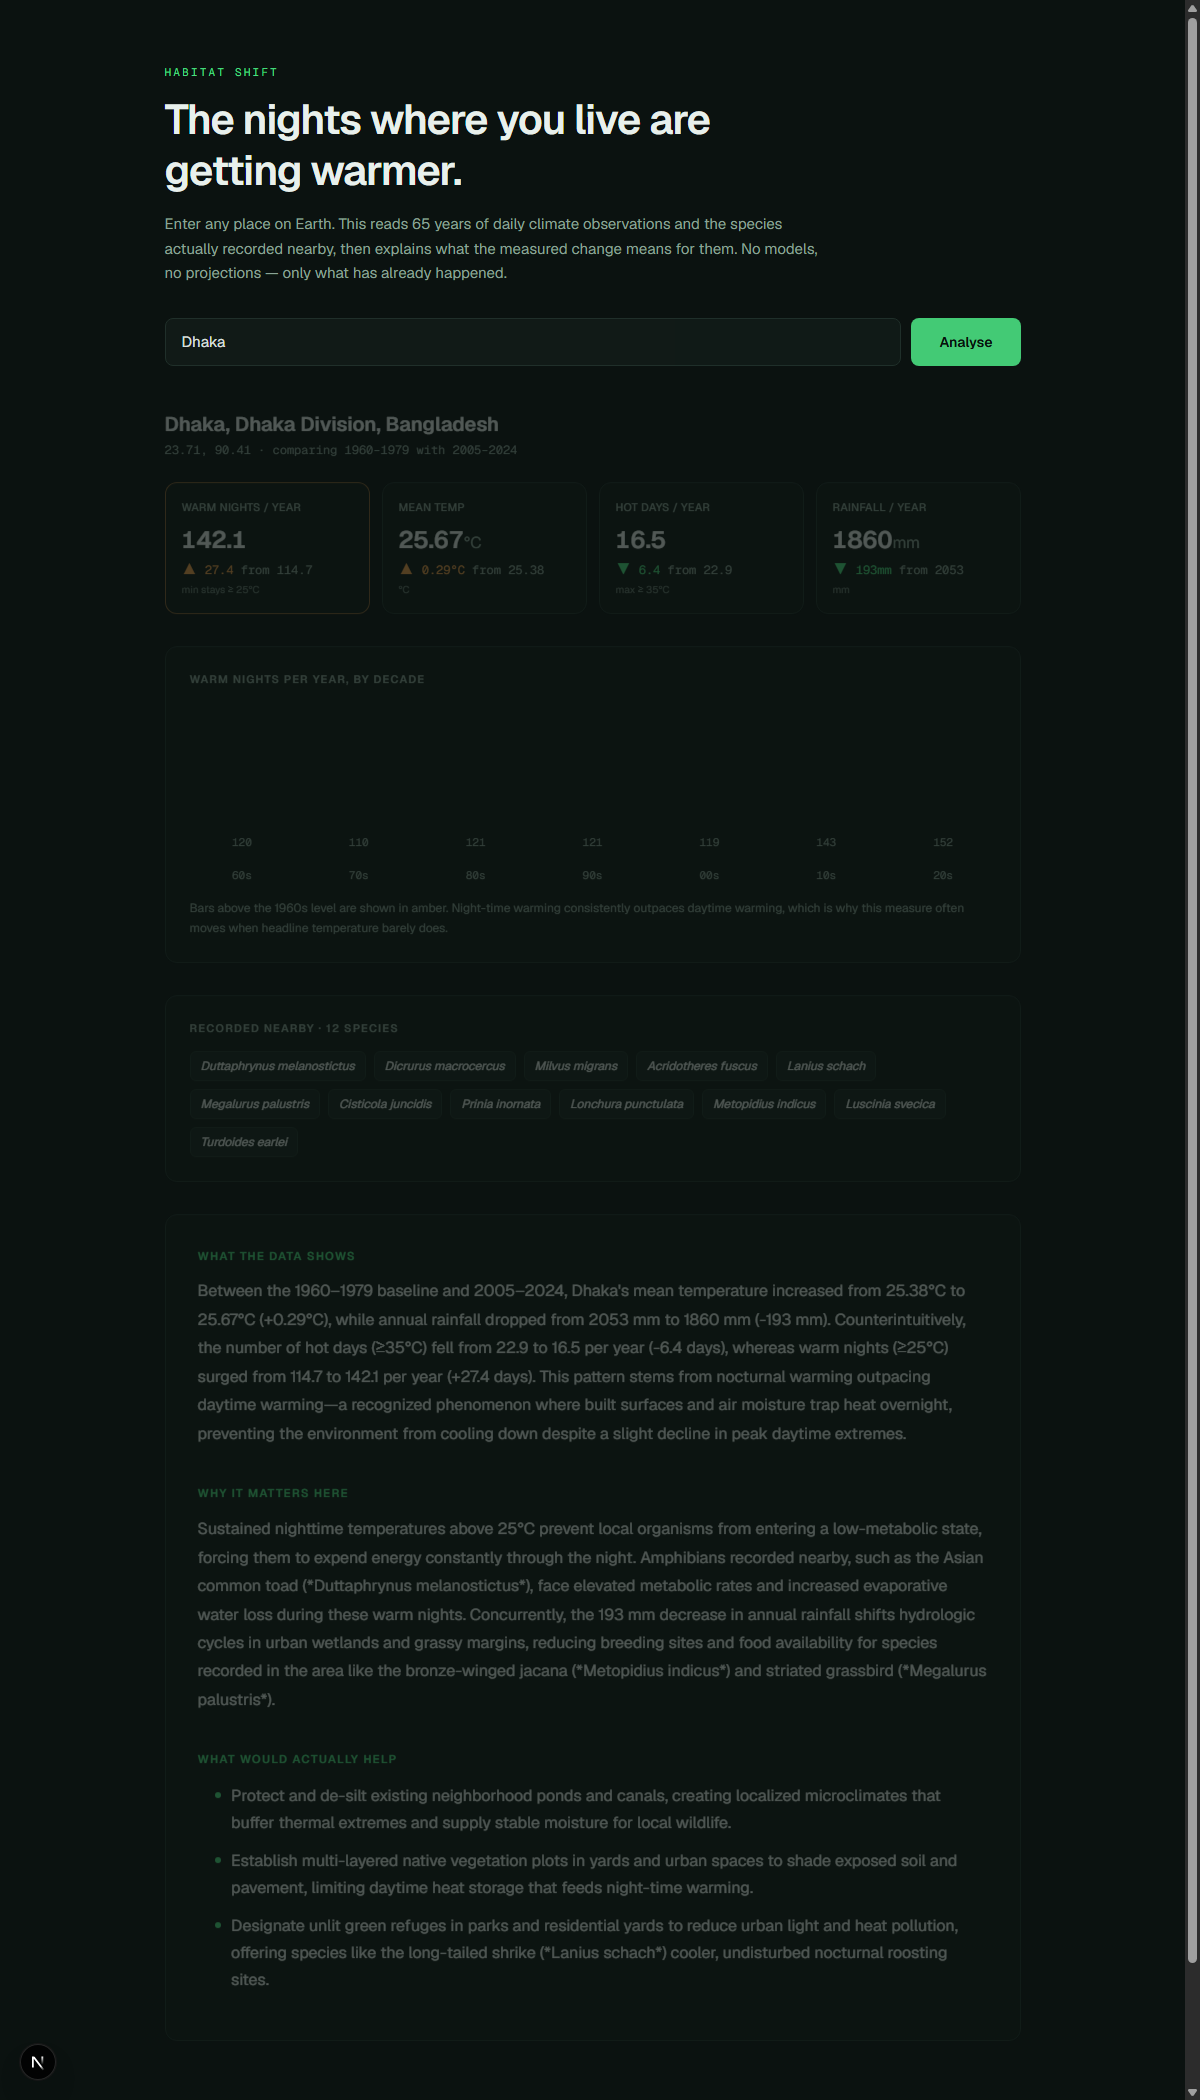
Habitat Shift
Enter any place on Earth. See how its climate has already changed since 1960, which species are recorded living there, and what the measured change actually means for them.
No projections, no models, no scenarios for 2100. Only what has already happened, measured, at the place you care about.
The finding this was built around
Ask anyone how climate change shows up locally and they will say "hotter days." For a lot of the world, that is not what the data says.
Run Dhaka through it and you get this:
| Measure (1960–1979 → 2005–2024) | Change |
|---|---|
| Hot days per year (max ≥ 35°C) | −6.4 ← fewer |
| Warm nights per year (min ≥ 25°C) | +27.4 |
| Mean temperature | +0.29°C |
| Annual rainfall | −193 mm |
Daytime extremes went down while warm nights went up by nearly a month per year. That is not an error in the data, and it is not cherry-picking — night-time warming outpacing daytime warming is one of the best-documented signals in climate science, driven by humidity, cloud cover, aerosols and urban heat retention.
It also happens to be the measure that matters most ecologically. Insects, amphibians and plants depend on a cool overnight recovery period to reset their metabolism. Take that away and they burn energy through the night they should be conserving — regardless of what the daytime headline number does.
So this tool leads with the number that matters biologically rather than the one that is easy to talk about, and it will happily show you a metric moving in the "wrong" direction rather than quietly hiding it.
How it works
- Geocode the place you typed (Open-Meteo geocoding).
- Fetch 65 years of daily observations — 1960 to 2024, roughly 23,700 days of maximum temperature, minimum temperature and precipitation — in a single request to the ERA5 reanalysis archive.
- Reduce to two comparable 20-year windows, 1960–1979 against 2005–2024. Two decade-long windows rather than first-year-versus-last-year, because a single year is weather, not climate.
- Fetch species actually recorded within ~30 km from GBIF occurrence records.
- Write the briefing. Gemini receives only the computed statistics and the species list — never prose to paraphrase — and is instructed to cite only those numbers, to explain counterintuitive results rather than smooth them over, and never to invent a species or a statistic.
The statistics are computed in lib/data.ts before the model ever sees them. If the model is unavailable, every measured number still renders — the data is the product, the briefing is the interpretation.
Built With
- era5
- gbif
- gemini
- next.js
- open-meteo
- tailwindcss
- typescript
- vercel

Log in or sign up for Devpost to join the conversation.