-
-
Slide 1
-
Slide 2
-
Slide 3
-
Slide 4
-
Slide 5
-

Slide 6
-
Slide 7
-
Slide 8
-

Slide 9

Inspiration
In 1996, AIDS was a death sentence. The AIDS Clinical Trials Group Study 175 was conducted during a pivotal moment in medical history - researchers were desperately searching for treatments that could save lives. We wanted to step into the shoes of those researchers and ask: what would the data have told us? Could we have identified which treatments were working before the results were officially published?
This project isn't just about numbers, it's about 2,139 real patients who volunteered for a clinical trial hoping for a chance at survival.
What it does
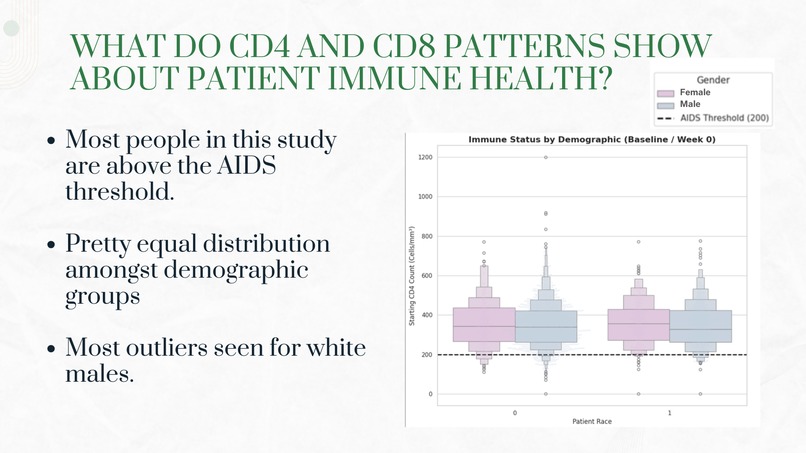
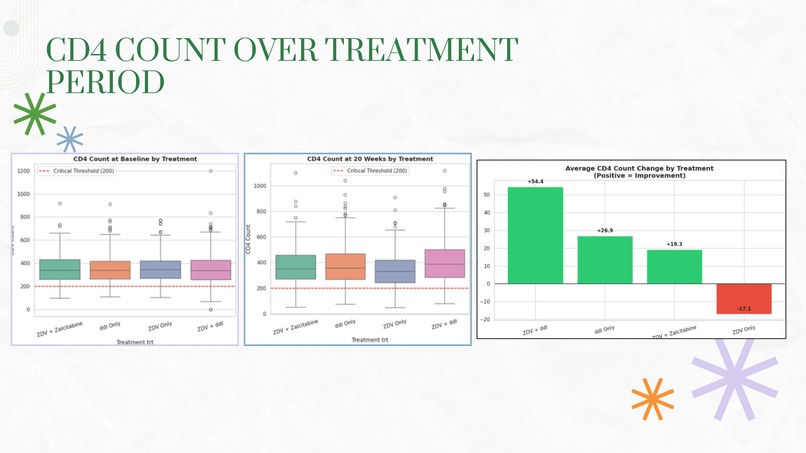
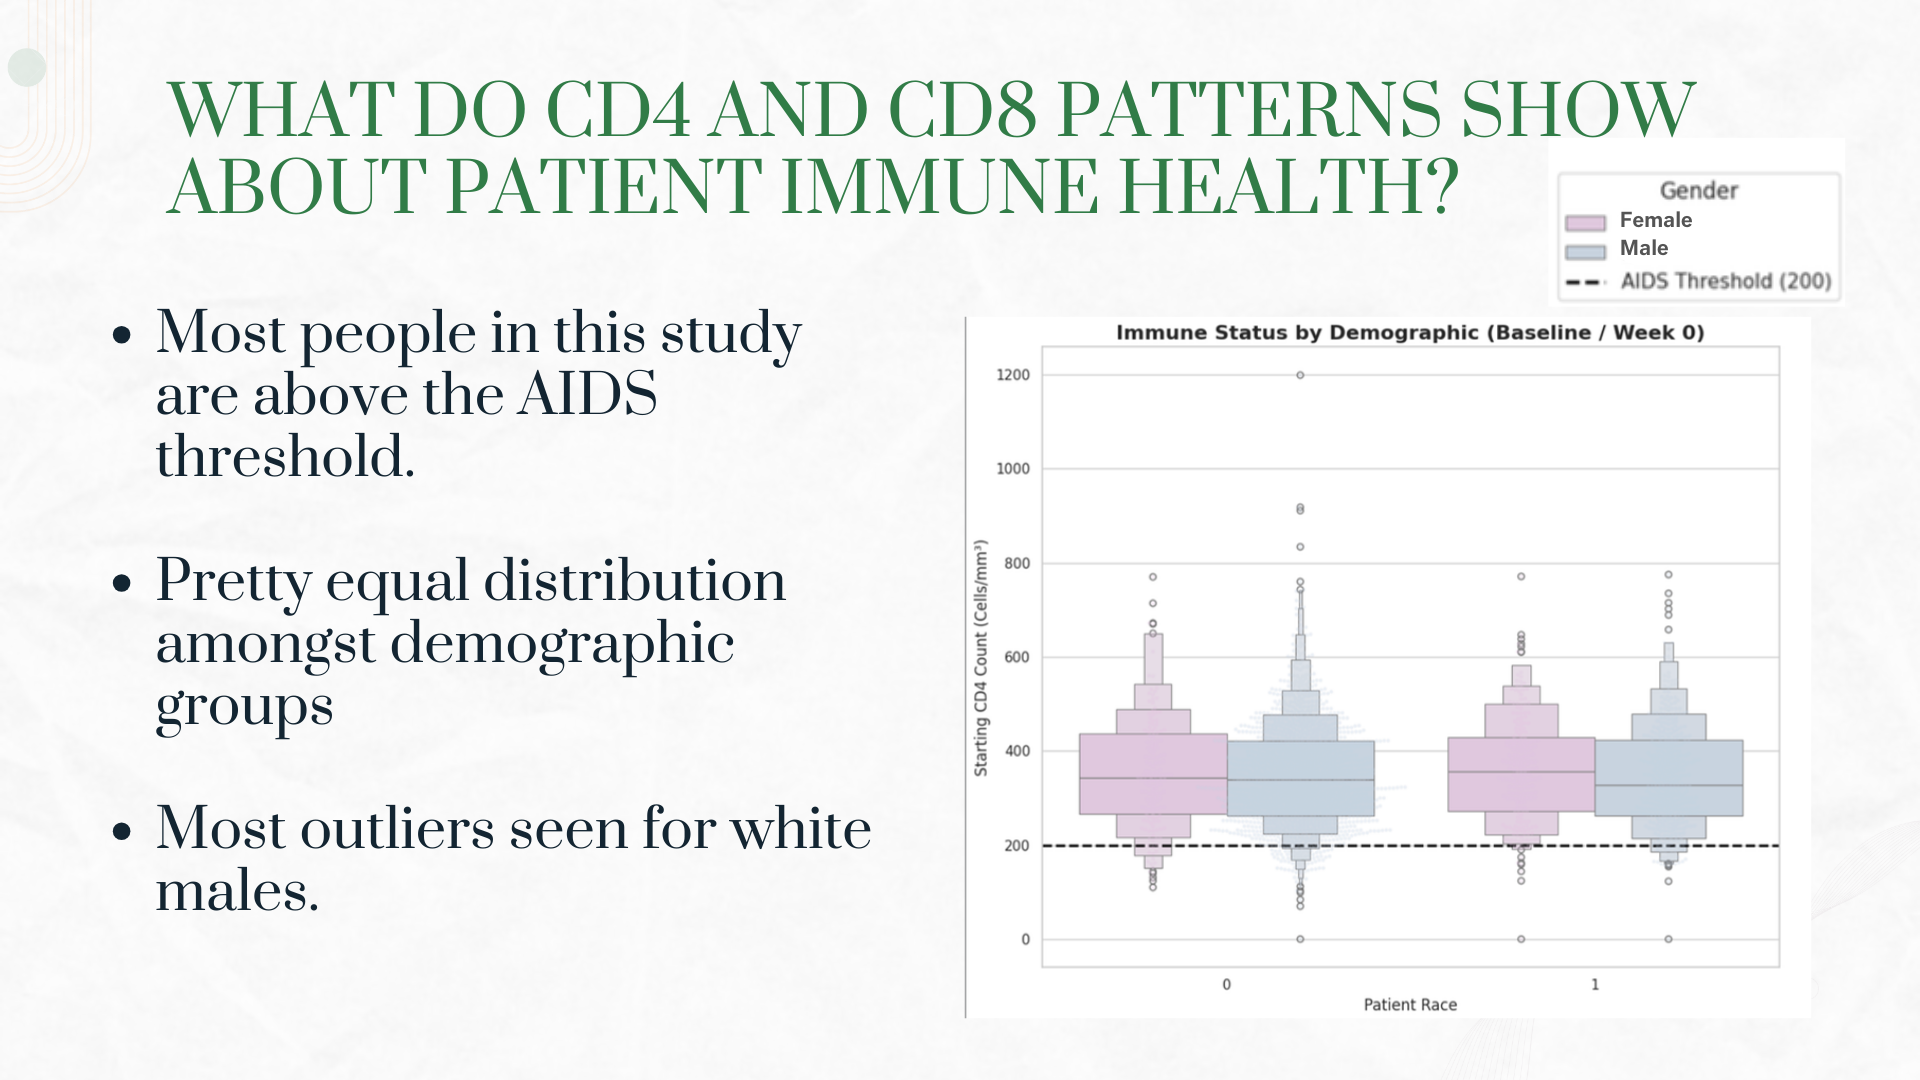
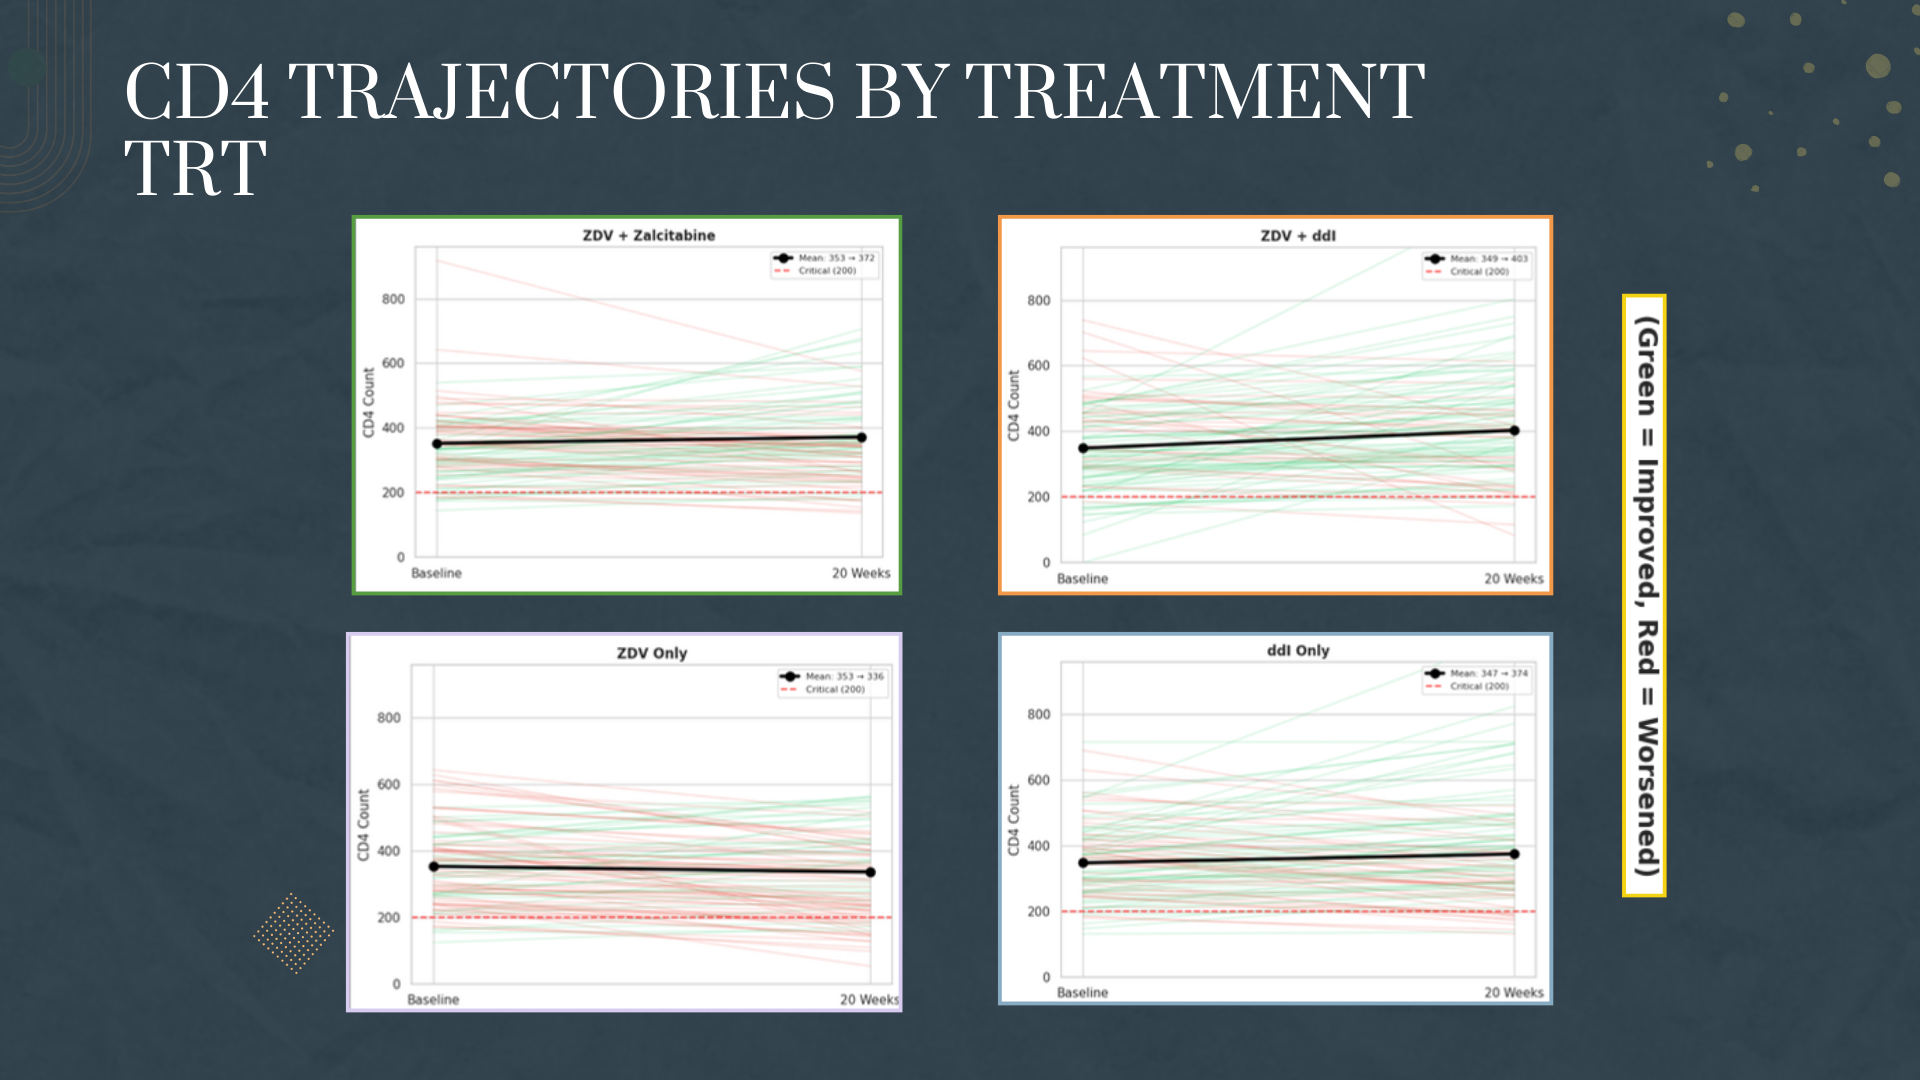
The immune system tells a story through numbers. We learned that the CD4:CD8 ratio is a powerful indicator of immune health, and that a ratio below 1.0 combined with CD4 counts under 200 signals critical AIDS progression. We discovered that not all treatments are created equal - combination therapies dramatically outperformed monotherapy, a finding that would later revolutionize HIV treatment worldwide.
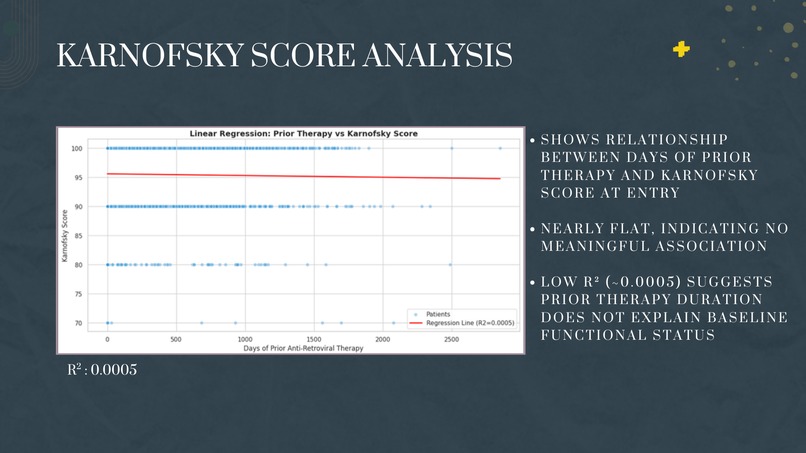
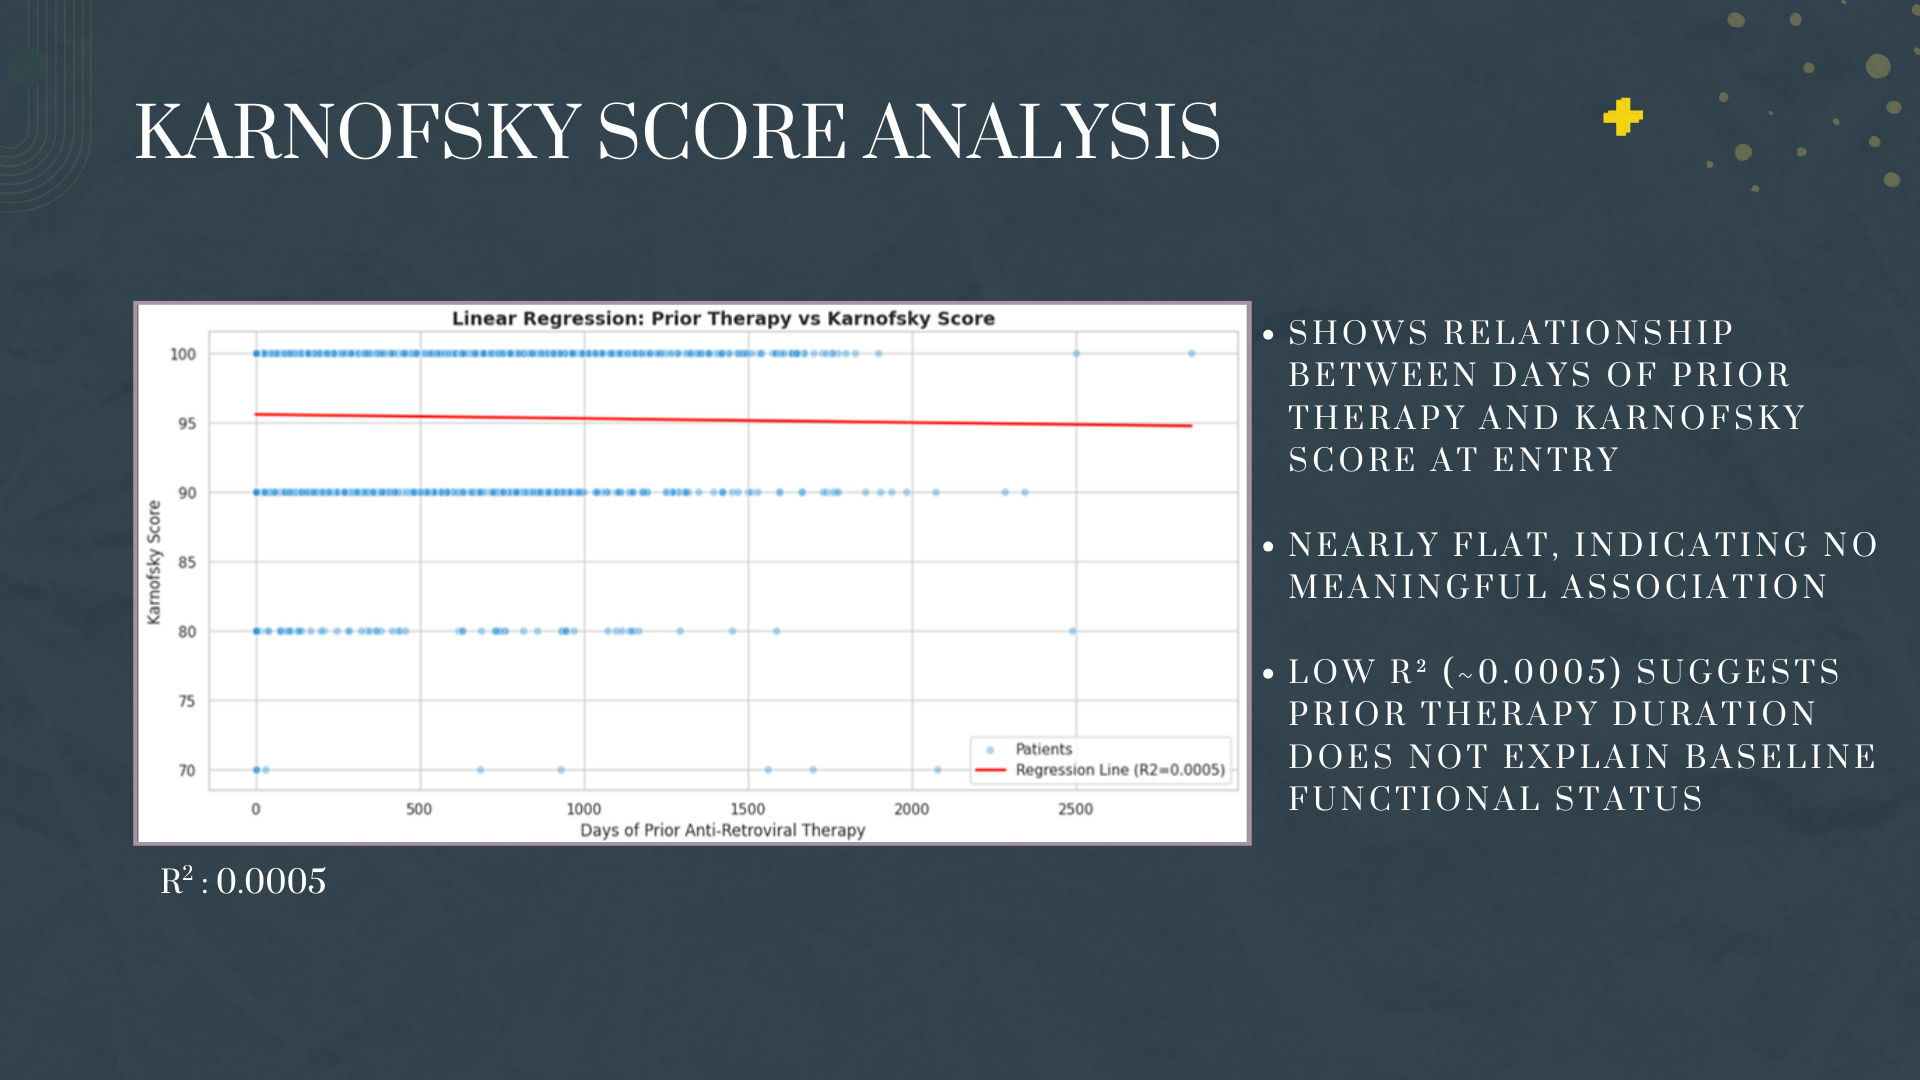
We also learned that some relationships aren't as strong as expected. Prior therapy duration showed almost no correlation with patient wellbeing (Karnofsky scores), teaching us that medicine is complex and single variables rarely tell the whole story.
How we built it
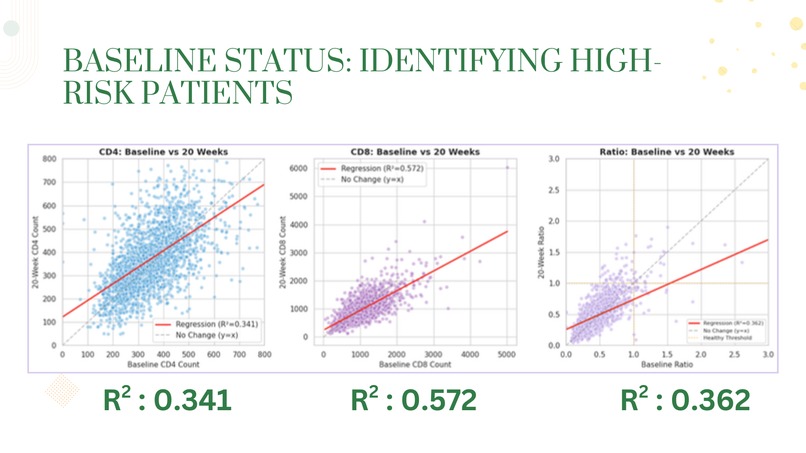
- Immune Status Analysis: We classified patients into risk categories based on CD4:CD8 ratios and tracked their transitions from baseline to 20 weeks
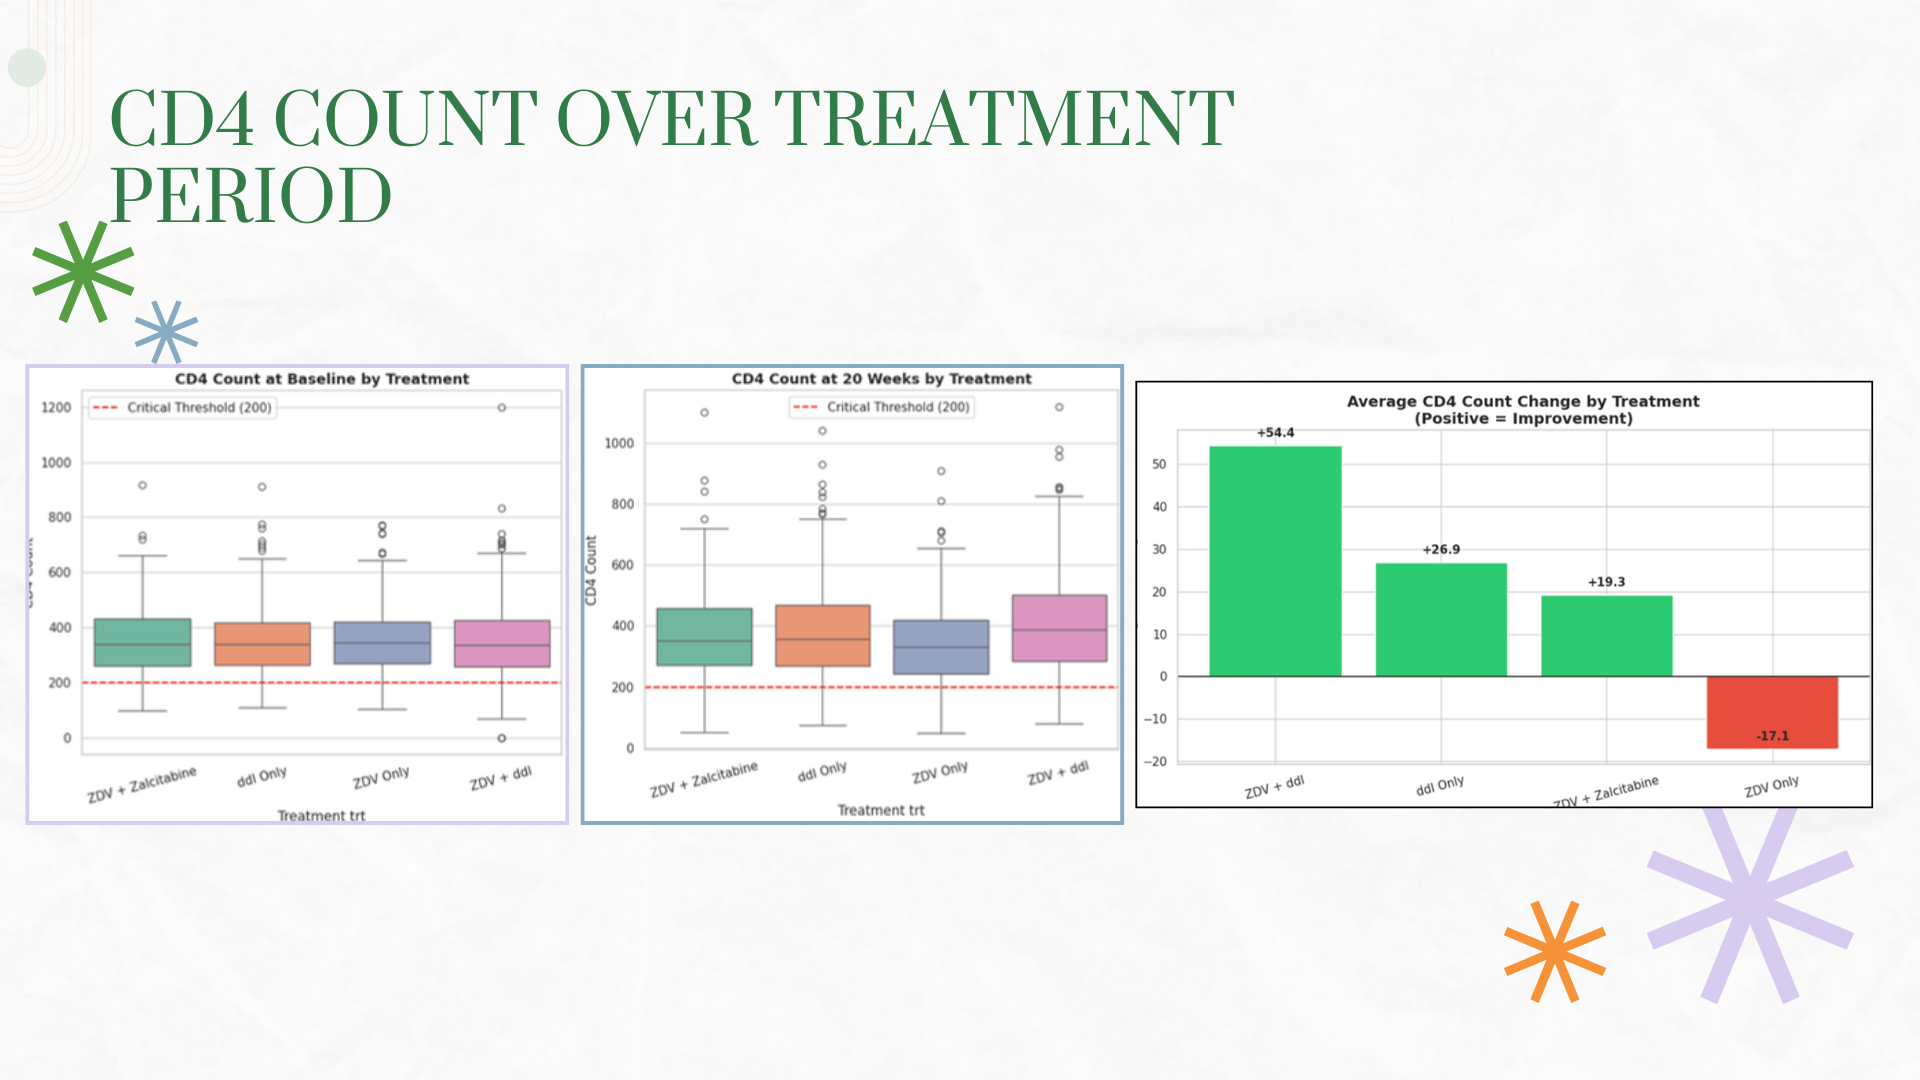
- Treatment Comparison: We compared four treatment arms using box plots, trajectory visualizations, and statistical tests (ANOVA, t-tests)
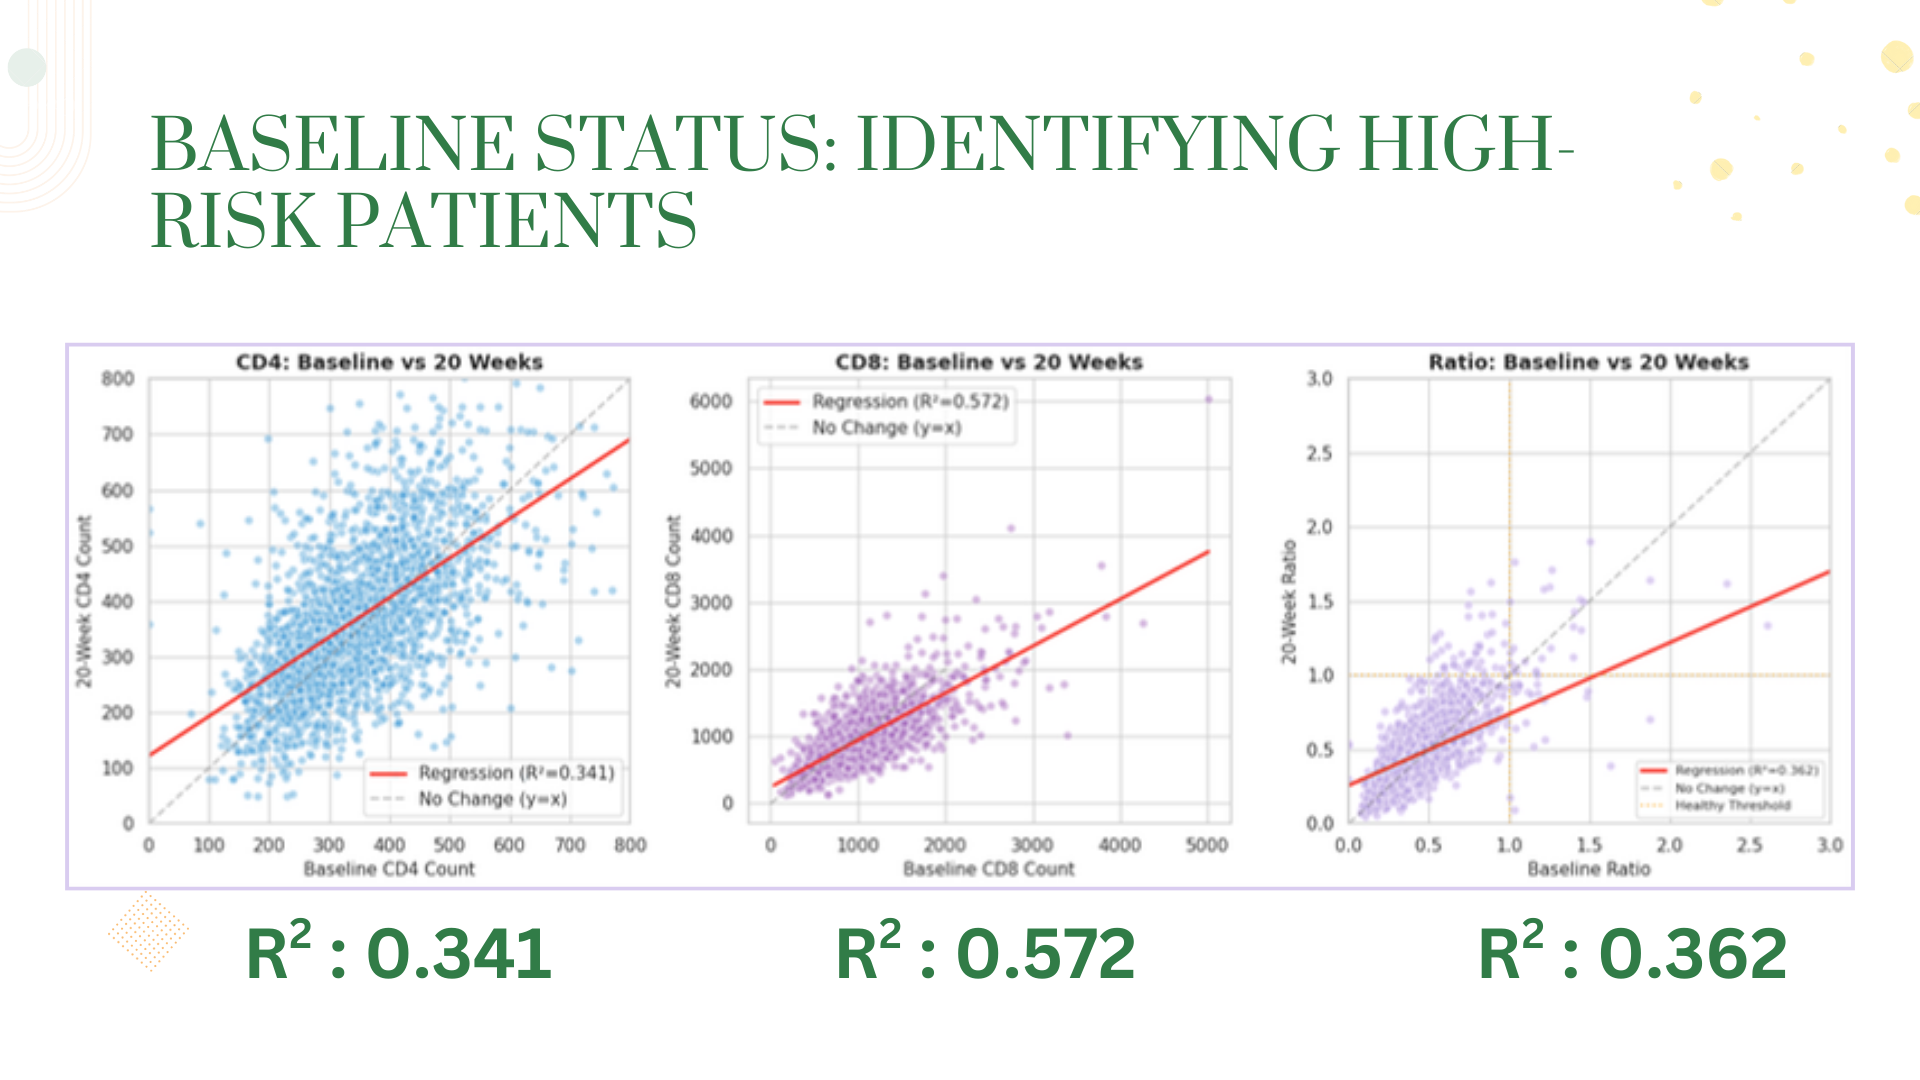
- Regression Modeling: We built linear regression models to predict 20-week outcomes from baseline values, evaluating model fit using R² scores
- Quality of Life Analysis: We examined how prior treatment experience affected Karnofsky functional scores
Our tech stack: Python, Pandas, Seaborn, Matplotlib, Scikit-learn, and SciPy for statistical testing.
Challenges we ran into
The "So What?" Problem - Early on, we had charts and numbers but no narrative. We had to step back and ask: what questions actually matter clinically? This shifted our focus from generic EDA to targeted investigation.
Interpreting Weak Correlations - When our Karnofsky regression returned an R² near zero, we initially thought we did something wrong. We learned that a weak result IS a result - it tells us that prior therapy duration isn't the key factor in patient wellbeing.
Visualization Overload - With so many variables, we could have created dozens of meaningless charts. The challenge was selecting visualizations that actually communicate insights, not just display data.
Accomplishments that we're proud of
We successfully classified 2,139 patients into meaningful immune status categories using medical criteria (CD4:CD8 ratio < 1.0 and CD4 < 200), creating visualizations that clearly show patient transitions from critical to healthier states. Our treatment comparison analysis produced clear, actionable insights - identifying ZDV + ddI as the top performer with +54 CD4 improvement versus ZDV monotherapy's -17 decline. We built regression models with moderate-to-good fit (R² up to 0.57 for CD8) that demonstrate baseline values can meaningfully predict treatment outcomes. Most importantly, we transformed raw clinical data into a coherent narrative about treatment efficacy that aligns with real-world medical history.
What we learned
Medicine is messy. We expected strong linear relationships everywhere but discovered that some variables (like prior therapy duration vs. Karnofsky scores) have almost no correlation - teaching us that human health is complex and rarely reducible to single predictors. We learned how to translate medical criteria into code, turning clinical definitions like "AIDS indicator" into programmable classification functions. We gained hands-on experience with statistical testing - paired t-tests, ANOVA, Pearson correlations - and learned when each is appropriate. Perhaps most valuable: we learned that a weak R² isn't a failure, it's a finding.
What's next for Inside the Immune System; Insights From Clinical Trial Data
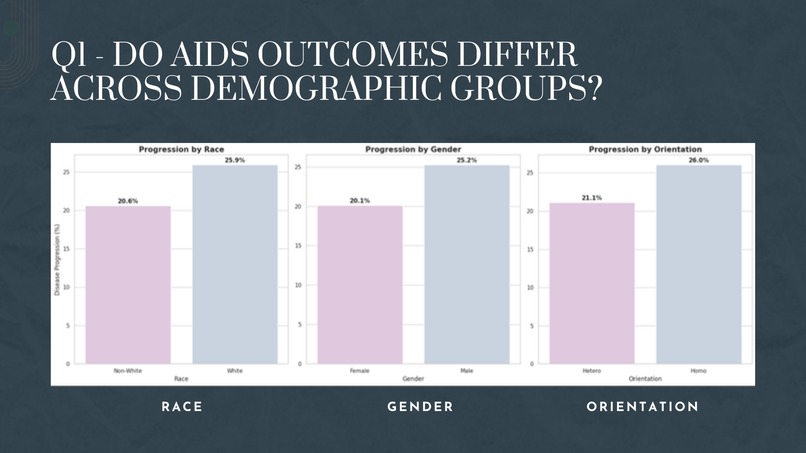
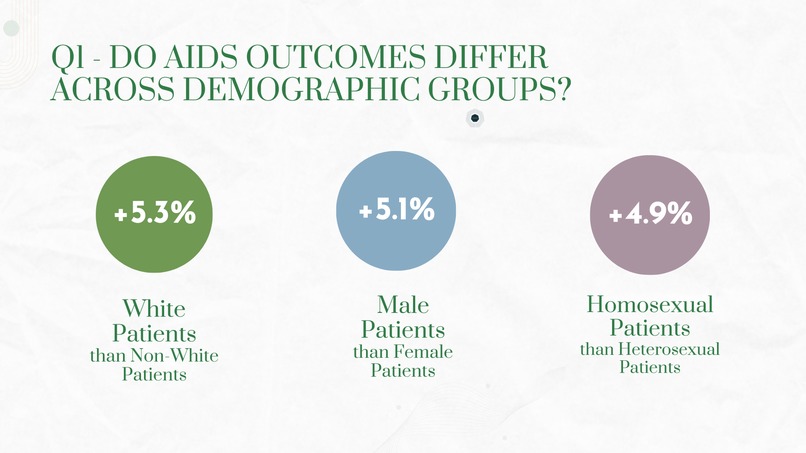
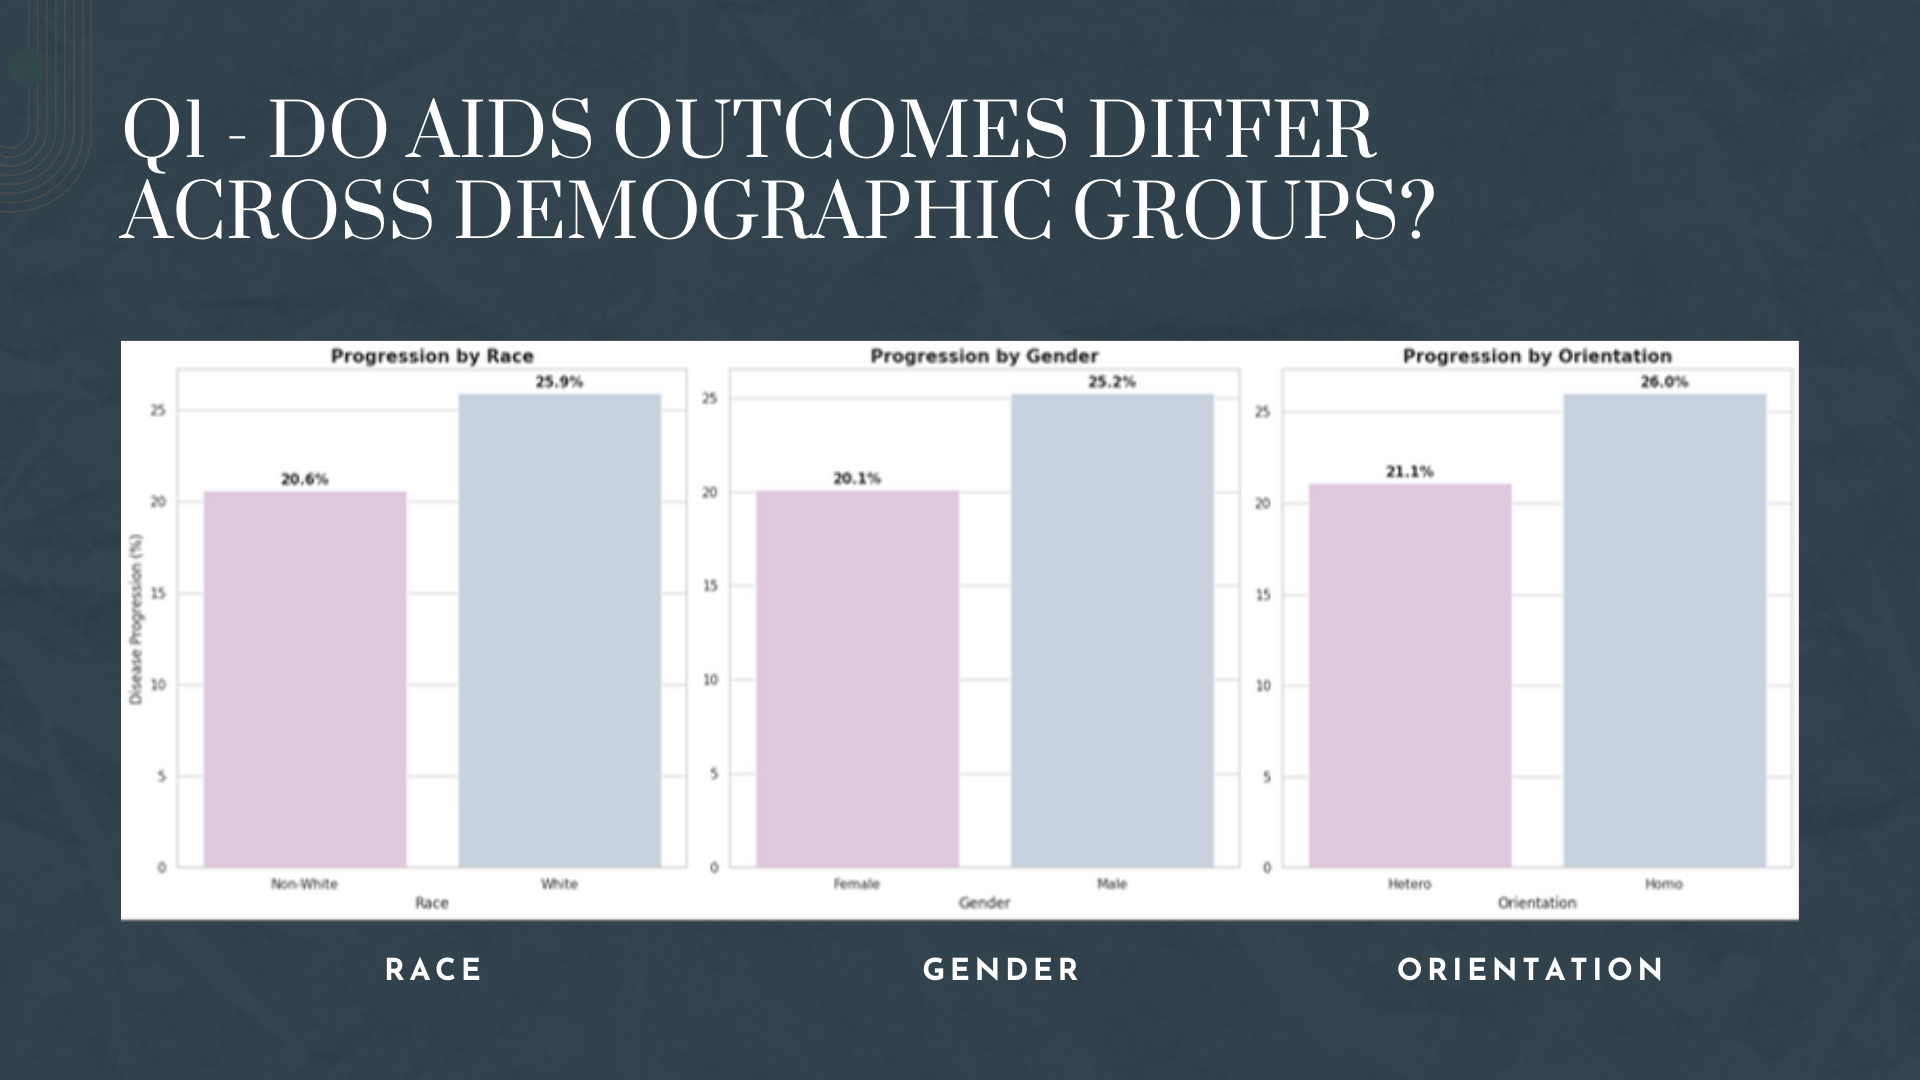
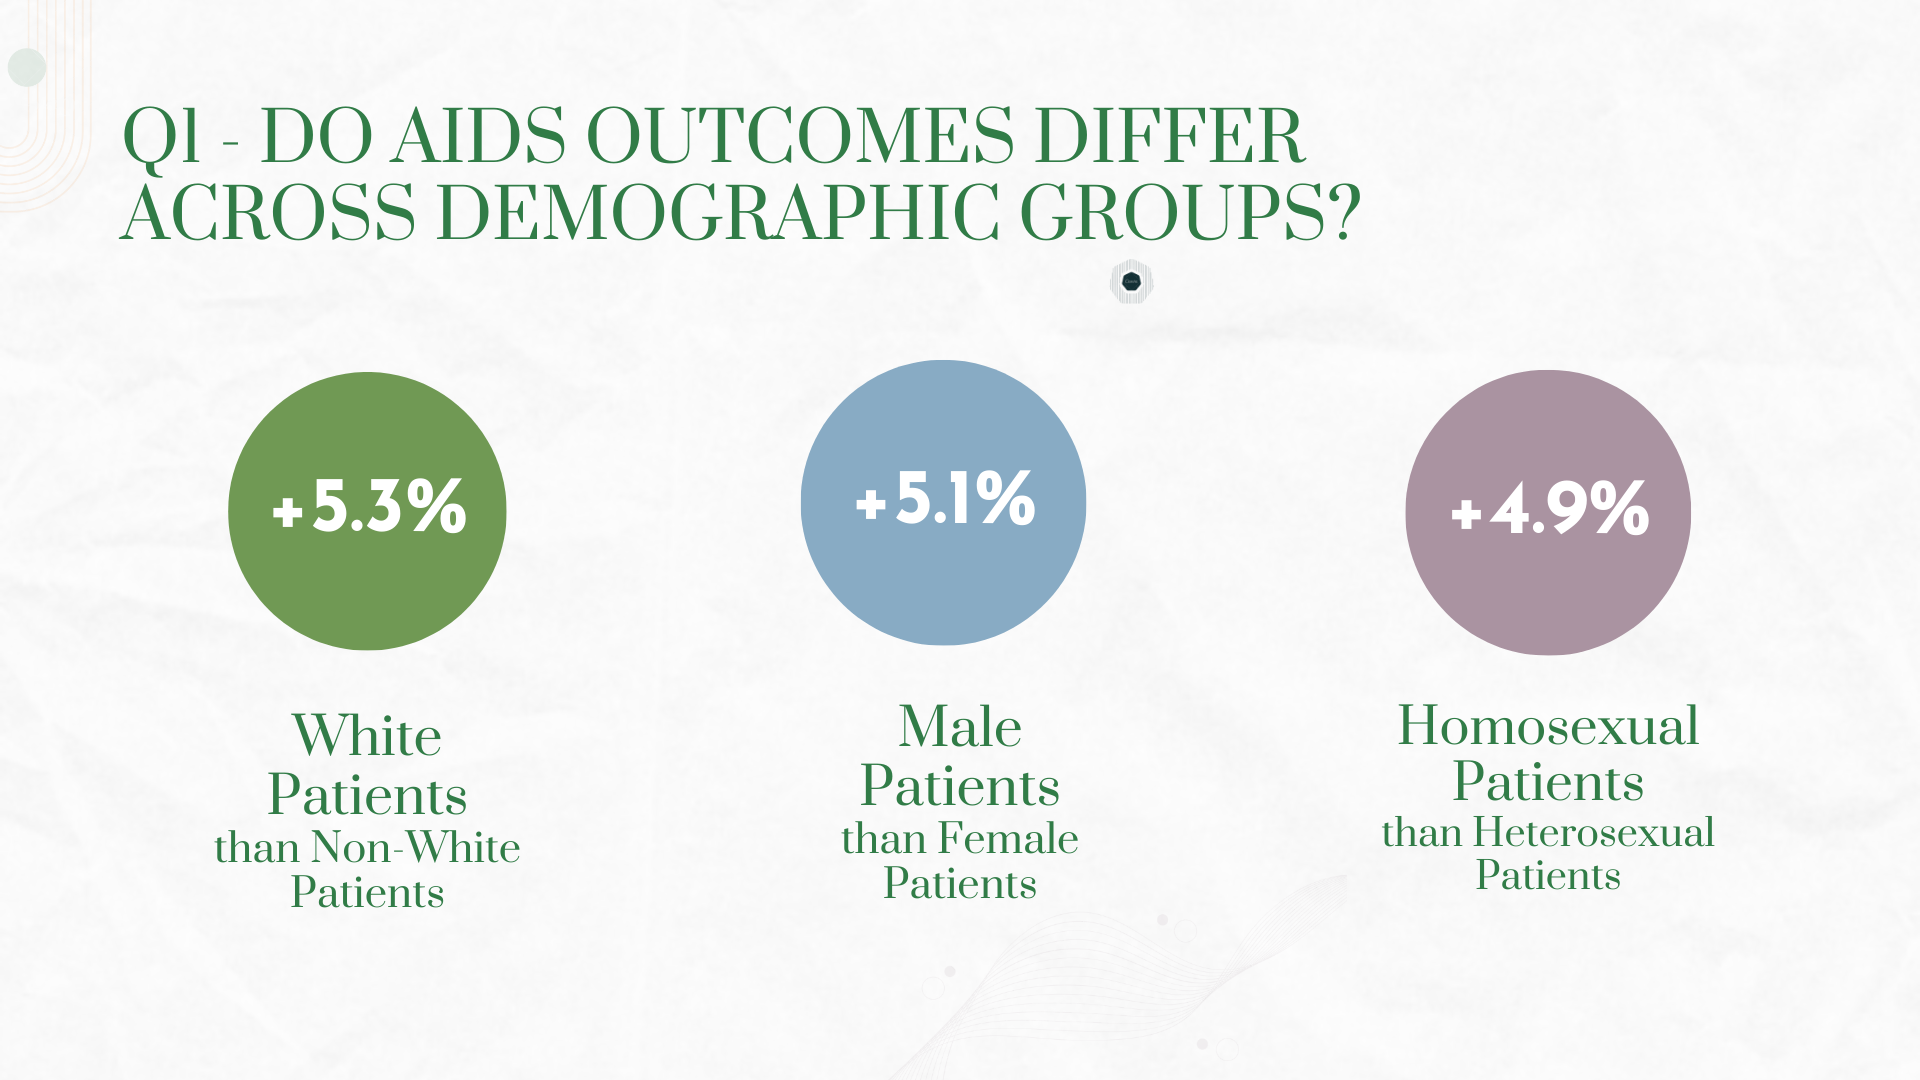
We'd like to expand our analysis to include survival modeling using the censoring variable (cid) to predict patient outcomes over time. Incorporating machine learning classifiers like Random Forest or XGBoost could improve our predictive accuracy beyond linear regression. We're also interested in exploring demographic disparities - examining whether race, gender, or age affect treatment efficacy differently. Finally, building an interactive dashboard using Streamlit or Plotly would allow clinicians and researchers to explore the data themselves.


Log in or sign up for Devpost to join the conversation.