-
Hepatocellular Carcinoma - Exelixis
Healthy Markets!
This was our first hackathon so we had no idea what to expect. The first night, we stood in line for every free shirt or knickknack we could find and were pretty content. It wasn't until we started visiting the sponsor tables that we started thinking about what we wanted to do. After 36 hours, we've produced something not quite as amazing as we were hoping, but something we're proud of, nonetheless.
We've used NASDAQ's API to get information on companies of interest and we've used PubMed's API to collect information on published scientific papers. NASDAQ's API gives us historical and live streaming data on its market. PubMed's API allows us to access information about scientific papers like when they were published, who published them, and even their abstracts. We wrote python scripts to pull information from the APIs and to format the information so that it could be easily analyzed and visualized. The NASDAQ script will pull information on particular stock tickers and then our "cleaner" script will format the data and pipe it into a neat csv. The PubMed script was similar, but required less cleaning to look nice.
We then wrote a python script to scrape webpages to find companies that produced pharmaceuticals or other health related products that could prevent or cure notable infectious diseases. We initially focused on finding micro cap biotech and pharma companies because we thought that the smaller companies would have more niche products that would better fit a single disease. However, we later found that larger companies could have subsidiaries that produced similar products so we had to expand our web scrape. After finding the companies and a brief description of what they do, we used keywords concerning the diseases as query search terms in PubMed to determine the number of papers published in a particular time period about that disease.
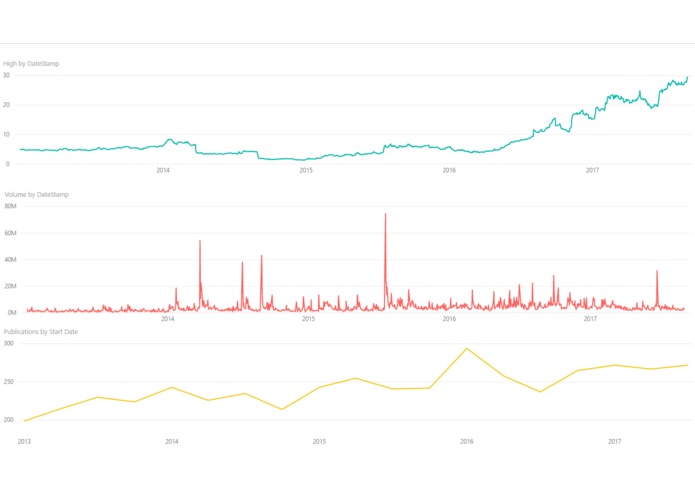
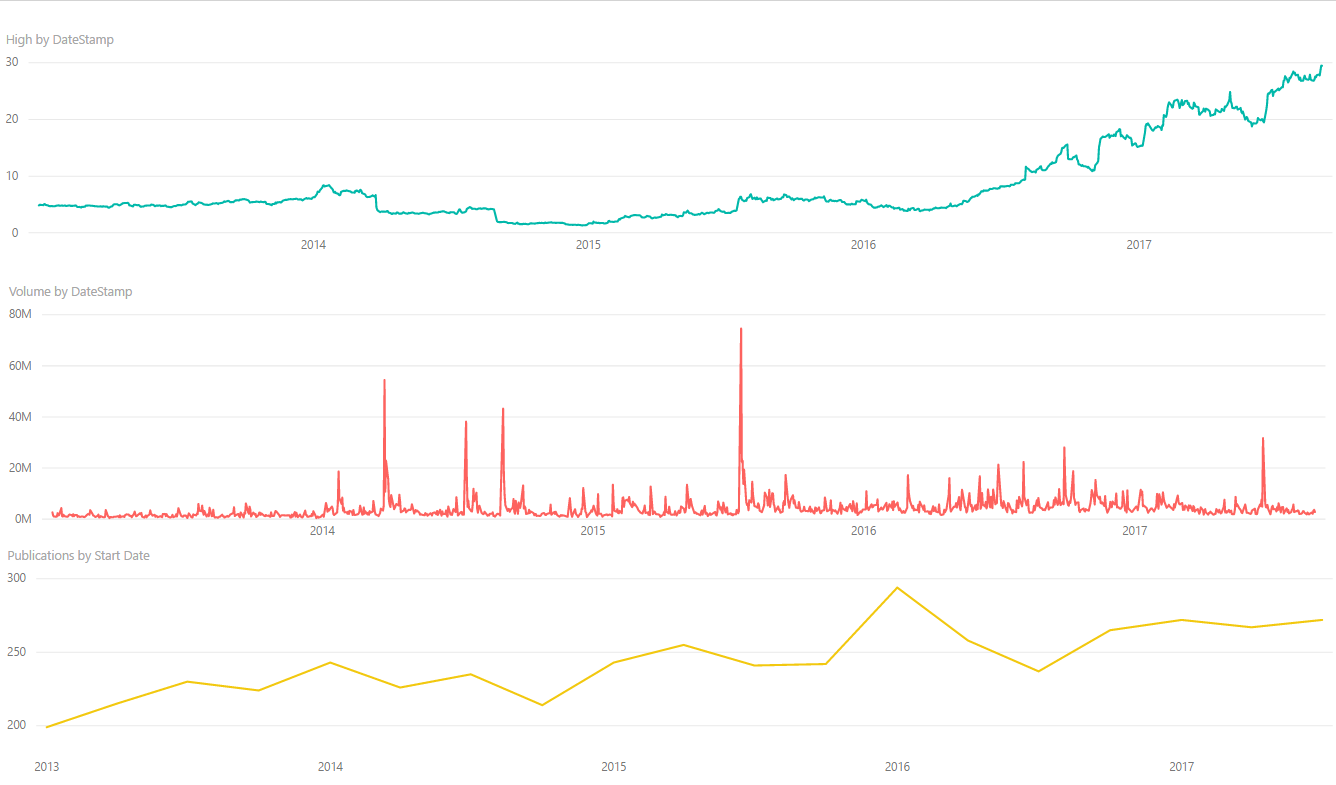
After collecting the data, we graphed the market trends throughout the years next to the number of papers published in the time period. We decided we wanted to look primarily at the trend of published papers on the disease, whether the number increased or decreased, and the volume traded of a particular stock. There is a ton of information that we collected that we haven't used yet, and we hope to be able to work with it more in the future.
We have a strong interest in healthcare and medicine and after visiting NASDAQ's booth, we thought it could be interesting to see if the they had any correlations with the market. As a team, we have experience with writing parts of peer-reviewed scientific journals articles and felt like they were a interesting indicator of what was important to the scientific and medical communities. We guessed that large epidemics or breakthroughs might influence the number of papers published on a particular disease as it got more attention because of news and social media among other sources. Scientific papers are a driving force in raising awareness about health and we wanted to see if they had any other notable effects on society. More papers published on a disease could potentially have a large influence on public perception and how society responds to epidemics.
A big challenge for us was formatting the data. A bulk of our time was spent on "cleaning" the data the NASDAQ API gave us. We wanted the data from both NASDAQ and PubMed to be in csv format so we could use certain packages we learned in class to manipulate and manage the information. Looking back, wrangling all that data and putting it together wasn't that challenging conceptually, but it definitely wasn't easy while we were doing it.
Another issue we ran into was that the financial data only went back to 2013. This limited our possibilities of the number of diseases we could find papers for and also cut short any long term trends we might have saw. Another issue was that the PubMed API to get information on the papers often gave us conflicting information. The API would return one date for a paper, but the website publication info would return another. The two wouldn't be vastly different, but it was enough to throw things off. To compensate for this, we decided to group papers into the quarter they were published in that year. This alleviated the date discrepancy, but also produced a less-than-ideal data set that definitely can be improved.
We're most proud of how much we got done in our first hackathon. We were joking that we'd probably end up leaving early or slacking off, but once we got into our project we just worked and worked nonstop. It was stressful, but it was a lot of fun and has definitely convinced us to pursue more hackathons in the future.
In the form we have it now, it's not particularly useful, but we are looking to talk with our data science professors to get their input on how we could improve and move forward. We have very little experience managing data and we hope they can provide insight that would point us in the right direction or help us improve what we already have. Ultimately, we hope that we can find ways to better understand how important research is to the world in not only fighting deadly diseases, but also influencing parts of society outside of health.

Log in or sign up for Devpost to join the conversation.