-
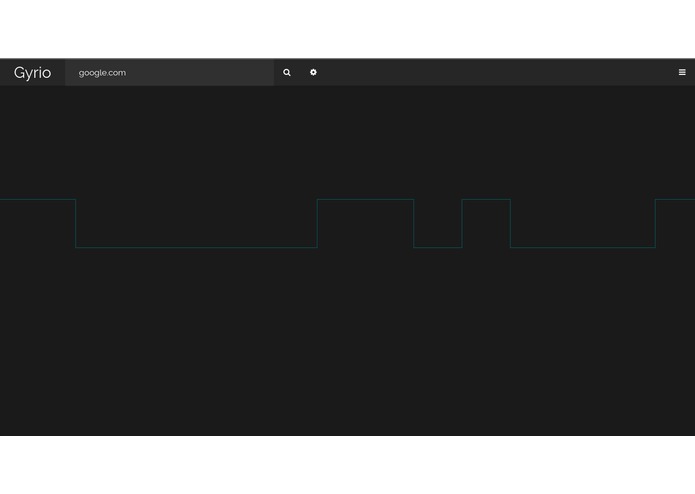
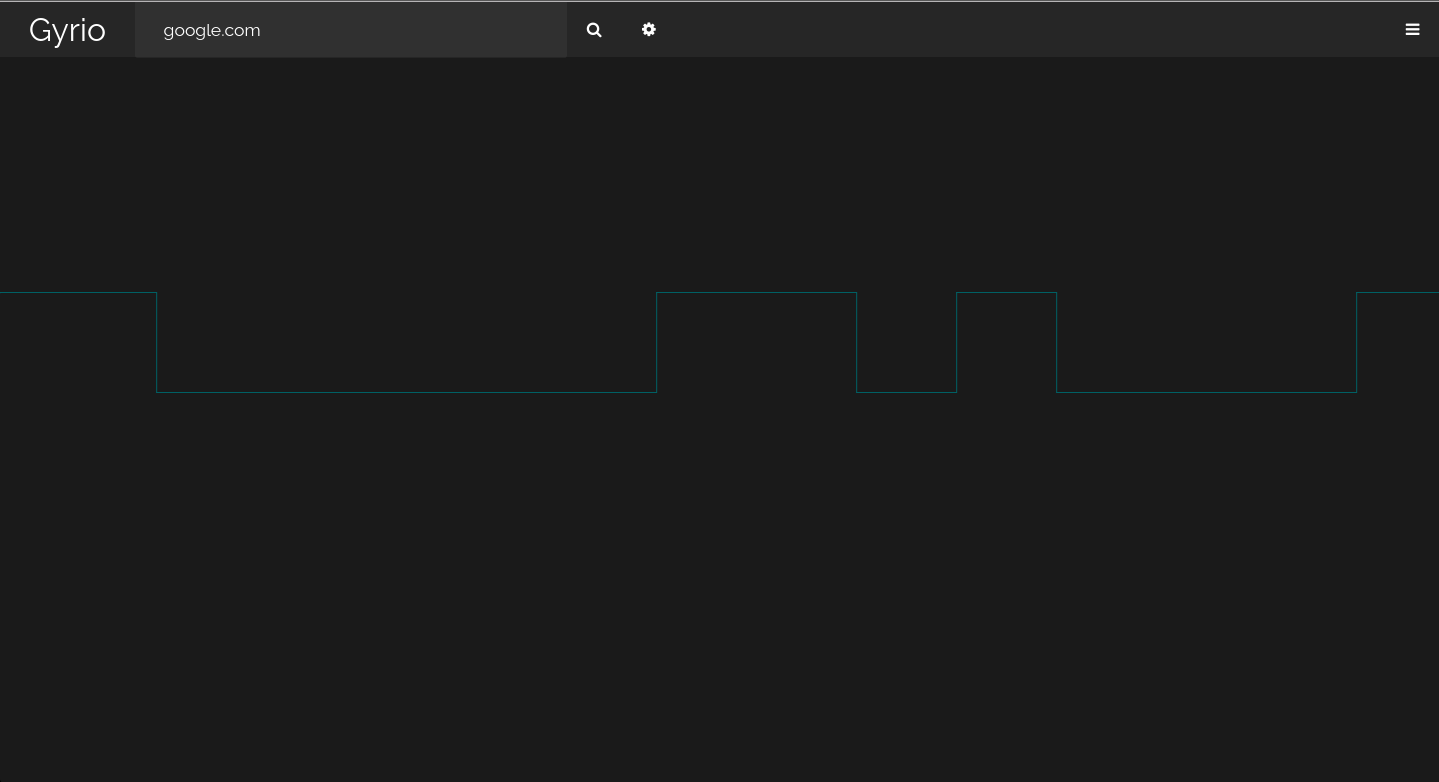
Linear Oscilloscope of google.com
-
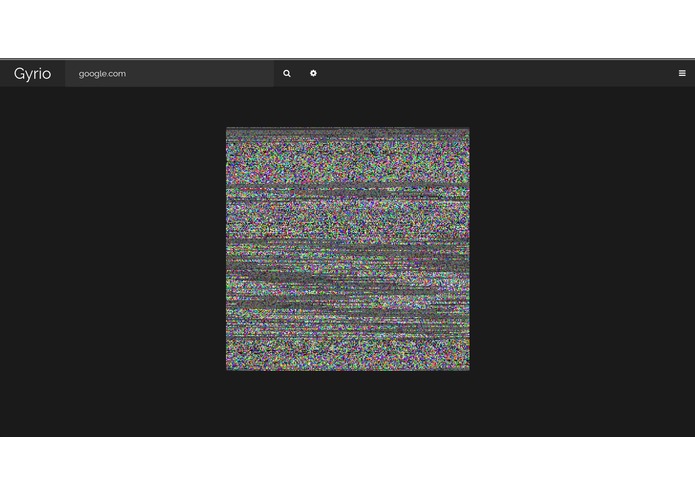
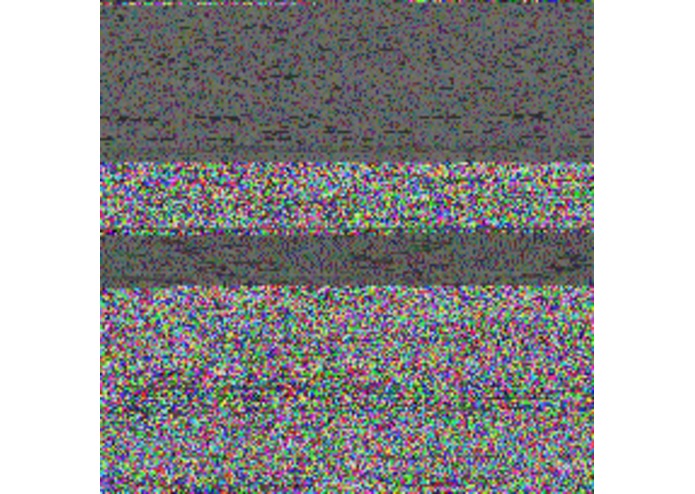
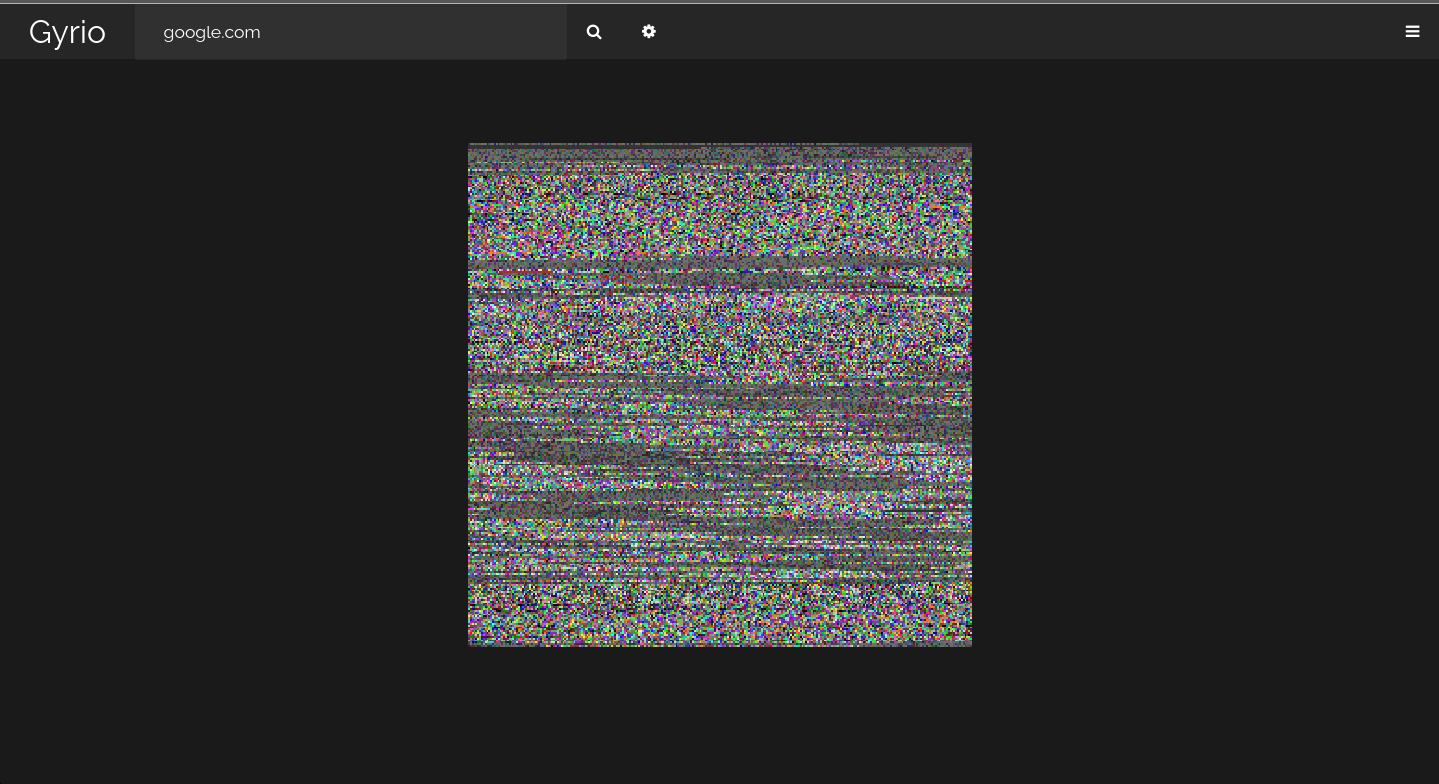
Image Visualization of google.com
-
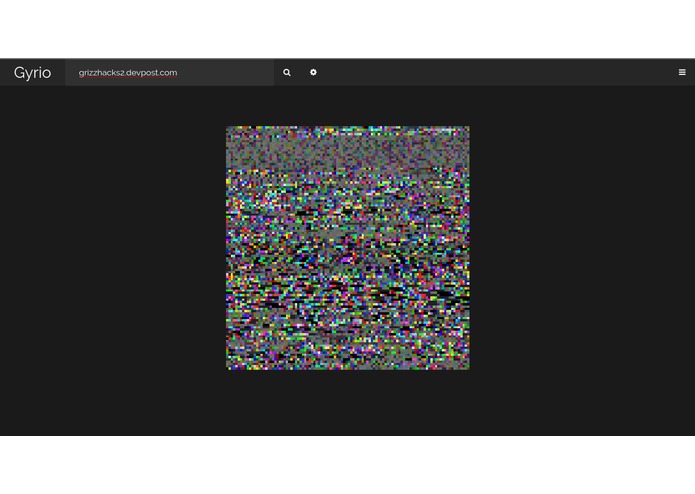
Image Visualization of grizzhacks.devpost.com
-
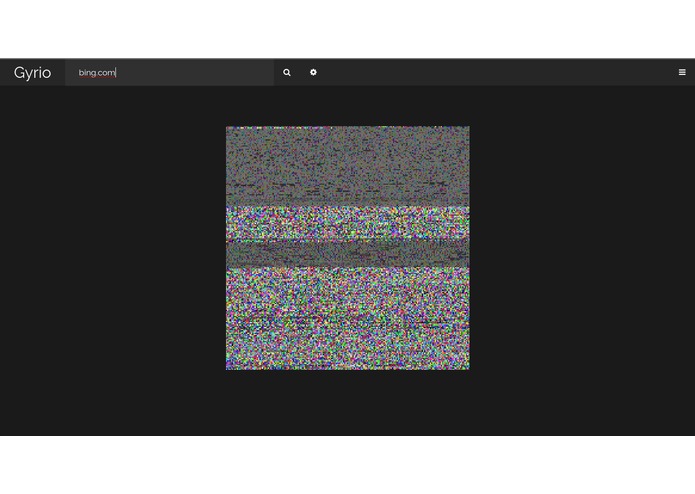
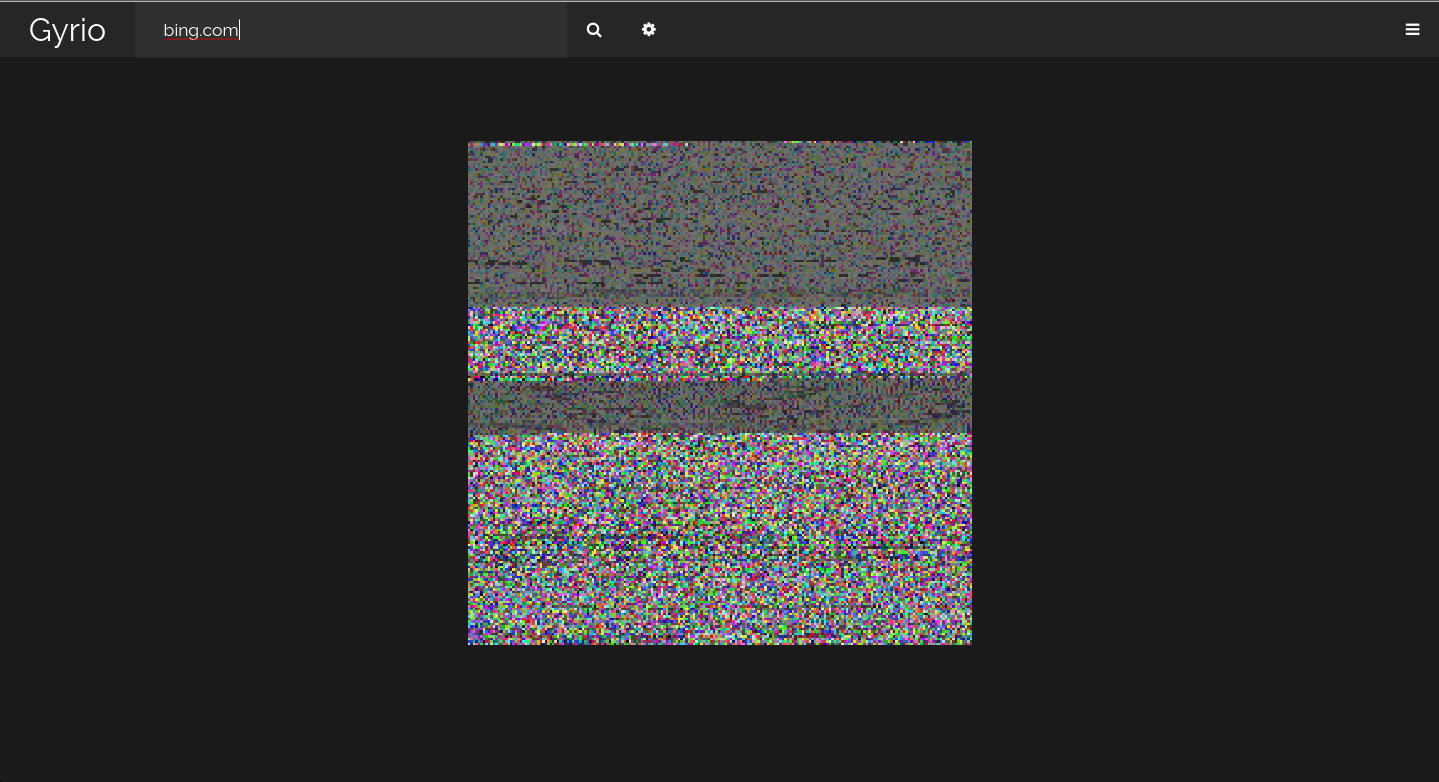
Image Visualization of bing.com
-
Exported Image Visualization of bing.com


Inspiration
Old MP3 Visualizer
What it does
Converts website into data which is then visualized in three ways: Linear Oscilloscope, Data Auralization, and Image Visualization.
Linear Oscilloscope
Renders the data as a binary wave.
Data Auralization
Renders the data as sound.
Image Visualization
Renders the data as a unique image based on the data.
How we built it
Using html, javascript, and css
Challenges we ran into
Some of the challenges we ran into include: transformation of waveform into the various visualizations
resizing unique image into a standard size
rendering the audio in real timed
Accomplishments that we're proud of
We are very pleased with our result. We managed to accomplish what we had set out to do, and are now able to visualize various websites in real time. Additionally, we are happy to have done this with a team relatively new to hackathons, given that most of us were not used to the standard practices at hackathons in general
What we learned
Google.com contains unique data each time it is accessed
Some websites are more complex than they seem
JavaScript can easily render sounds on the fly natively
What's next for Gyrio
More visualization modes, including more customization for each mode
Compare websites' data


Log in or sign up for Devpost to join the conversation.