
Inspiration
When we started looking through the data, we found that roughly one in three customers wouldn't survive six months financially if they lost their job.
What interested us was that banks already have the transaction history needed to identify these vulnerabilities, yet most customers only realize they're in trouble when something actually happens.
So we built a dashboard that creates a personalized financial recovery plan, helping customers extend their financial runway and prepare for unexpected setbacks.
What it does
Guardrails is a financial resilience engine built around 4,500 real, anonymized bank accounts.
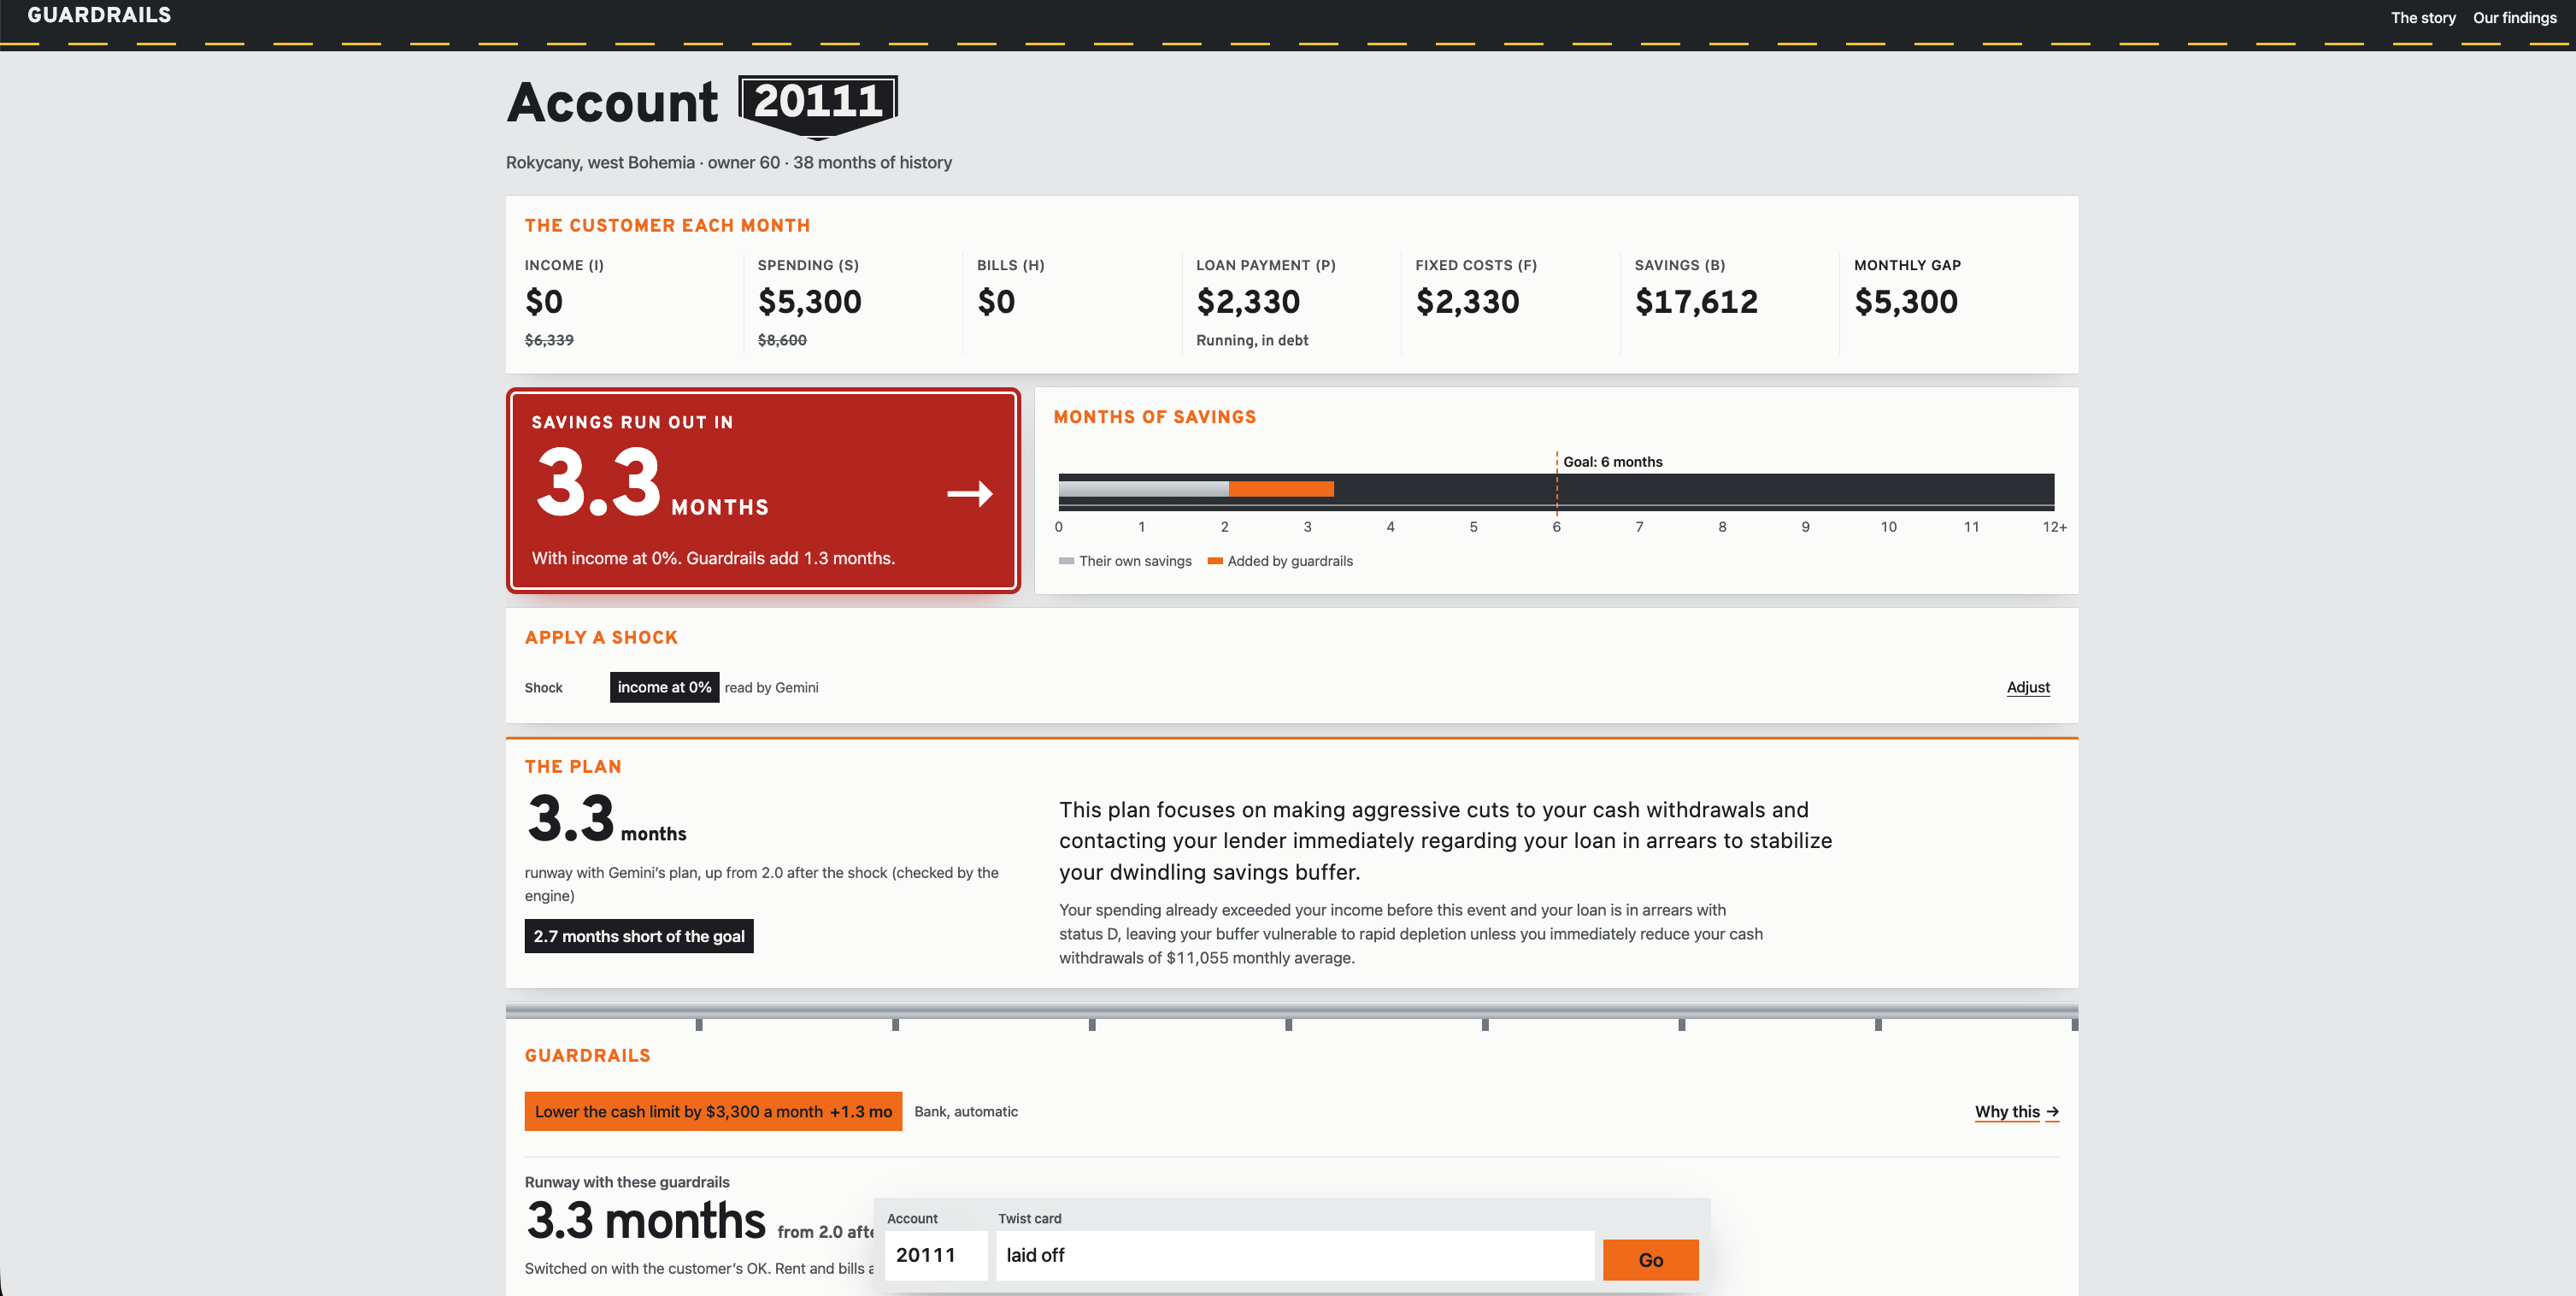
- Understand the customer. Given any account ID, it calculates income, spending, fixed costs, savings, and financial runway using the judges' formulas.
- Simulate a shock. Customers describe scenarios in plain English, such as losing their job while receiving 55% EI. Gemini interprets the request, and our engine recalculates their runway.
- Build a plan. Gemini proposes recommendations based on the customer's transactions. Deterministic code verifies the amounts and calculates how much runway each intervention could recover.
- Act on it. Recommendations become guardrails, including lower cash limits, loan deferral requests, paused standing orders, and low-balance alerts. Customers approve every action before the agent activates it in a sandbox.
For example, account 20111 starts with 7.8 months of runway. After a simulated layoff, that falls to 3.4 months. Two guardrails bring the modeled runway back to 6.3 months.
We also integrated PayPal sandbox checkouts and phone notifications. If a customer exceeds their spending limits, the system logs the event and sends an alert. Every guardrail includes a "Why this" page explaining the data behind its recommendation.
The question
Which bank customers would run out of money after a shock like a job loss, and what actually predicts it? Our first guess was income. It turned out to be the wrong answer.
What we found
We initially expected higher-income customers to be more financially resilient. But income and spending were almost perfectly correlated (Spearman 0.97). As people earned more, they generally spent more too.
Under our layoff simulation, 92% of customers in the lowest income quartile could survive six months, compared to just 30% in the highest.
That made us question whether income was even the right measure of financial security.
We investigated further and found four interesting patterns:
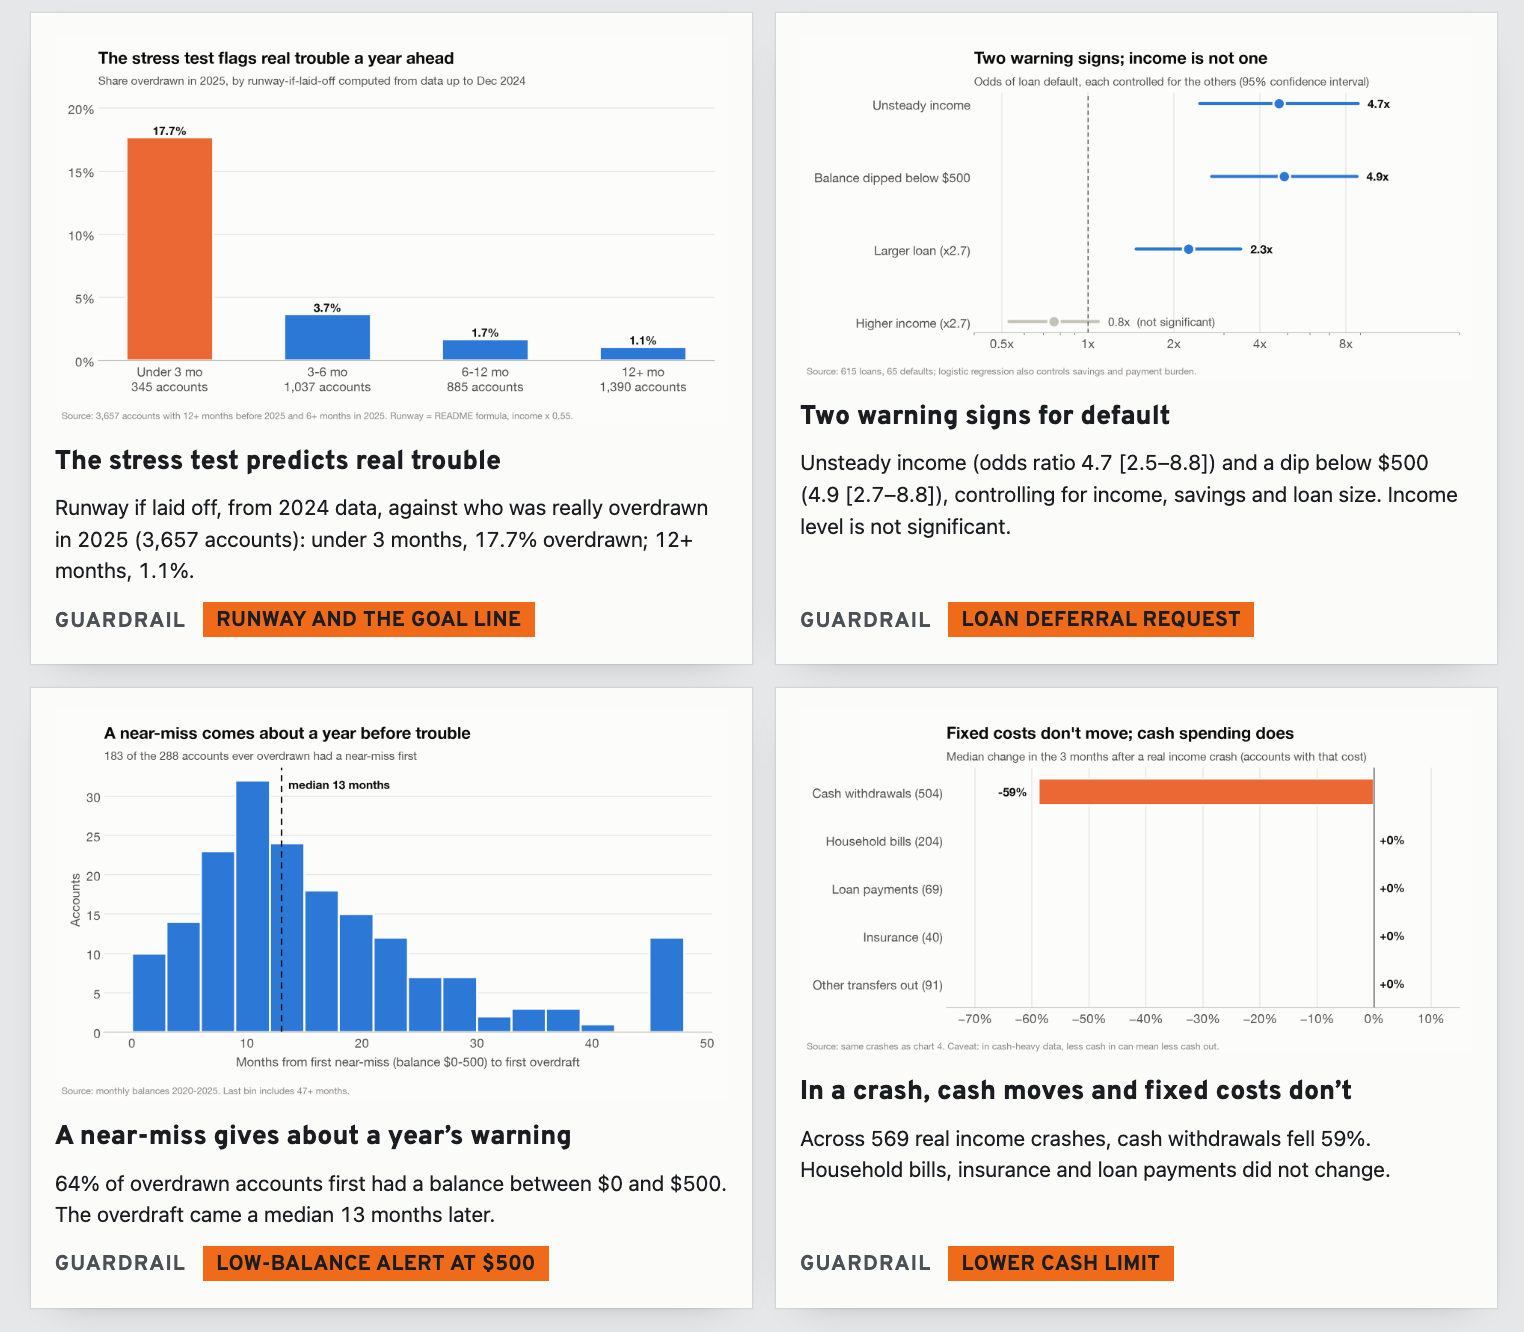
- Your worst day matters more than your average. Minimum account balance predicted future overdrafts with an AUC of 0.90, while income scored only 0.45.
- Consistency matters. Across 615 loans, unstable income and balances dipping below $500 were each associated with approximately five times the odds of default, even after controlling for income, savings, and loan size.
- Financial trouble gives warnings. Of accounts that became overdrawn, 64% had previously come within $500 of zero, a median of 13 months earlier.
- Not all spending is flexible. Across 569 income crashes, cash withdrawals decreased 59%, while household bills, insurance, and loan payments remained relatively unchanged.
These findings became the basis for our guardrails. Rather than giving everyone generic advice, we wanted to identify which vulnerabilities mattered for each customer.
How we built it
We started with the data rather than the application.
Using Python, pandas and statsmodels, we explored distributions and correlations before testing potential findings against actual outcomes, including 2025 overdrafts, loan defaults, and income crashes.
Our financial engine implements the judges' runway calculations in Python, with the logic mirrored in the browser for instant updates.
We used Google Gemini to interpret financial shocks, propose personalized plans, and operate our Guardian agent.
One architectural decision was especially important: AI proposes actions, but code verifies them. Gemini receives structured customer facts rather than unrestricted financial records. Every recommendation is checked against actual transactions, and the agent cannot move money or bypass customer approval.
The application uses FastAPI, React, Vite, custom CSS and SVG, and three.js for the landing page. We integrated PayPal Orders v2 in sandbox mode and ntfy for phone alerts.
Our analysis is documented in eda/eda.ipynb and findings/findings_walkthrough.ipynb.
Challenges we ran into
Finding patterns that weren't real. We initially discovered that 19% of first income crashes occurred in January. But when we counted every crash rather than only the first per account, the pattern disappeared. It taught us how easily an analysis decision can create a misleading conclusion.
Defining financial trouble. Overdrafts, loan defaults, and insufficient savings are related but different outcomes. We had to test each hypothesis against the appropriate measure.
Accomplishments that we're proud of
Our engine works across all 4,500 accounts and connects statistical findings directly to customer-specific interventions.
We also validated runway against real outcomes. Runway calculated from 2024 data predicted 2025 overdrafts with an AUC of 0.78. Customers with under three months of runway had a 17.7% overdraft rate, compared to 1.1% among those with at least twelve months.
We're particularly proud that our agent can take meaningful actions without controlling customer funds. Every guardrail requires approval, operates through restricted tools, and explains the evidence behind its recommendation.
What we learned
The biggest lesson was that the obvious variables weren't necessarily the most useful. Income seemed like a natural measure of financial security, but minimum balances and income stability revealed vulnerabilities that income alone couldn't explain.
We also learned that finding correlations is easy compared to establishing whether they're meaningful. Some apparent discoveries disappeared when we changed our methodology, while less obvious relationships became useful when tested against the right outcomes.
Our data also has limitations. Although re-dated to 2020–2025 and converted to CAD, it originally came from a Czech bank between 1993 and 1998. The patterns are interesting, but their exact magnitudes need validation against modern Canadian banking data.
What's next for Guardrails
We want Guardrails to move from a one-time assessment to continuous financial monitoring, identifying warning signs before customers experience financial trouble.
We'd also like to expand the available interventions, validate our findings on modern Canadian data, and eventually integrate Guardrails directly into a banking application.
Ultimately, we don't want AI making financial decisions for people until we meet with them. We want it to recognize problems early enough that people still have meaningful choices.
