Inspiration
The love of data science combined with the large database of information in baseball led to the creation of this hack
What it does
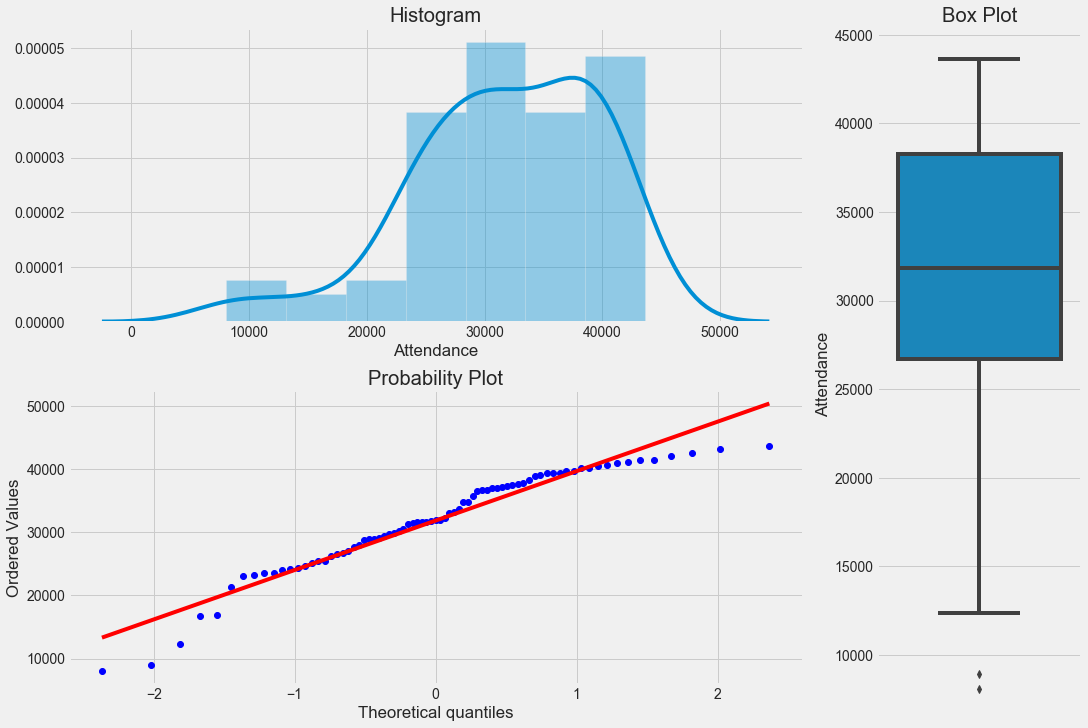
Through various machine learning methods we were able to determine the trends that led to an increased attendance at Atlanta Braves Baseball Games
How we built it
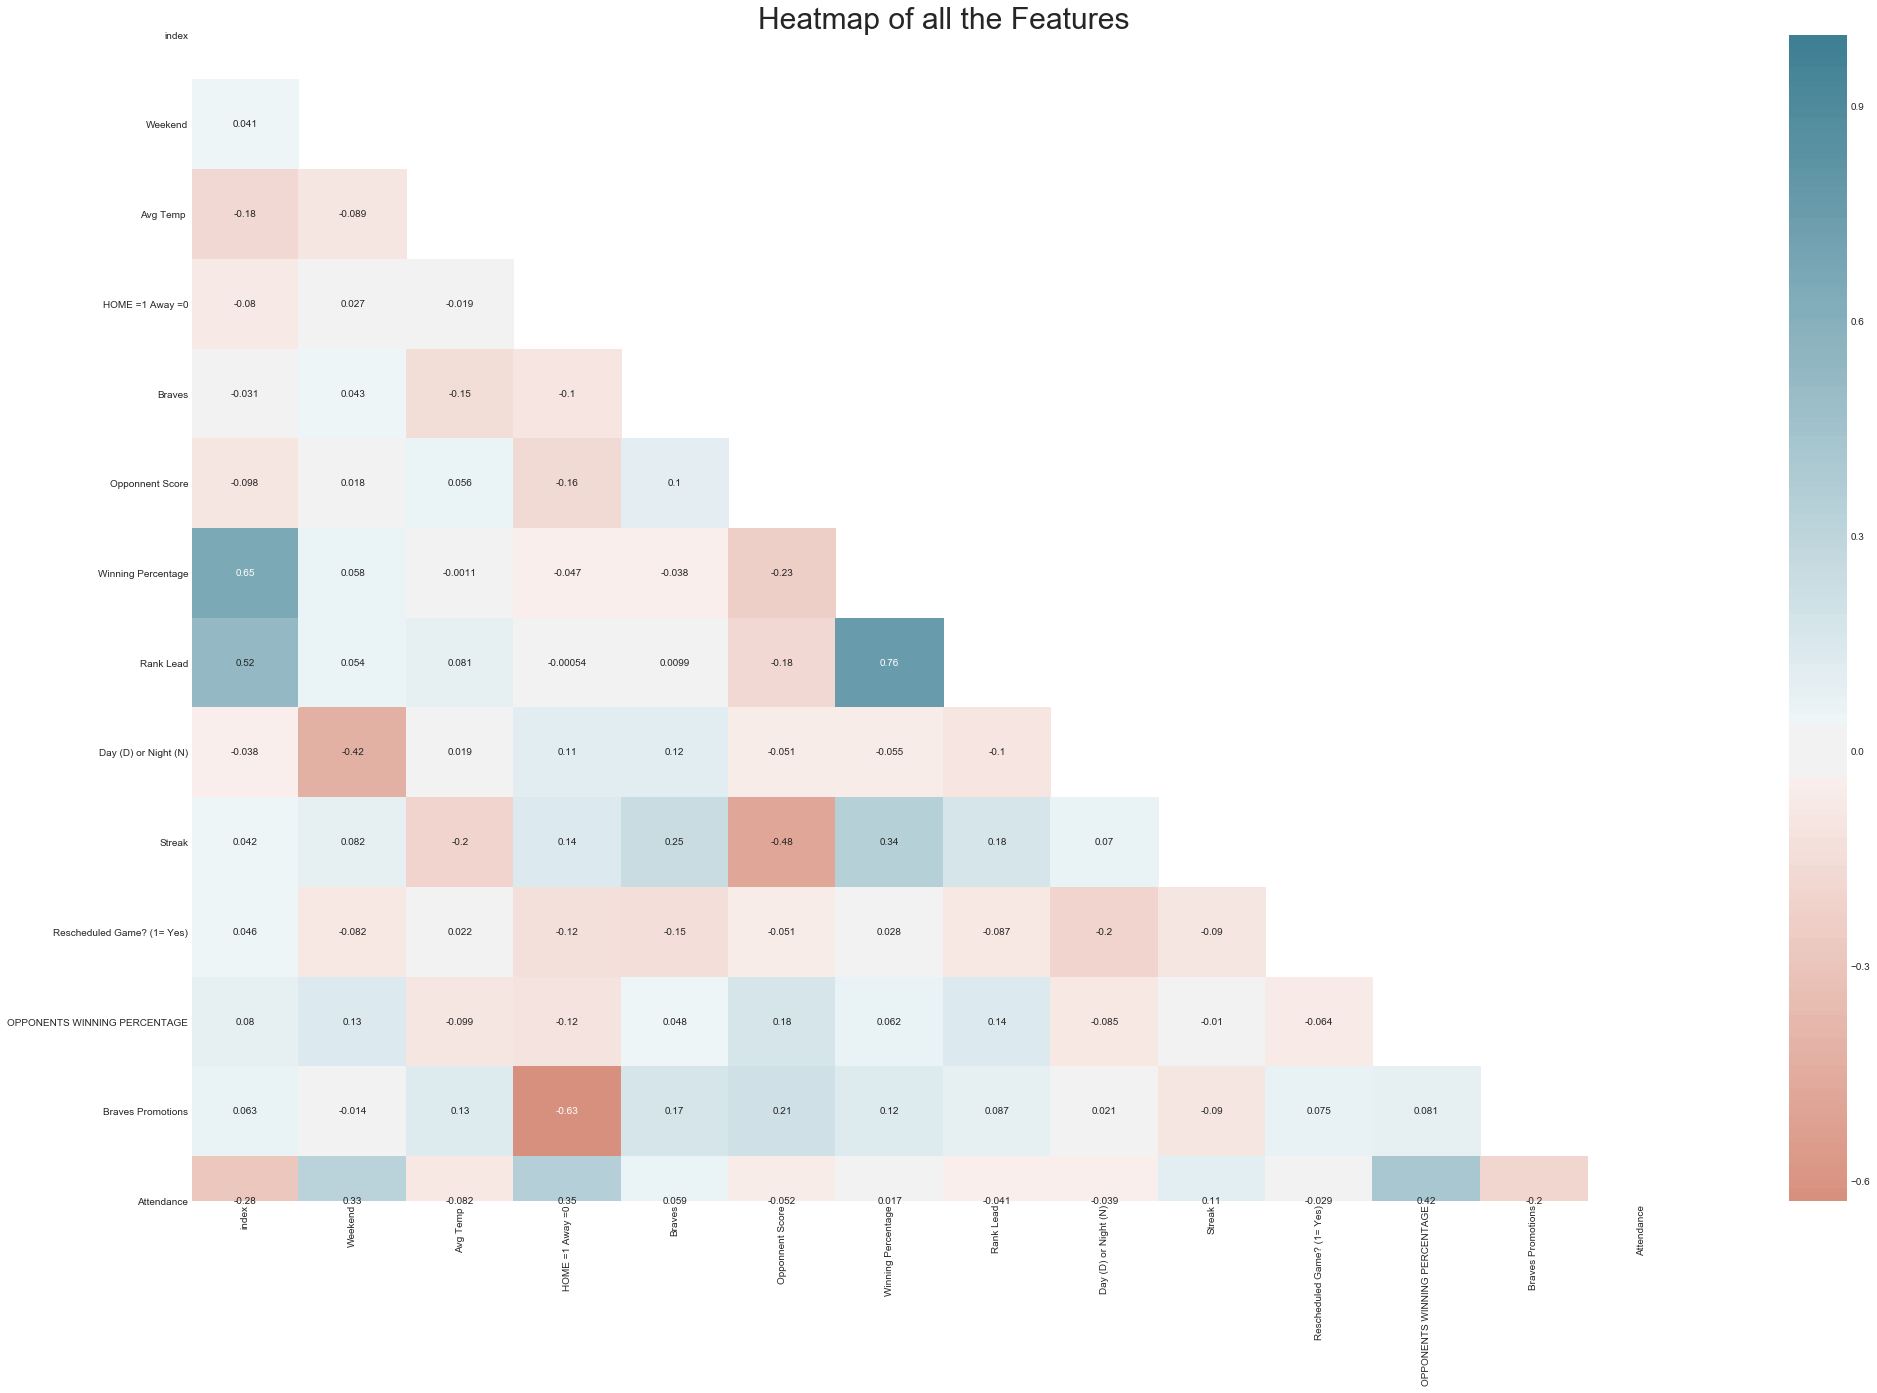
The model was built, by collecting and interpreting data obtained from the 2019 season of the Atlanta Braves, their promotions and their opponents. From this information, various machine learning methods were used to extract knowledge from the data.
Challenges we ran into
The 2019 season is a small data set of 81 home games. The opposing star pitchers do not pitch enough games against the Atlanta Braves for us to understand their effect on attendance. This is important for one of the factors attributed to higher attendance was the opposing winning percentage.
Accomplishments that we're proud of
Building this model that enables us to practice the knowledge we have learned in our graduate and undergraduate programs.
What we learned
Just do it!
What's next for GT Sports Inovation Hackathon
We need more data to train a more robust model.
Built With
- jupyter
- machine-learning
- numpy
- pandas
- requests
- sklearn

 Kim")


Log in or sign up for Devpost to join the conversation.