-
-

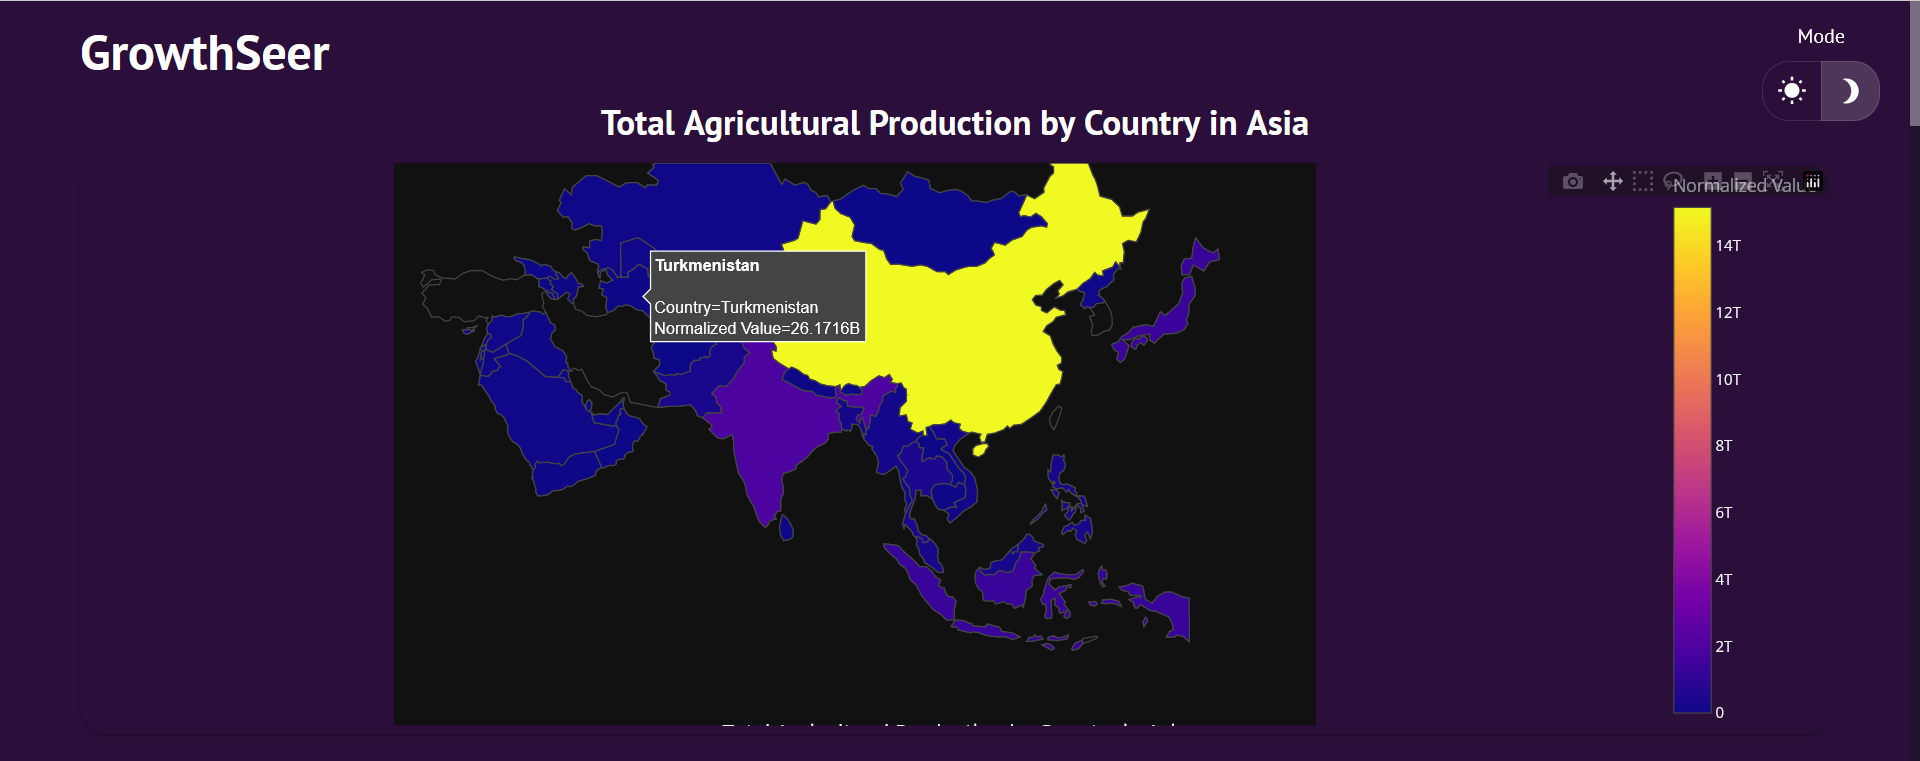
Total Agriculutre production mapper
-
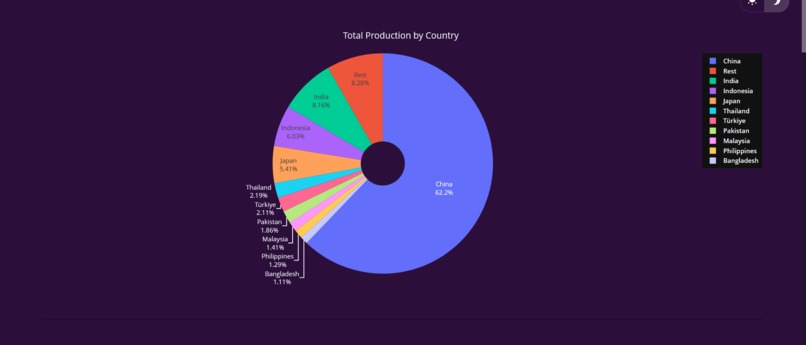
Production by Country Chart
-

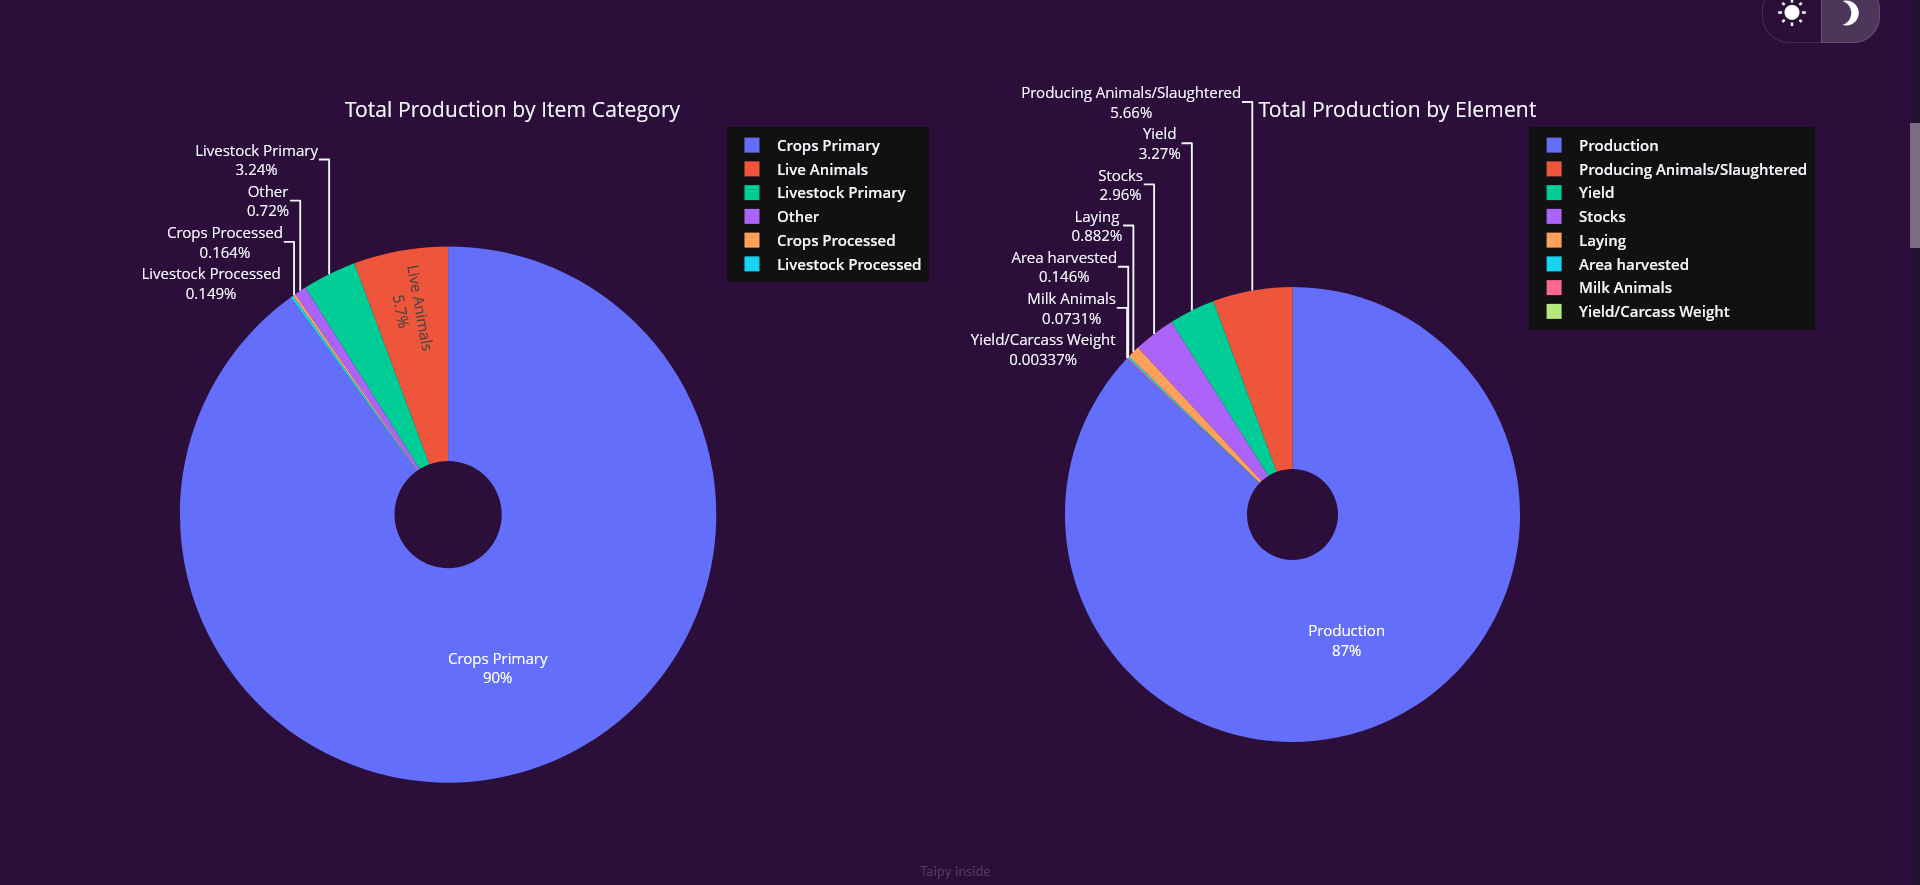
Production by Item Category and Agriculture Process charts
-
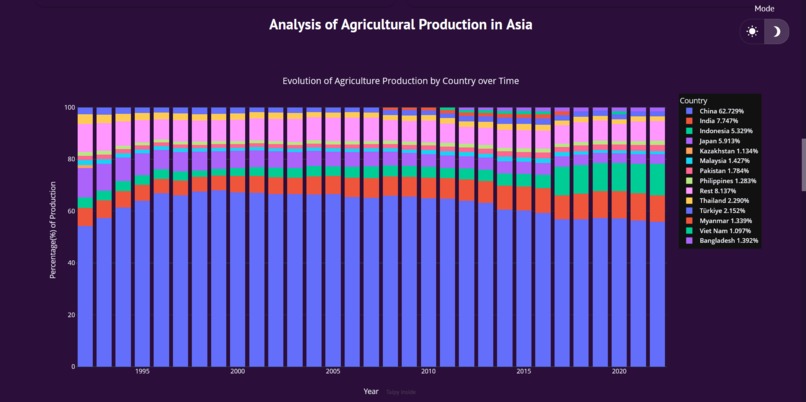
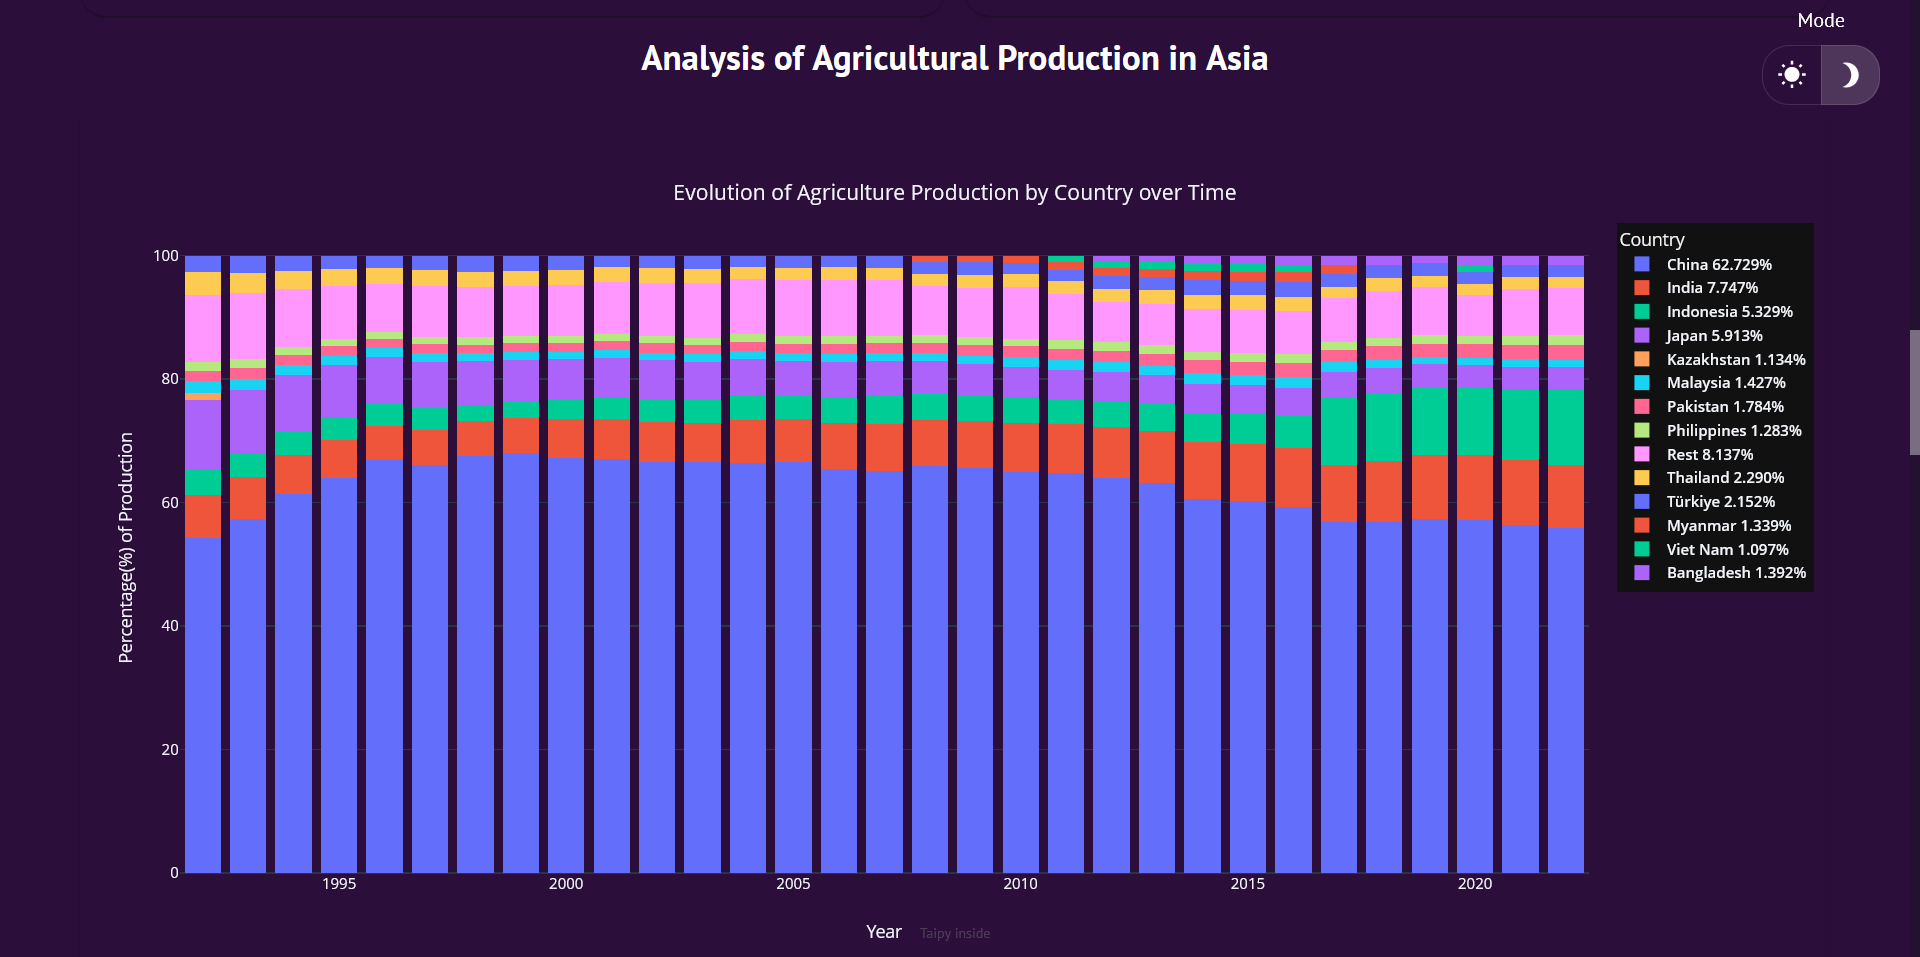
Production Analysis by Country over time
-
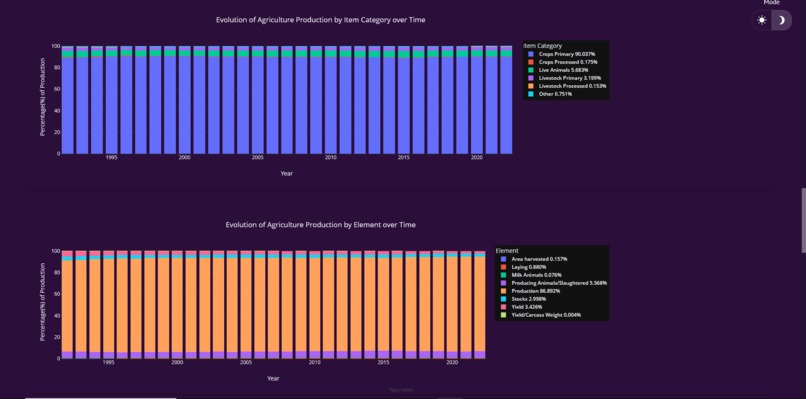
Production Analysis by Item Category and Agriculure Process over time
-
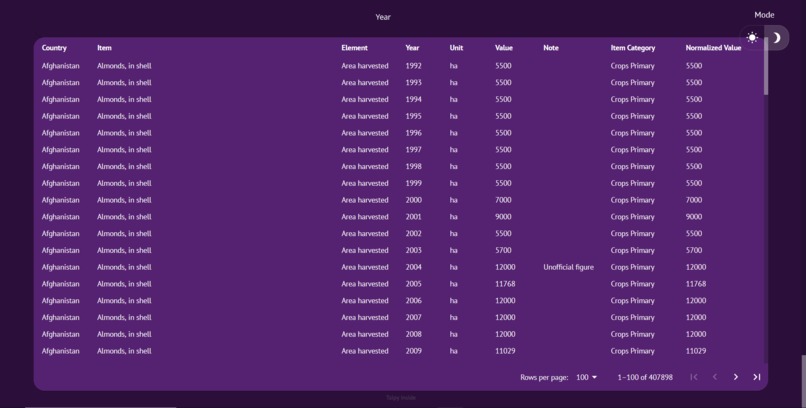
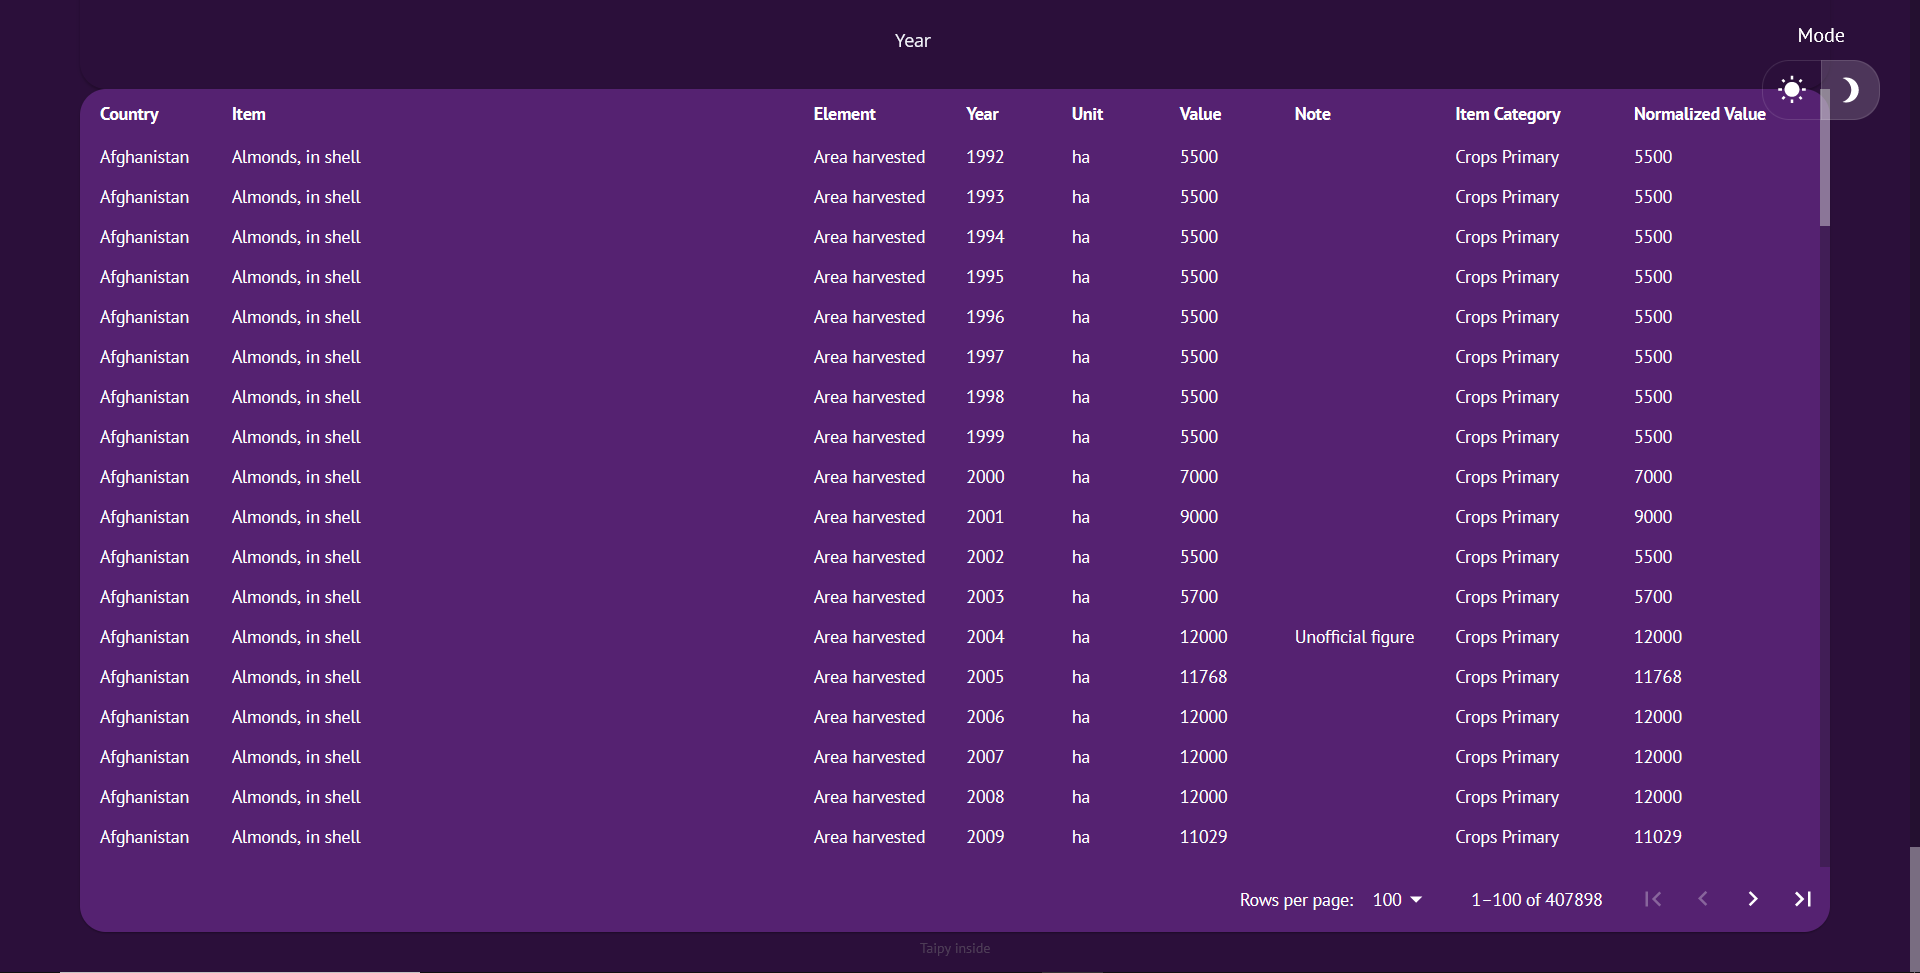
Full Agriculture production table
-

GrowthSeer logo


Inspiration
Climate change is having a significant impact on crop yields globally. In Asia, rising temperatures, changing rainfall patterns, and extreme weather events are negatively affecting agricultural productivity. As data enthusiasts interested in climate change impacts, we wanted to analyze crop yield trends in Asia and build data-driven tools to understand crop vulnerabilities to climate change. The motivation behind this project was to leverage data analytics to generate actionable insights for building climate resilience in agriculture.
What it does
- GrowthSeer leverages data analytics and visualization to provide insights into agricultural yields over time and space.
- GrowthSeer also provides a comprehensive visualization and analysis toolkit for optimizing crop and livestock production.
How we built it
We built a crop yield data dashboard using Taipy and Python. The main components included
- Data Collection: We gathered historical crop yield data and climate data (temperature) for different countries in Asia.
- Data Processing: The data was cleaned, merged and transformed into structured formats suitable for analysis.
Dashboard: An interactive dashboard was built with Plotly-express to visualize crop yield trends over time and compare yields across countries.
Challenges we ran into
The main challenges faced were
- Data Availability: Sourcing reliable long-term crop yield data for all the Asian countries.
- Data Integration: Aggregating crop yield data was tricky and required grouping Item Categories, summing values and rounding percentages.
- Dashboard Interactivity: Making the dashboard intuitive with interactive filters was time-consuming.
Accomplishments that we're proud of
- Interactive Visuals: The Plotly dashboards provide powerful data insights through charts, graphs an maps.
- Climate Impact Analysis: Quantified the effects of climate variables like temperature and precipitation on crop productivity.
What we learned
- Taipy for data Informatics: Taipy provided a scalable platform for analyzing large climate and agriculture datasets.
- Dashboard Development: Learned interactive visualization principles and tools like Taipy and Plotly.
- Domain Knowledge: Gained in-depth understanding of climate change impacts on Asian agriculture.
What's next for GrowthSeer:
- Automated Alerts: Set up a system that sends alerts to farmers based on weather changes, market demands, or health alerts for crops and livestock.
- Community Module: A feature that allows farmers to share insights, ask questions, and collaborate on best practices
- Cross-referencing:Incorporate more datasets like soil data for finer resolution insights.
- Expand scope to cover other continents.
- Deploy the dashboards and predictor as a web application.
GrowthSeer will help use technology to revolutionize traditional industries and foster community while addressing global food security challenges.
Built With
- python
- taipy


Log in or sign up for Devpost to join the conversation.