-
-
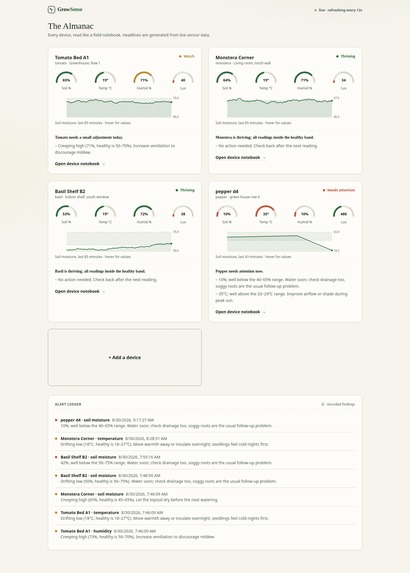
dashboard
-
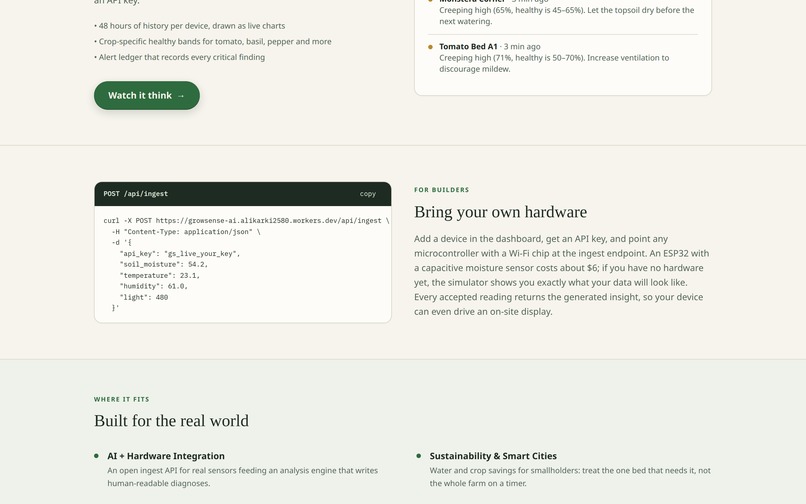
api
-
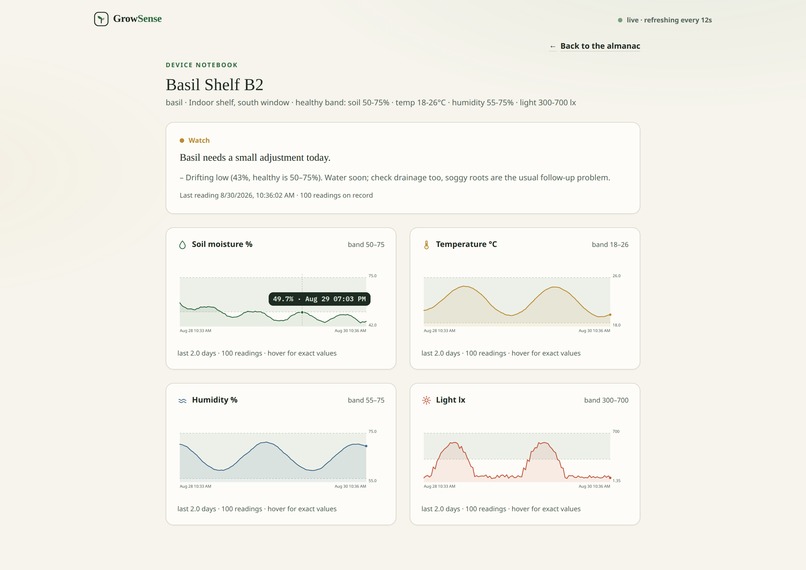
notebook hover
-
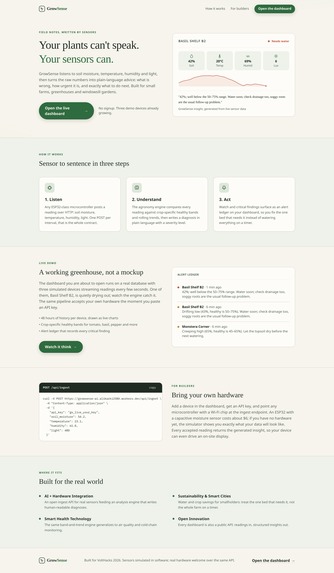
landing
-
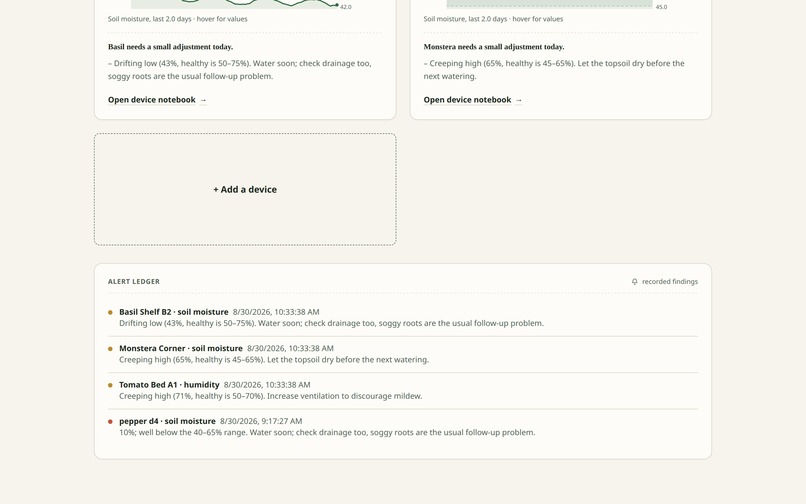
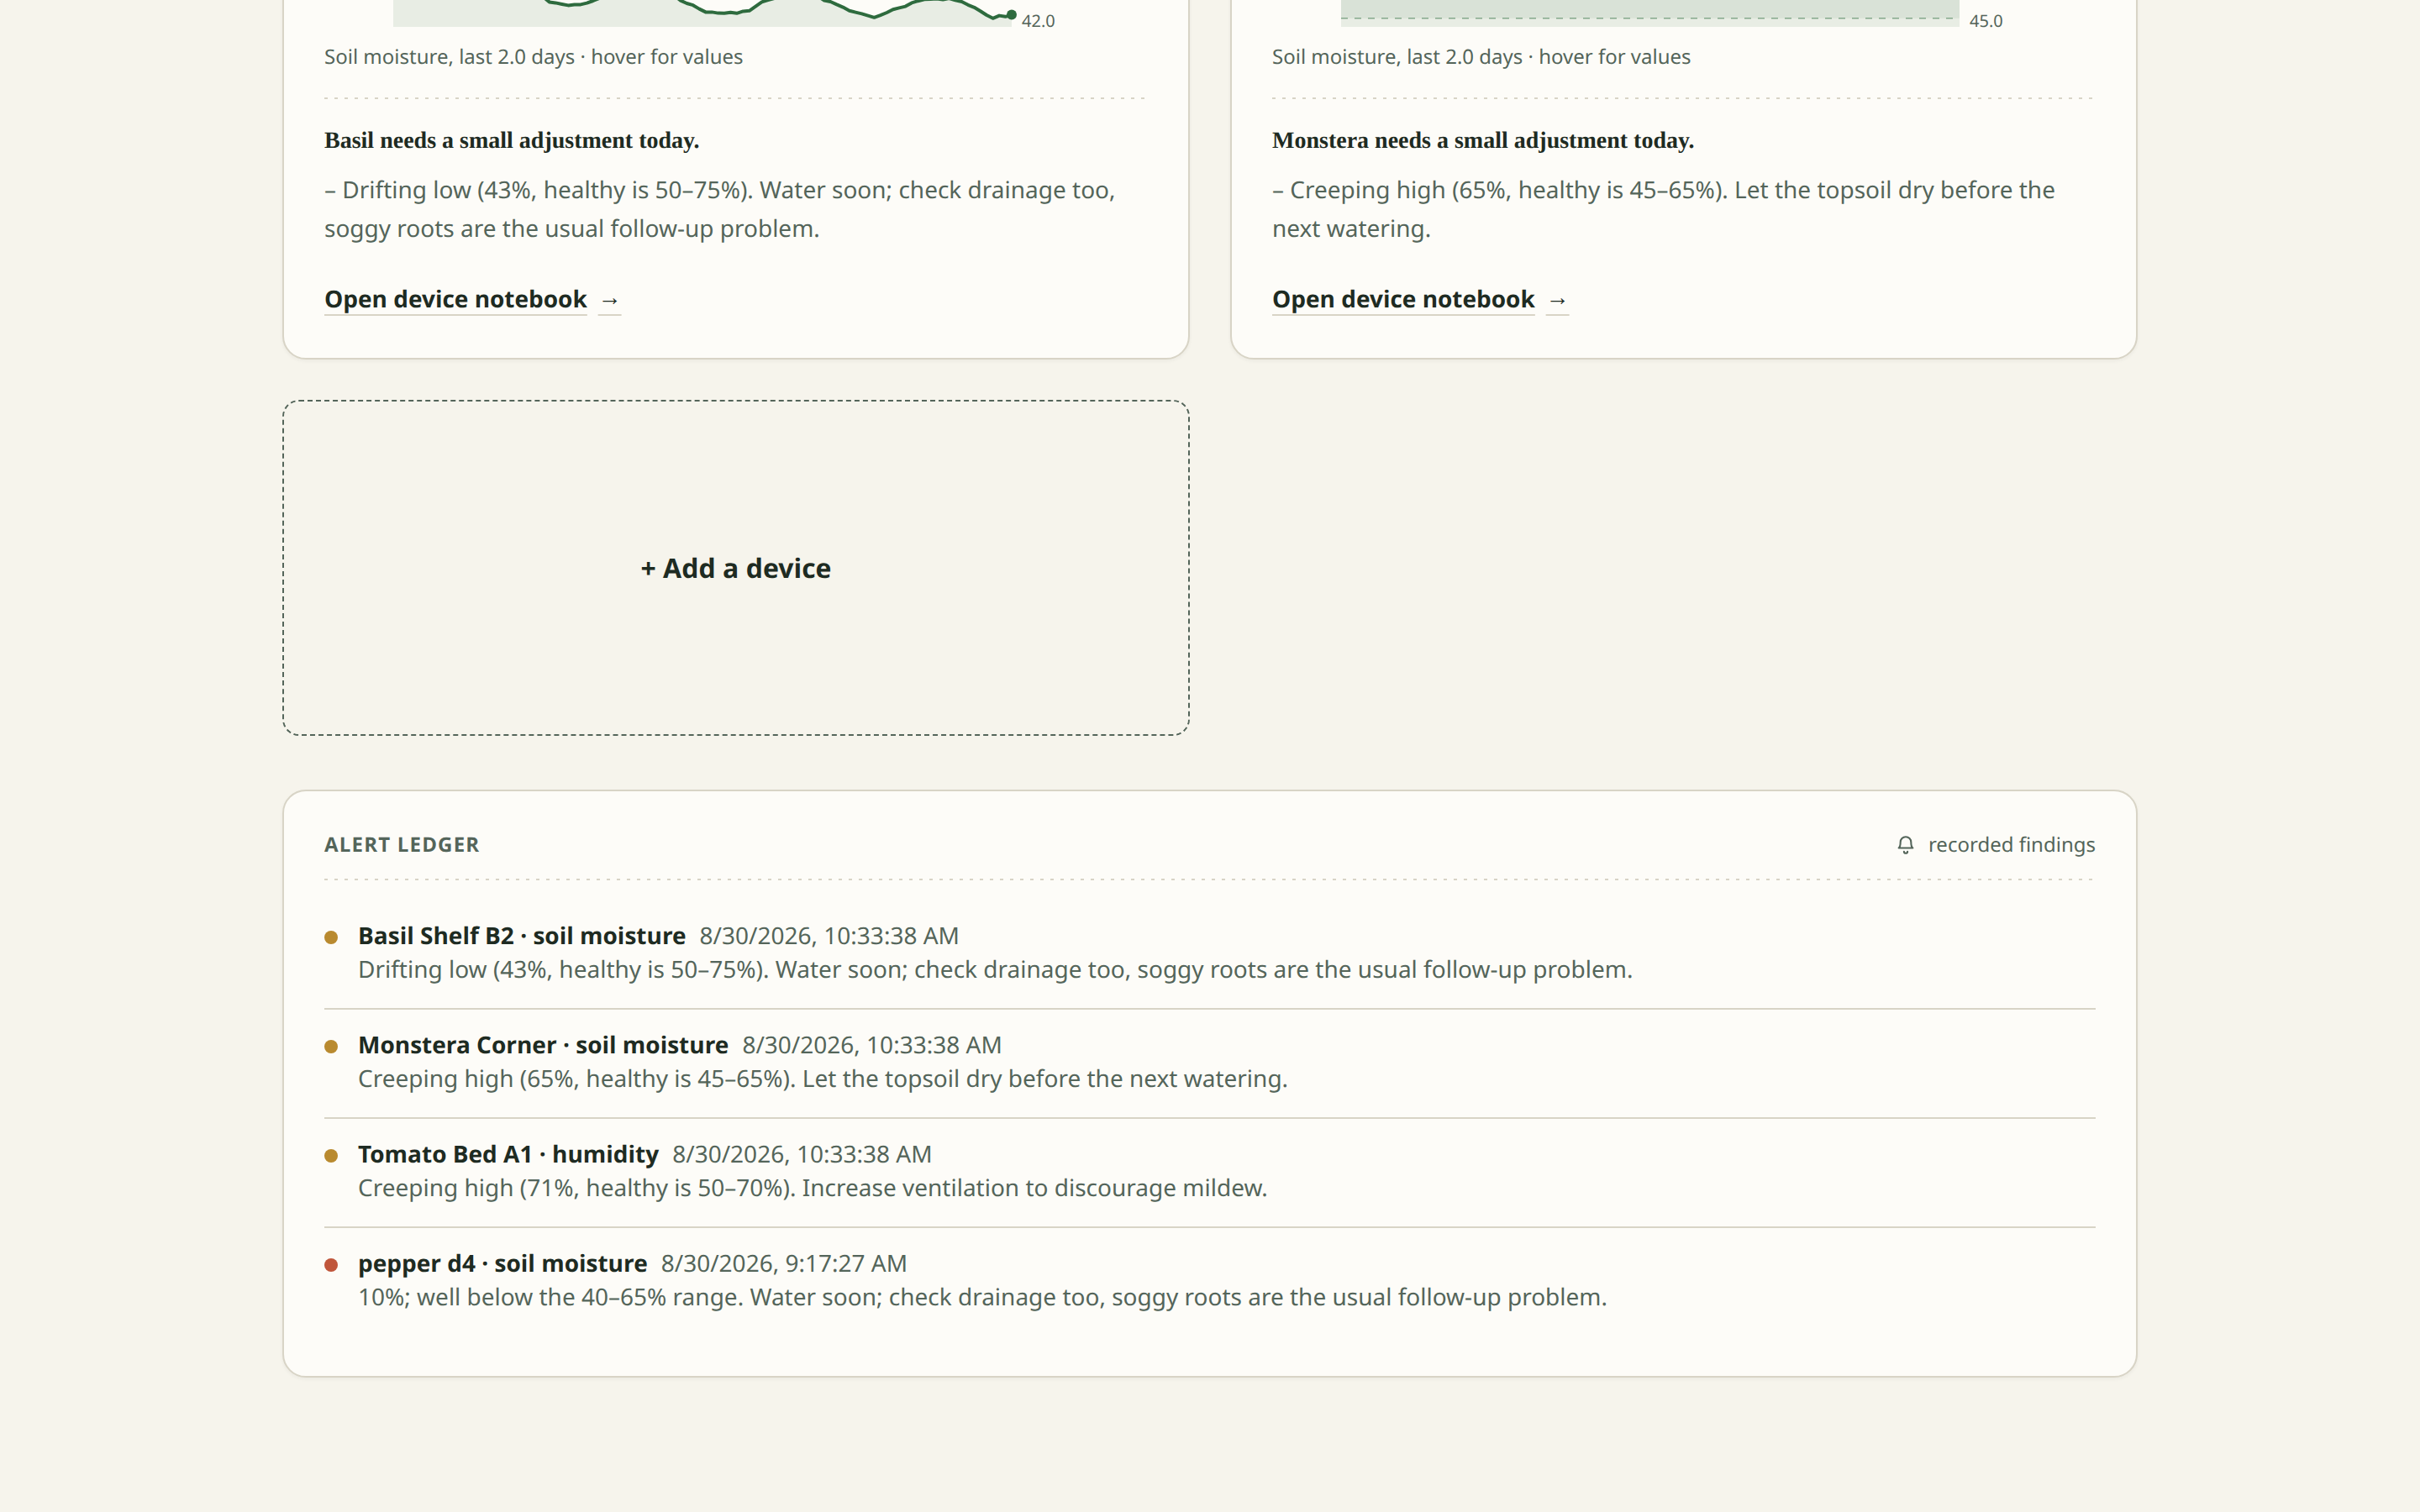
alert ledger
Inspiration
Small farmers and home growers lose plants to problems nobody notices until it is too late: soil slowly drying past the recovery point, a heat spike during the afternoon, humidity creeping into mildew territory. Commercial monitoring exists, but it is priced for industrial greenhouses and mostly shows you graphs — leaving the diagnosis work to you. We wanted the opposite: a system that reads the numbers for you and tells you, in one sentence, what to do next.
What it does
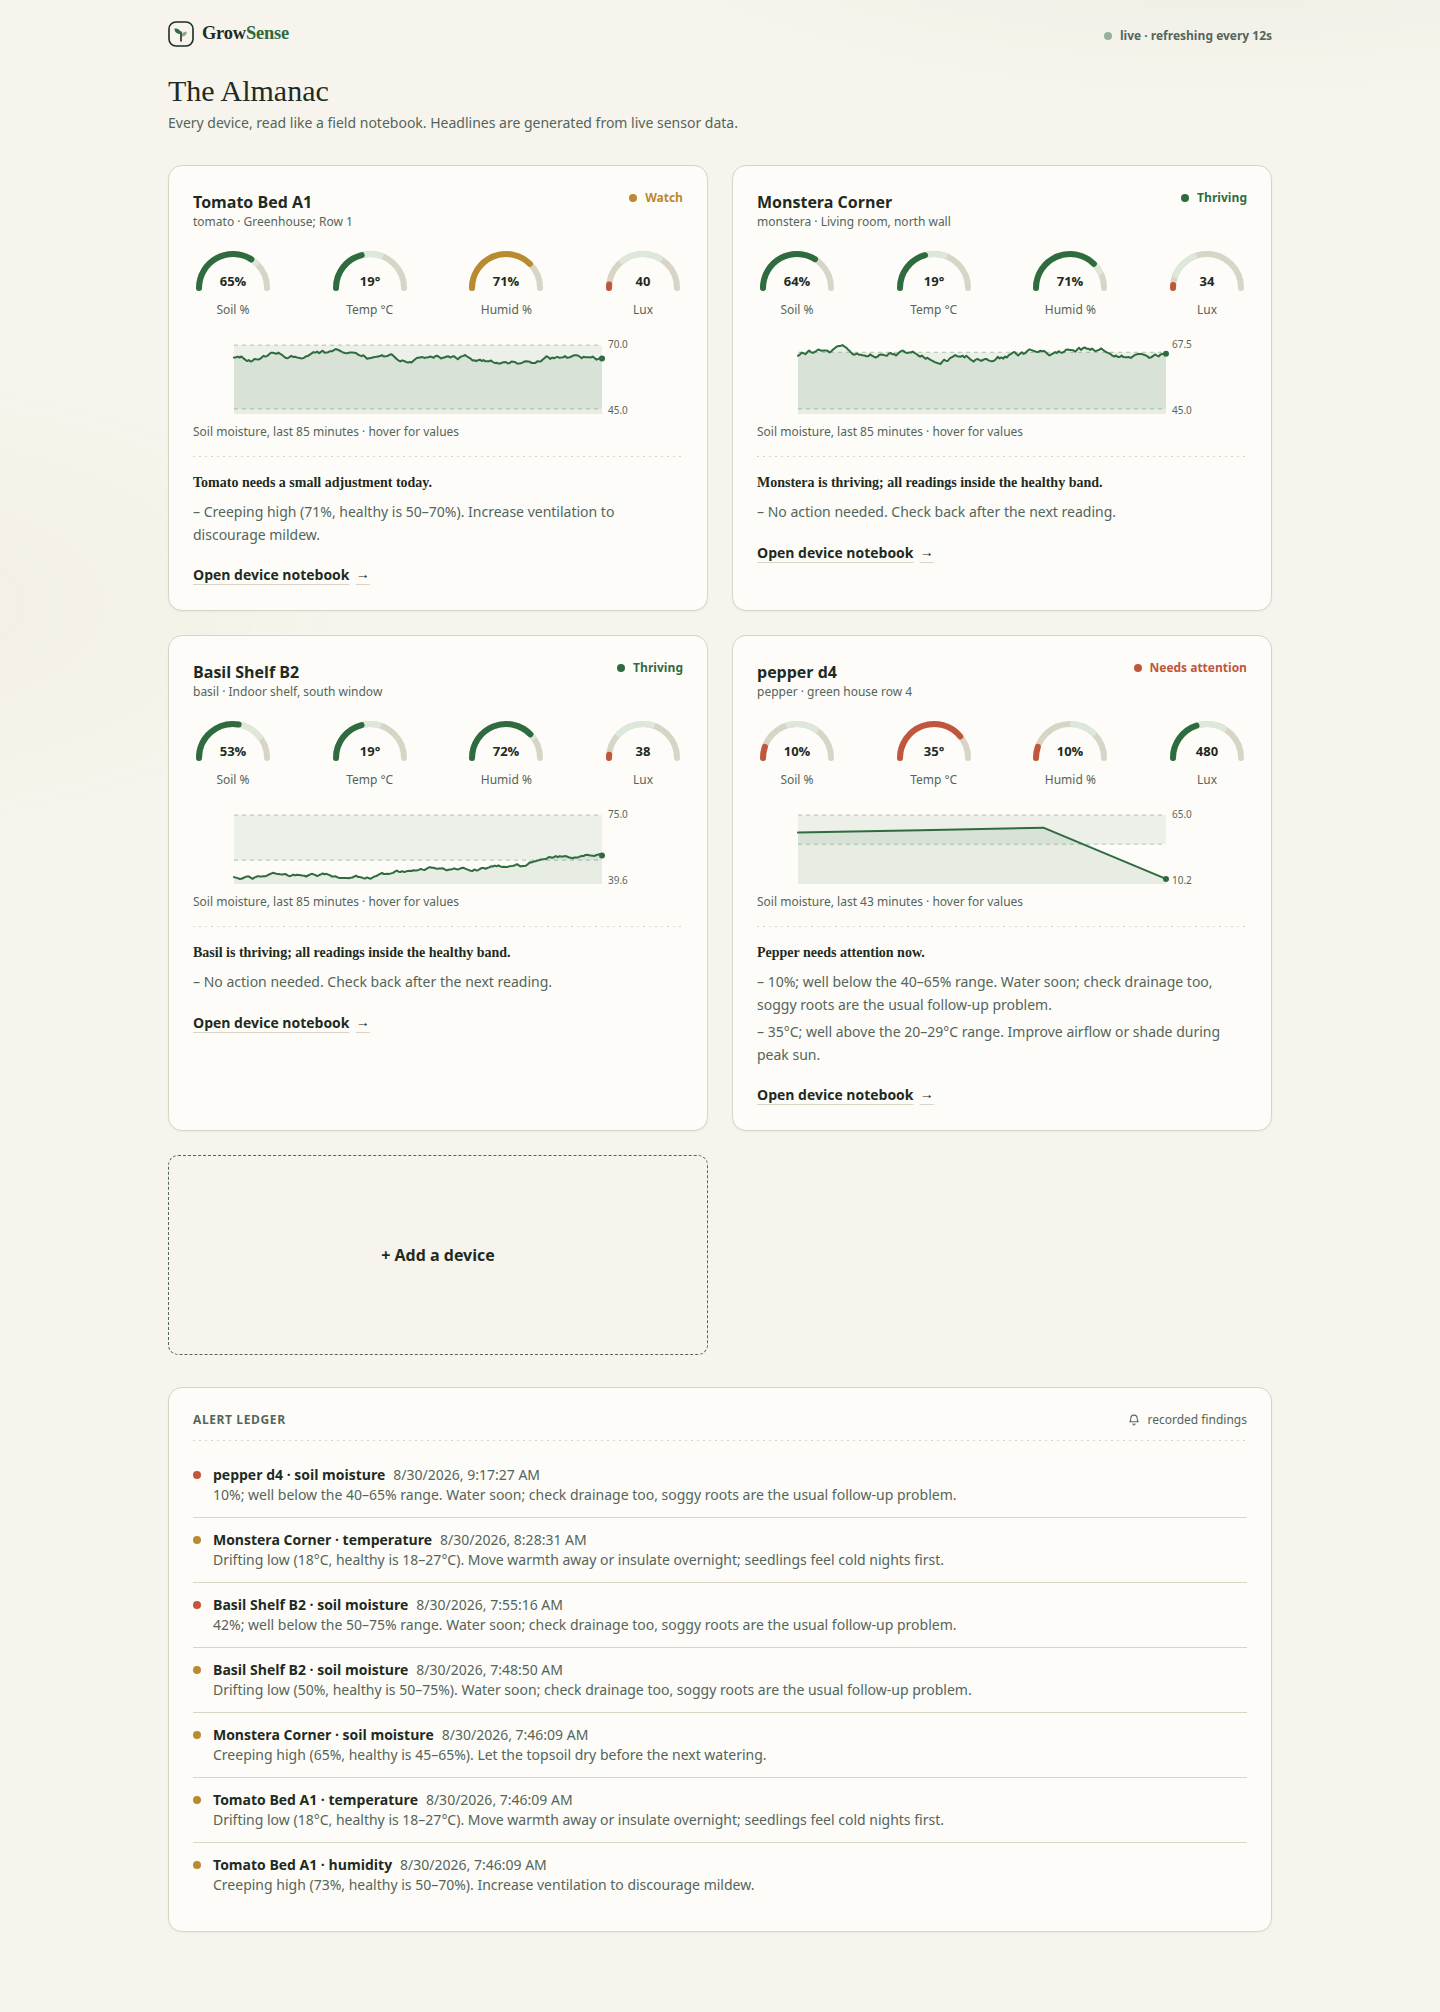
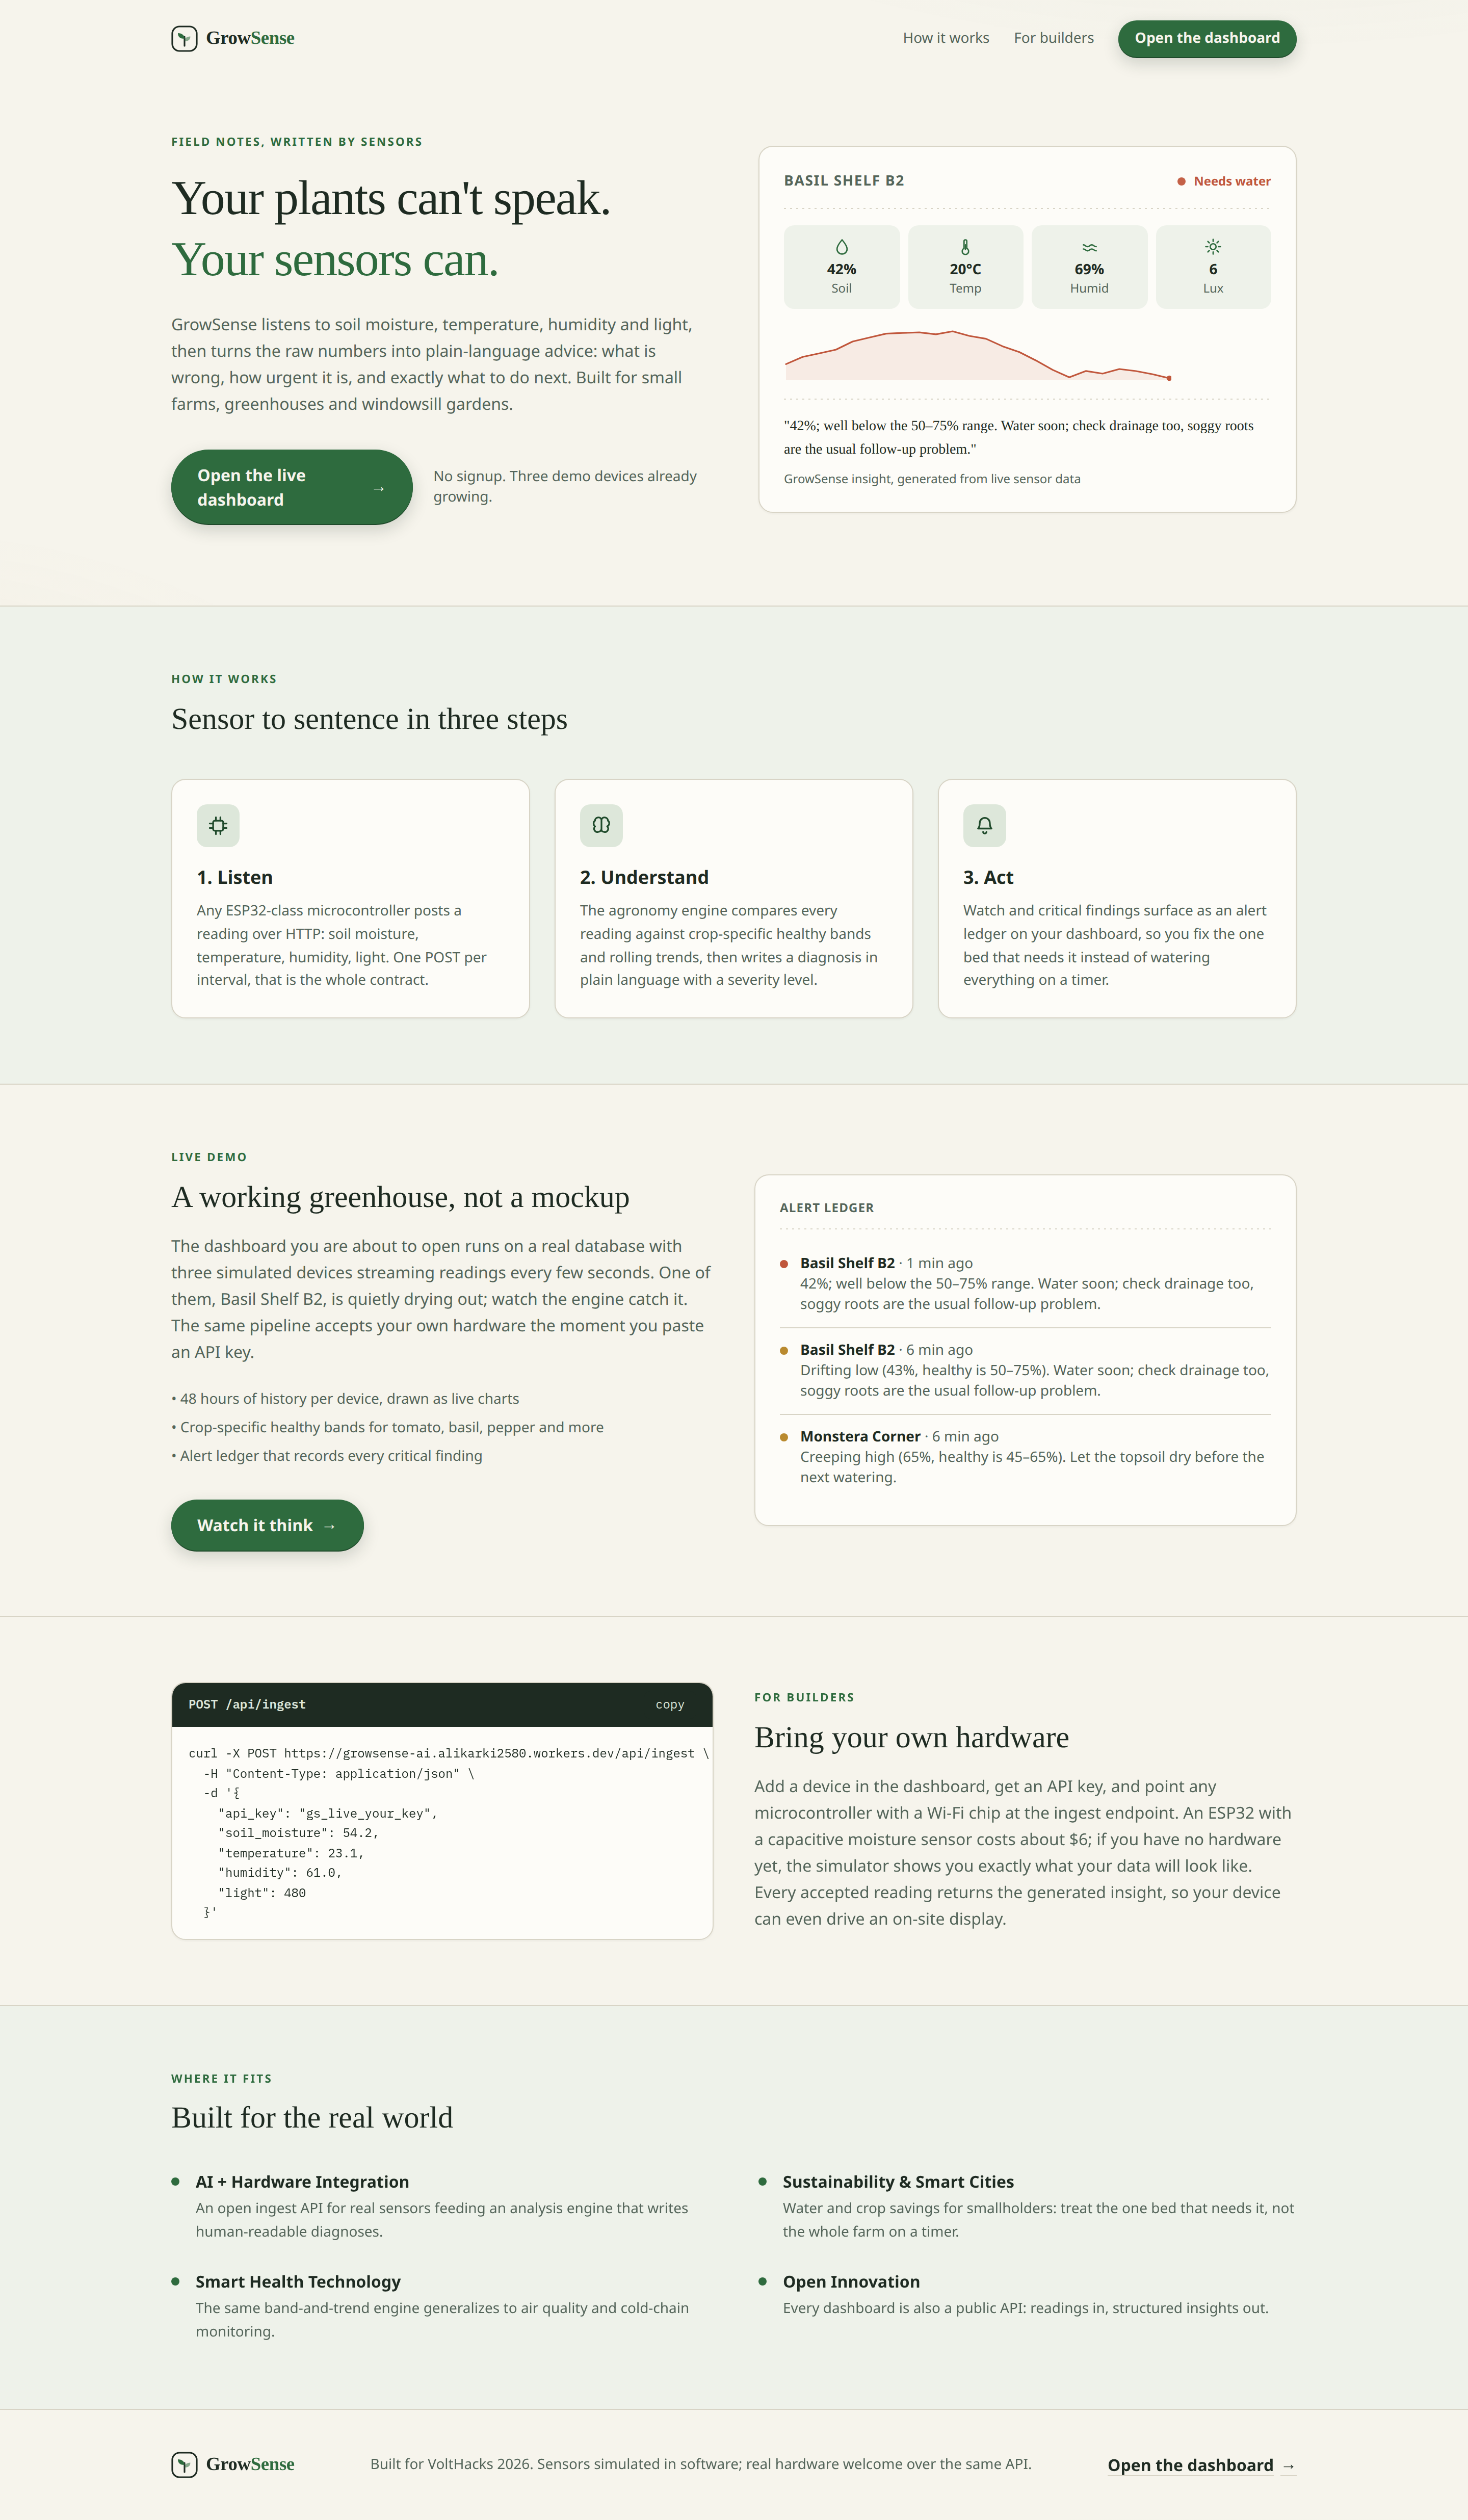
GrowSense listens to four environmental signals — soil moisture, temperature, humidity, and light — from any device that can send an HTTP request. Every reading is checked against crop-specific healthy bands (basil, tomato, pepper, lettuce, and monstera each have their own), rolled into a trend, and turned into a plain-language insight with a severity level:
"Basil needs attention now. Soil moisture fell 14 points over the last 2 hours; the soil is drying faster than usual. 40% — well below the 50–75% range. Water soon; check drainage too, soggy roots are the usual follow-up problem."
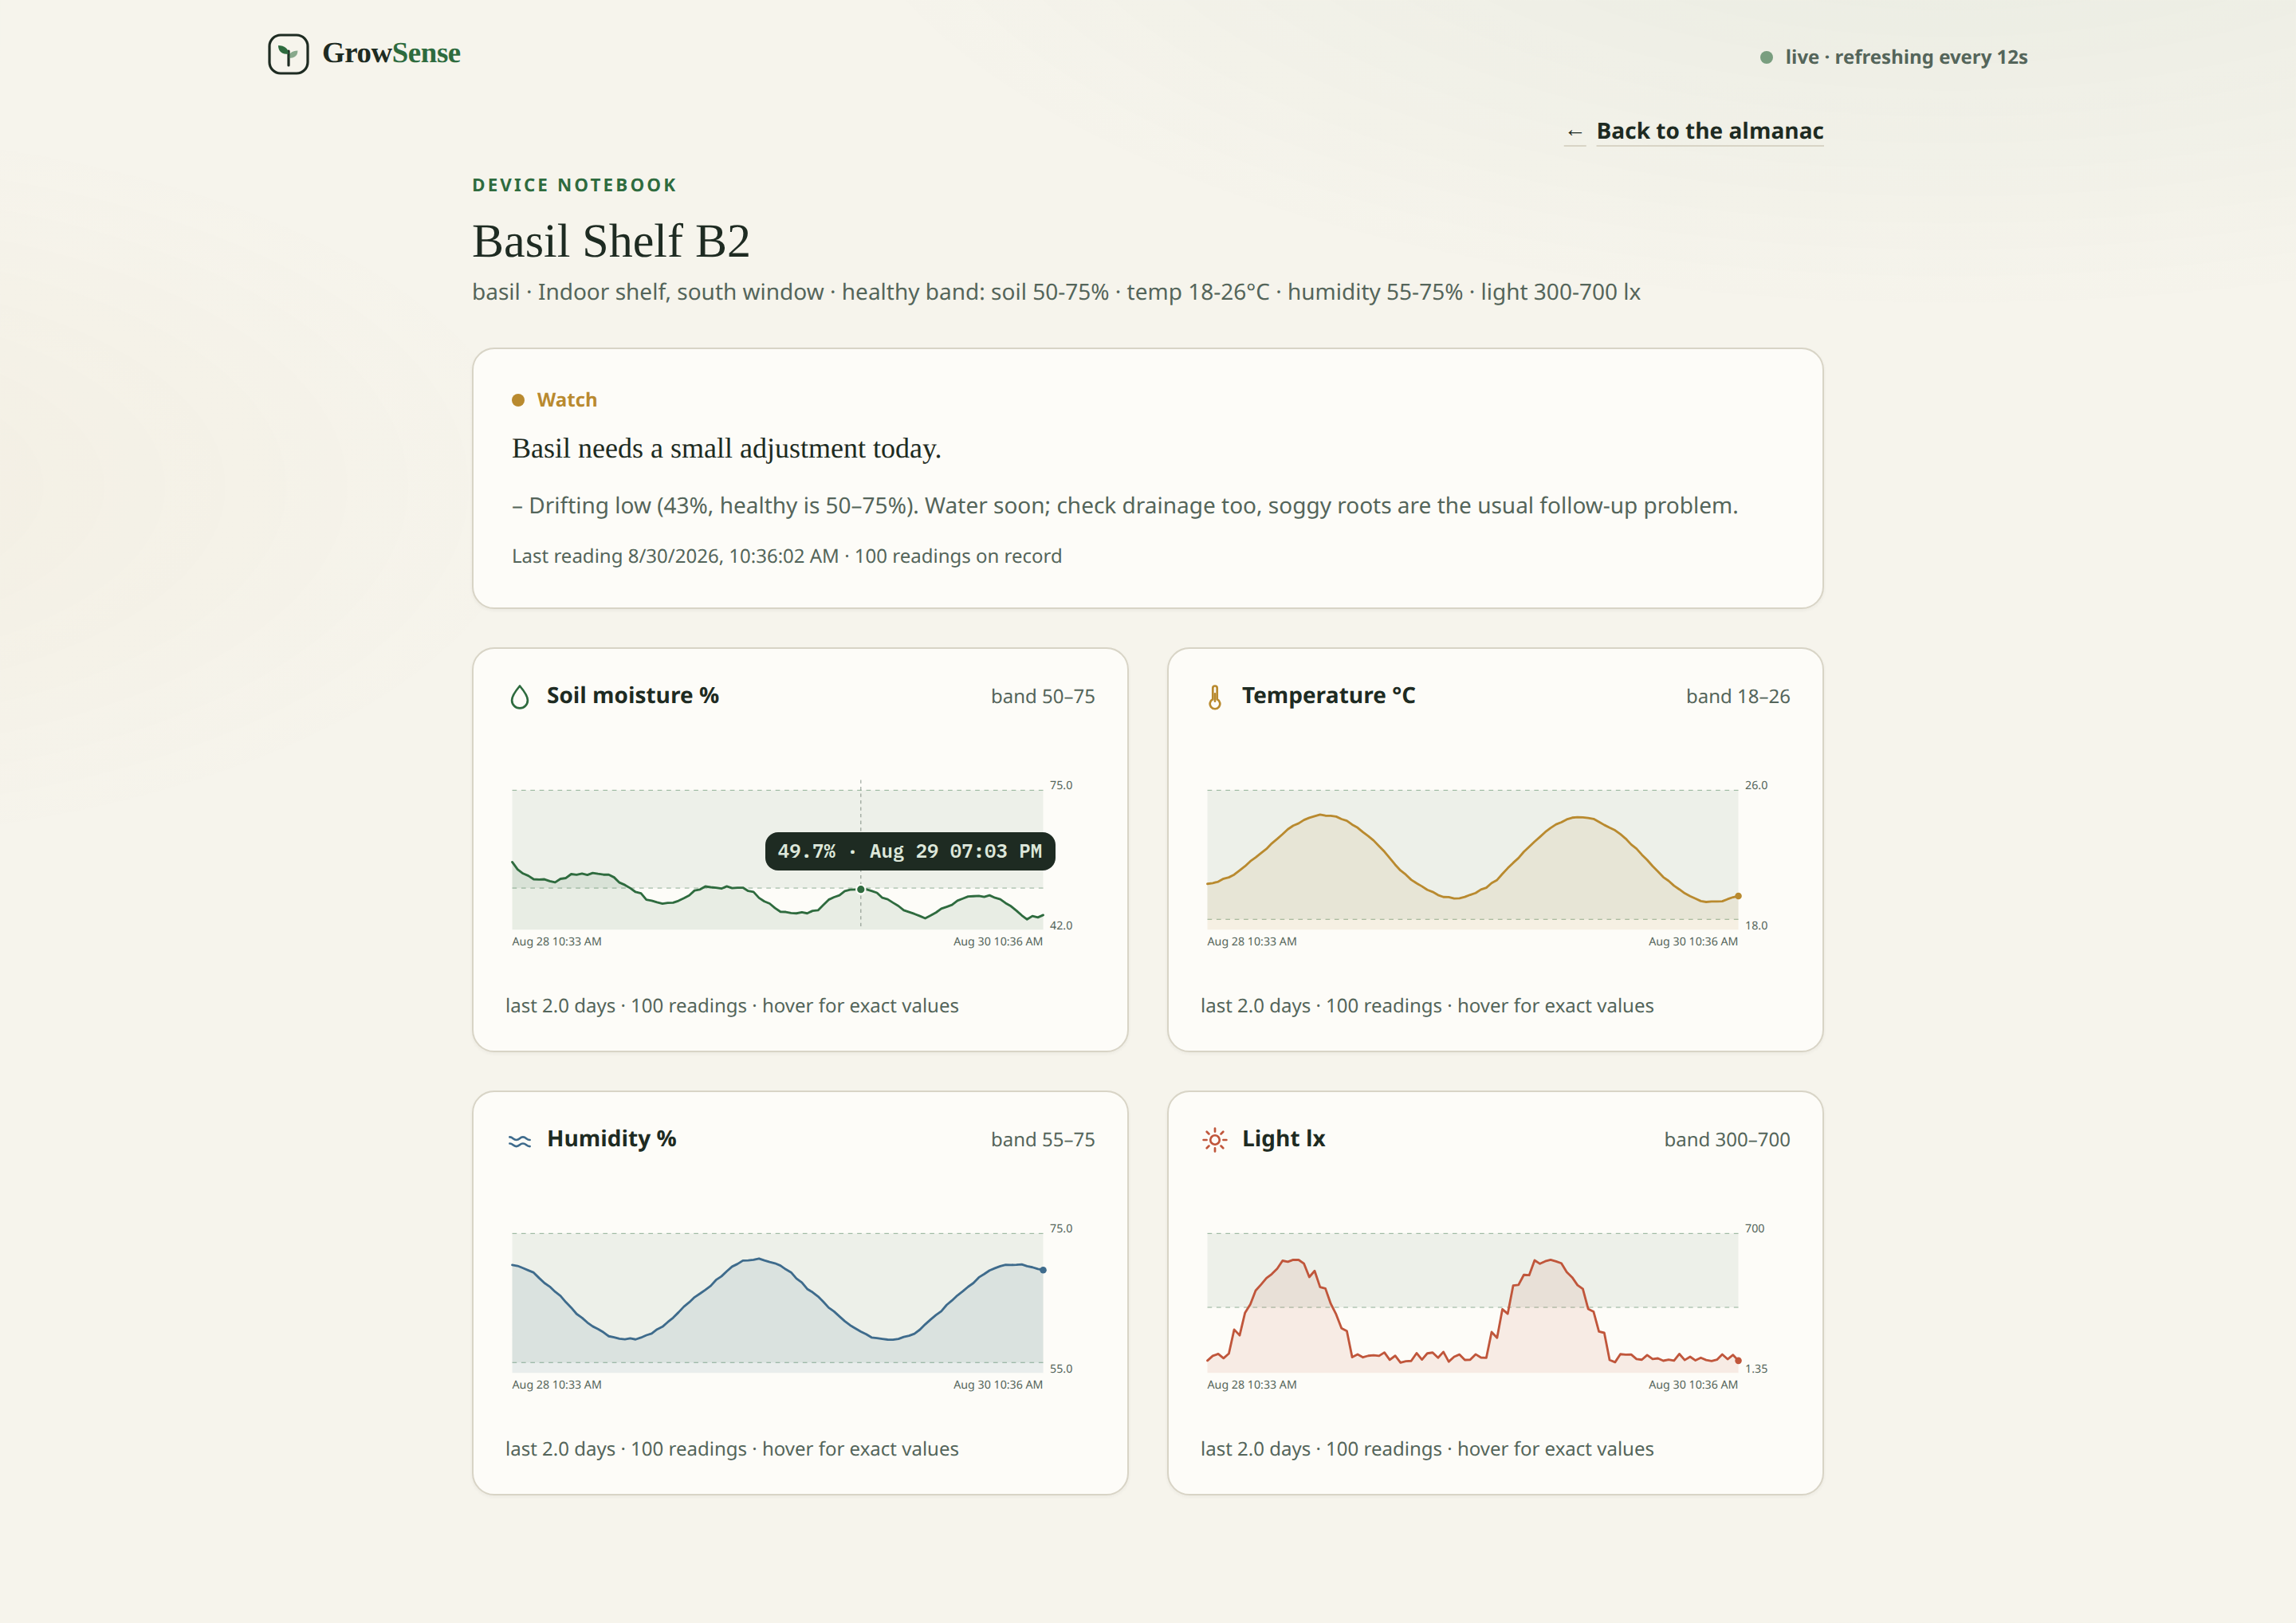
Findings surface in an almanac-style dashboard: live gauges per device, interactive charts with the healthy band shaded in and a hover crosshair showing exact values and timestamps, device notebooks with full history, and an alert ledger that records every watch and critical finding with deduplication.
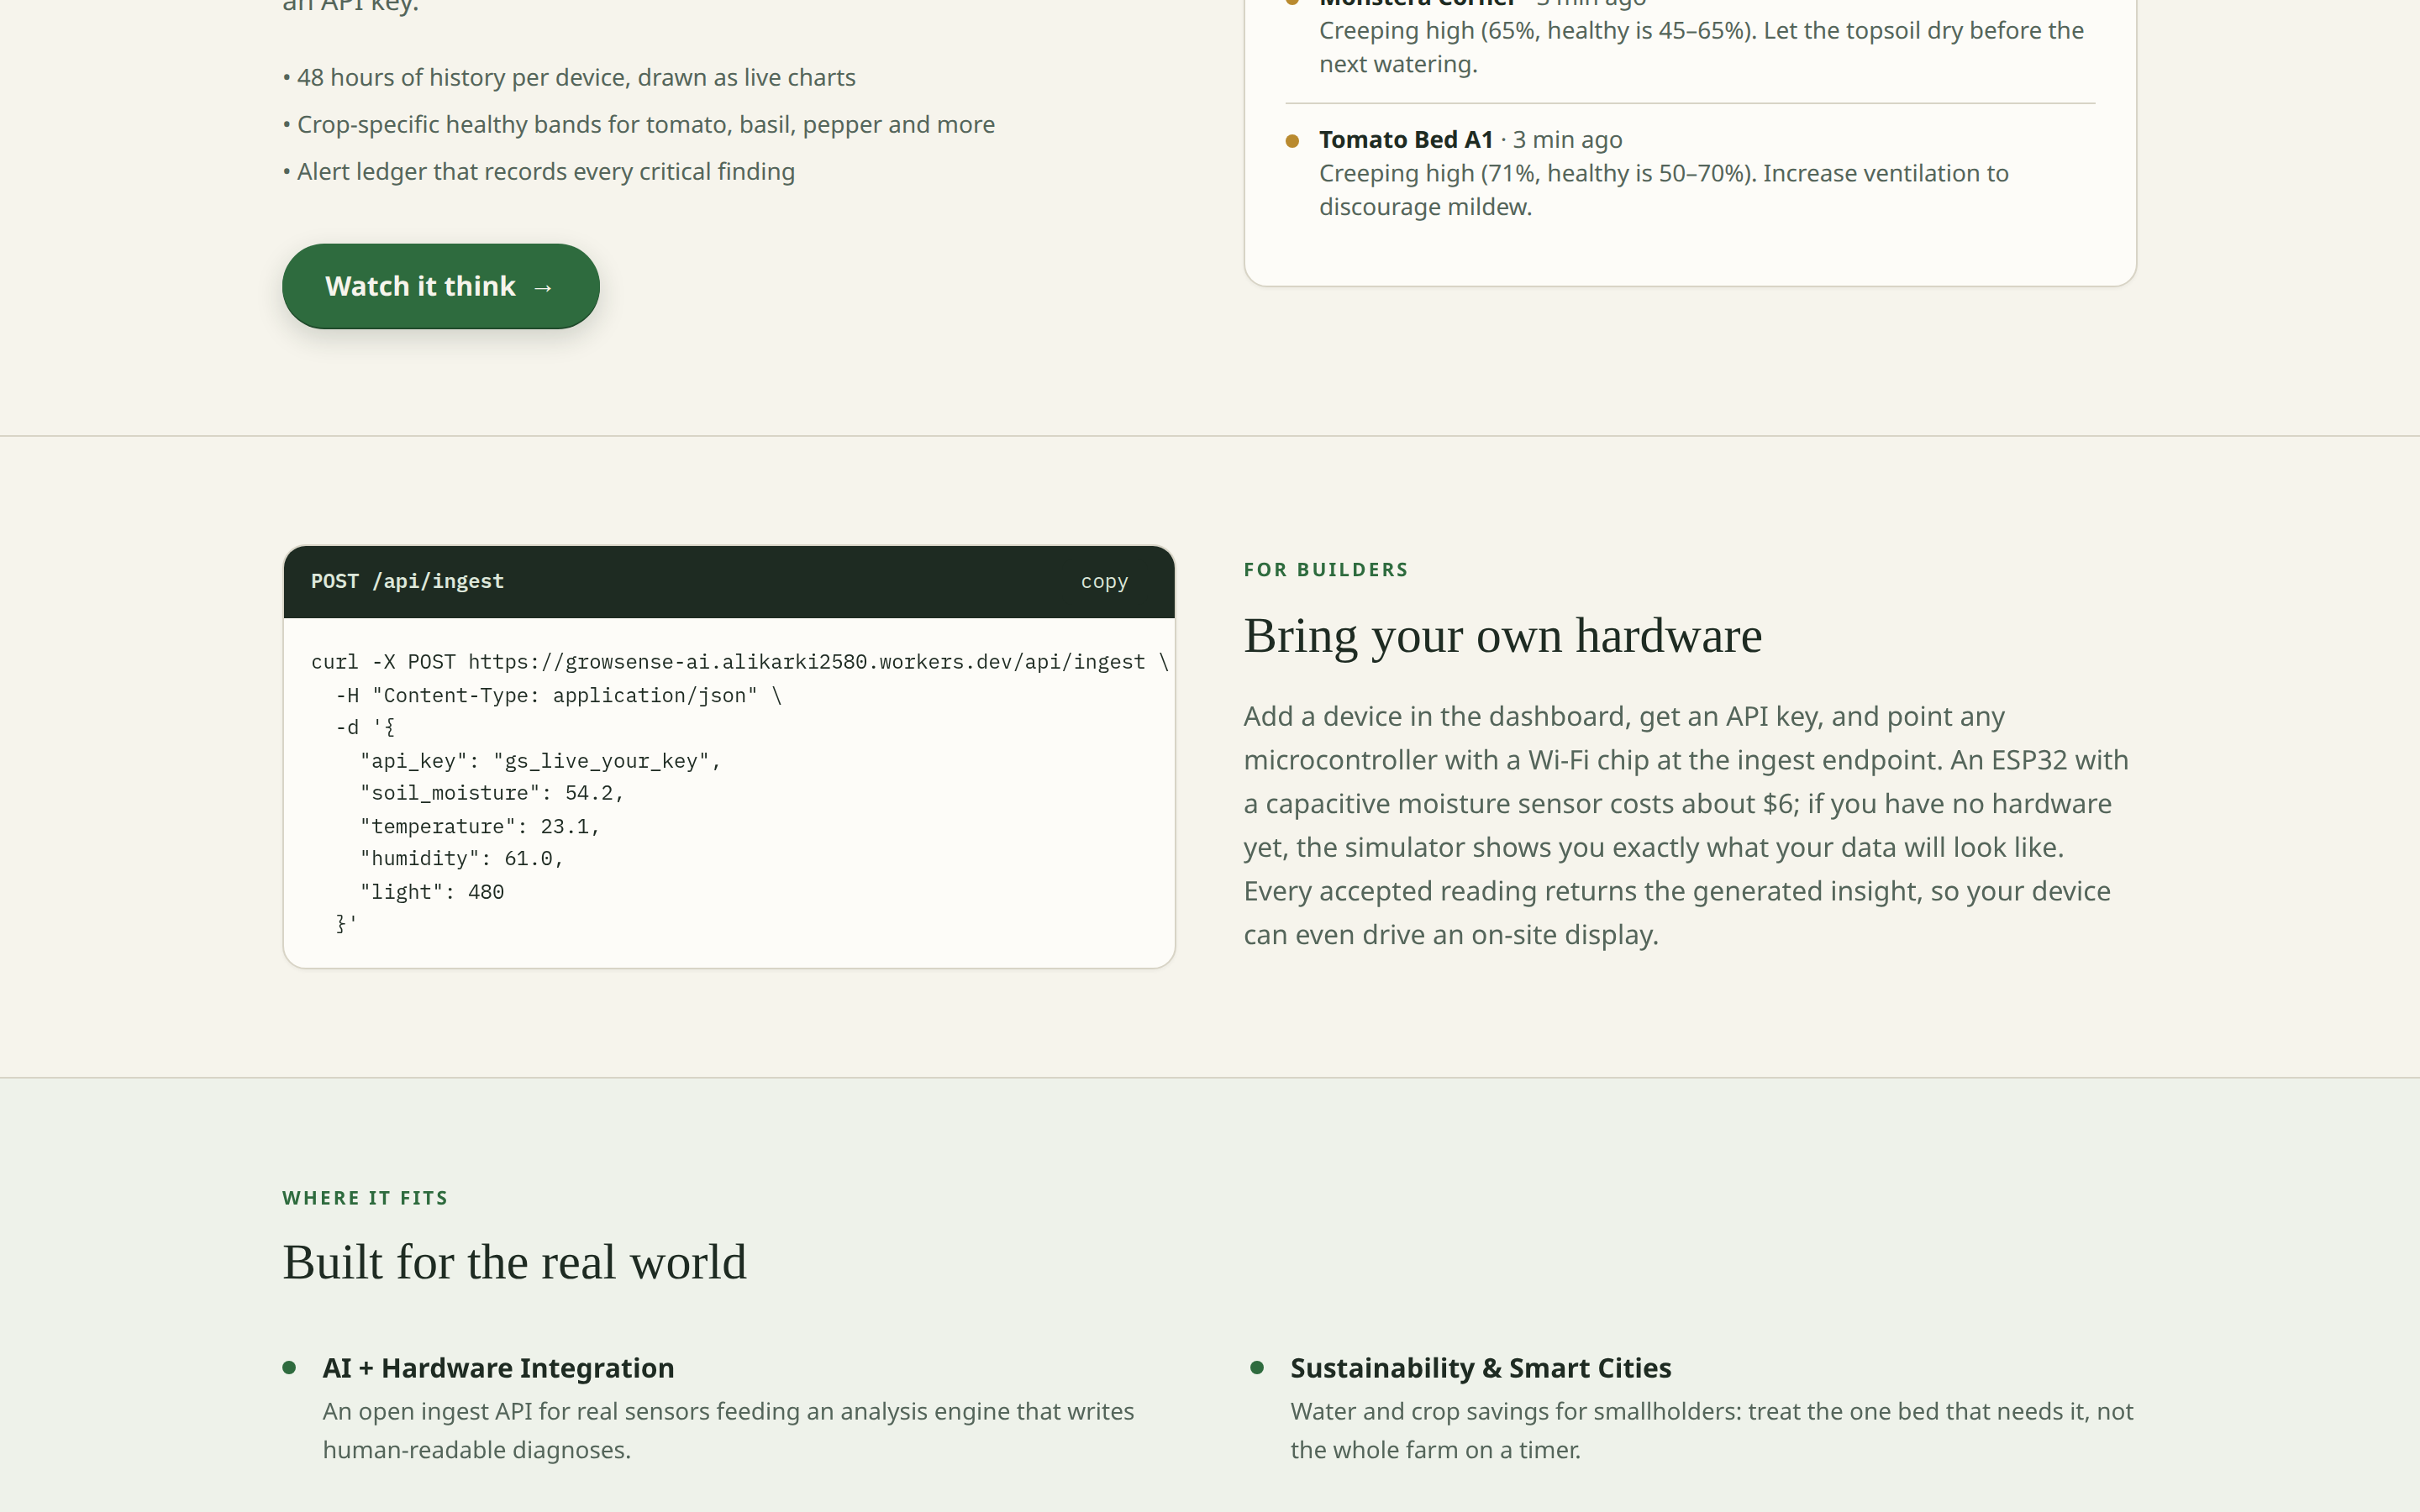
The whole loop is open: register a device, get an API key, and point any microcontroller at one endpoint. Every accepted reading returns the generated insight as JSON, so even a small on-site display can show the advice. An ESP32 with a capacitive moisture sensor costs about $6.
If you have no hardware at all, GrowSense ships with a simulated IoT fleet — three demo devices with realistic 48-hour sensor history (day/night light curves, dry-down cycles, and a quiet drought that the engine catches live) — so the full product is explorable in the browser.
How we built it
- One Cloudflare Worker, zero servers. The whole product is a single edge-deployed Worker: React 19 + TanStack Start server-rendered frontend, TanStack server functions for the API, and Cloudflare D1 (SQLite) for time-series storage.
- A deterministic, explainable insight engine. No black box: each metric is checked against crop-specific bands with watch and critical thresholds; a trend detector compares the last 12 readings with the window computed from real timestamps; the worst verdict picks the headline and the individual findings become the advice lines. Every sentence traces to a specific threshold — ask it why, and the answer is in the code. Domain rules matter too: light is only judged against its band during daytime hours, because low light at night is expected, not a problem.
- A physical IoT simulator. Deterministic mean-reverting moisture, daylight curves, per-device drought phases with different schedules, and idempotent batched seeding that respects the platform's request limits — the demo runs itself indefinitely without degrading.
- Hardware-grade ingest.
POST /api/ingestvalidates every field, rejects physically impossible readings, clamps device clock skew, and returns the generated insight so devices can act on it. - Charts drawn by hand. The interactive charts (band shading, hover crosshair with exact value + timestamp, time axis) are custom SVG — no chart library.
Challenges we ran into
- Making simulated data honest. A naive random walk either flatlines or sawtooths; we landed on mean-reverting behavior with per-device drought phases so the charts look like real plants being real.
- Time is harder than it looks. "The last 6 hours" is only true if you compute it from timestamps, not from a count of readings — live data arrives at a different cadence than history. The engine now derives every time window from actual timestamps, and device clocks that lie (readings "from 2030") are clamped at the door.
- Platform limits as design constraints: the Workers free tier caps requests per invocation, so seeding a 48-hour history for three devices had to be batched to fit — the constraint produced a faster, cleaner loader.
Accomplishments we're proud of
- The entire pipeline — sensor → storage → analysis → sentence — is live and verifiable end to end, including a real device feeding it right now.
- The demo tells a story by itself: one device is quietly drying out while you watch, and the ledger catches it.
- Zero-console-error, reduced-motion-aware, screenshot-safe UI with a custom design identity ("the grower's almanac") down to the hand-drawn icons.
What we learned
- In monitoring products, calibrated honesty beats impressiveness: a chart that auto-zooms 4 data points into a cliff looks dramatic and means nothing. Every axis, window, and caption on GrowSense is computed from the actual data.
- Edge deployment makes small projects feel like products: one Worker gives us SSR, a JSON API, a database, and global hosting with no servers to babysit.
- Write the diagnosis engine before the UI — knowing exactly which rule produces which sentence made every design decision after it easier.
What's next for GrowSense
- Real hardware validation: flashing an ESP32 + capacitive moisture sensor + DHT22 reference rig.
- Alert delivery beyond the dashboard (email/Telegram) and WebSocket push instead of polling.
- Rate limiting and hashed API keys for public deployments.
- More crops in the band library, and location-aware day/night handling.
Built With
- cloudflare-d1
- cloudflare-workers
- esp32
- react
- svg
- tailwindcss
- tanstack-start
- typescript
- vite

Log in or sign up for Devpost to join the conversation.