-
-
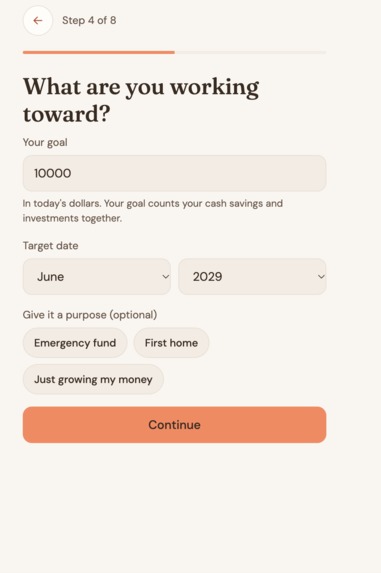
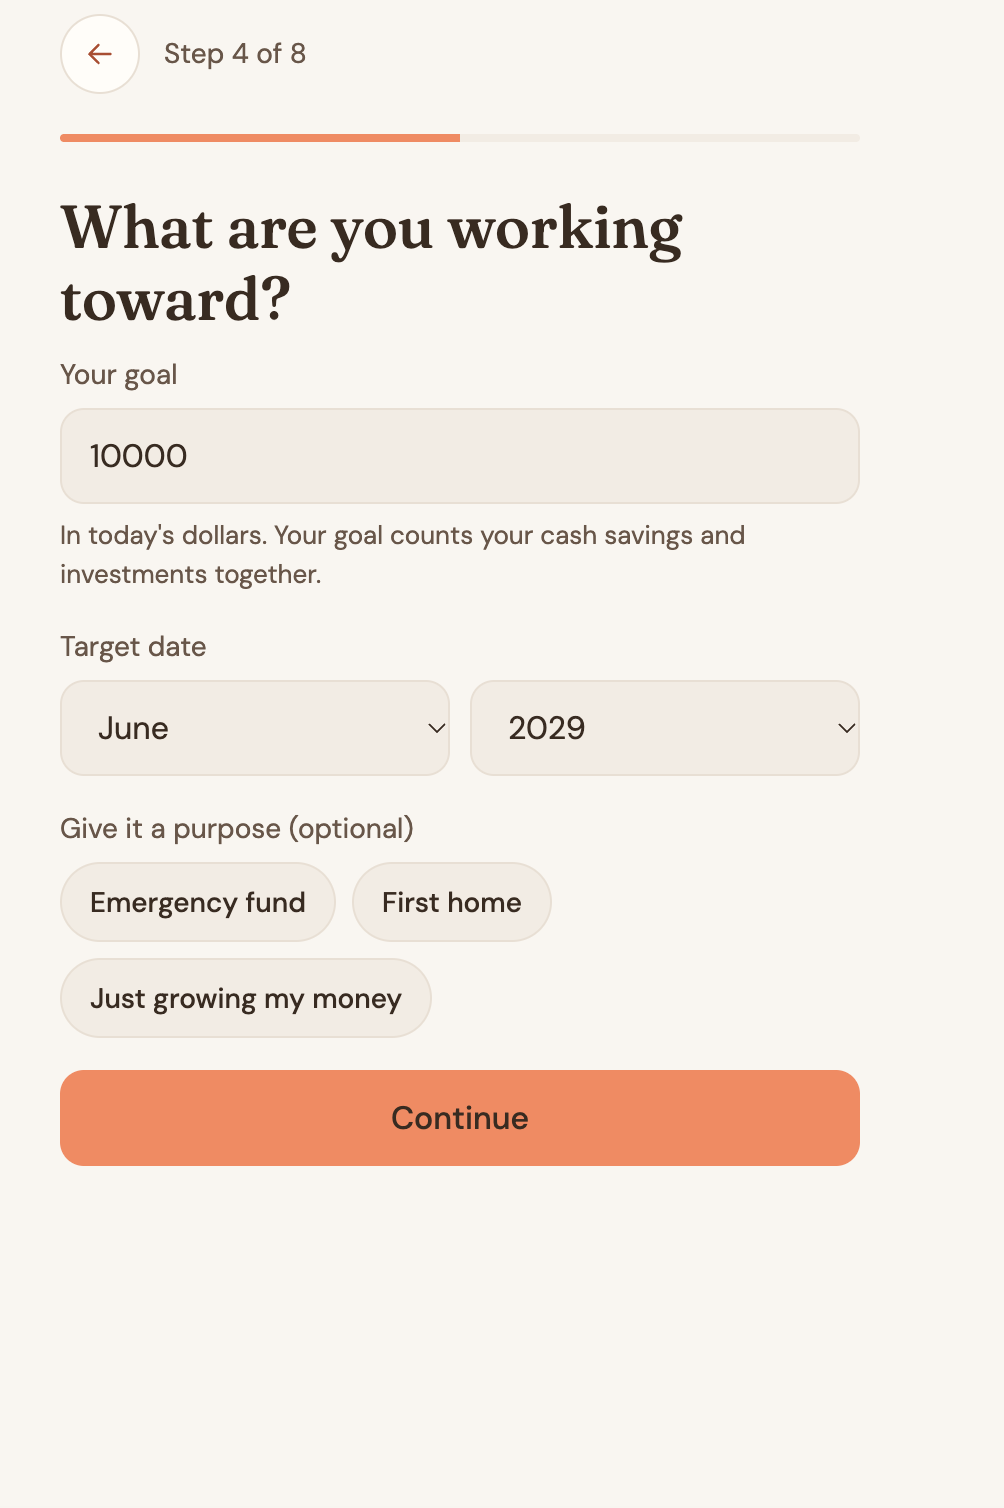
Set a goal in plain terms: an amount, a target date, and an optional purpose like a first home.
-
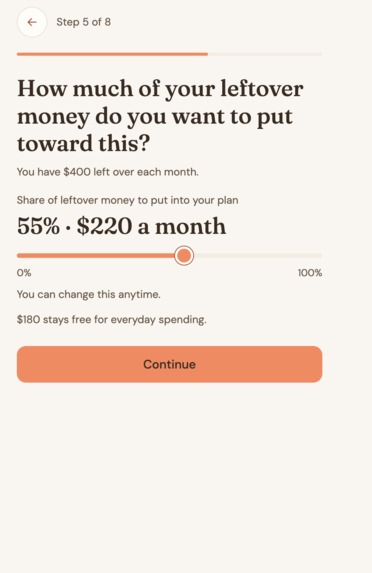
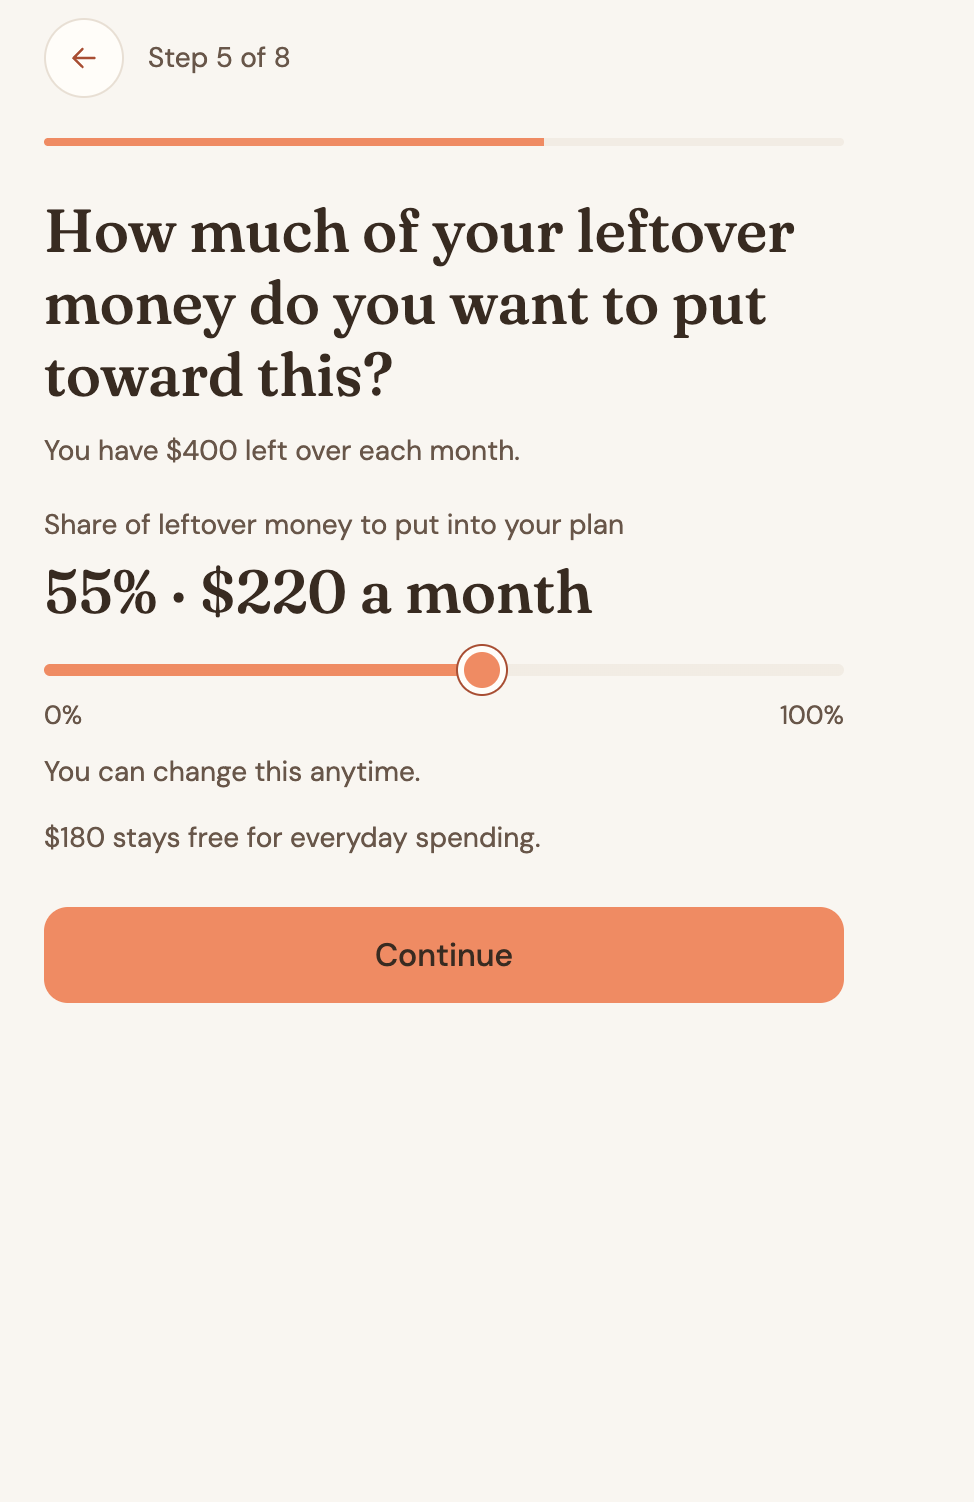
A slider sets how much of your leftover money goes toward your goal, shown instantly in dollars.
-
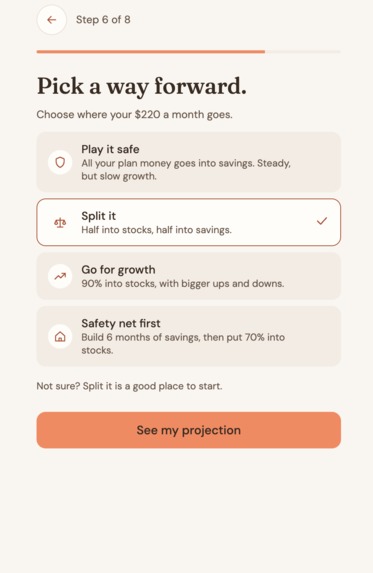
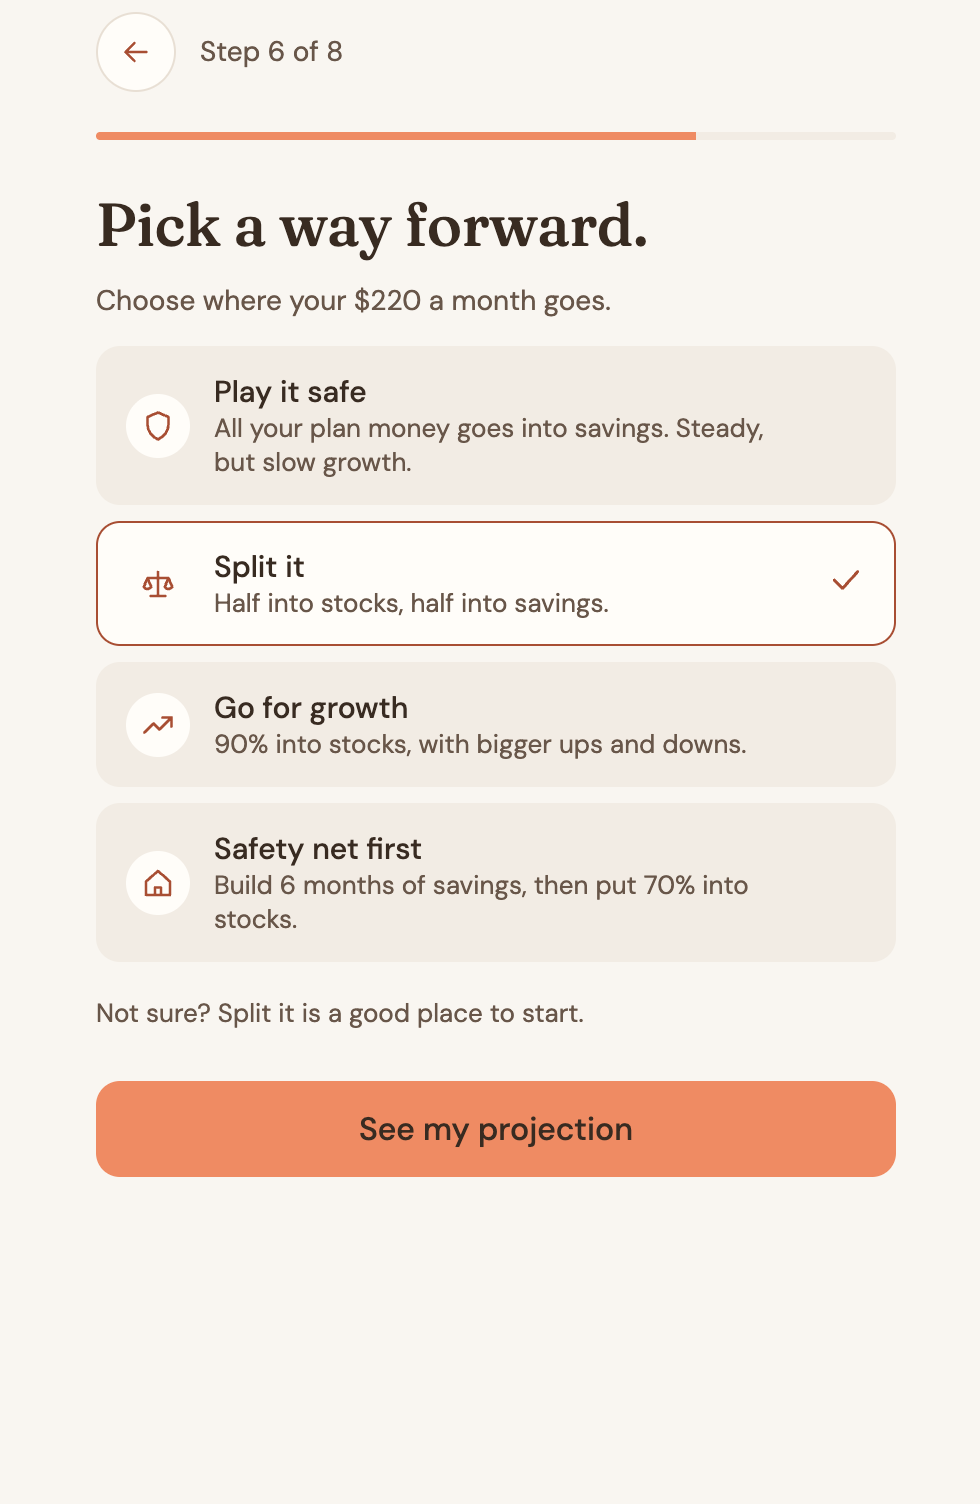
Four friendly presets replace confusing stock percentages, each explained in one simple line.
-
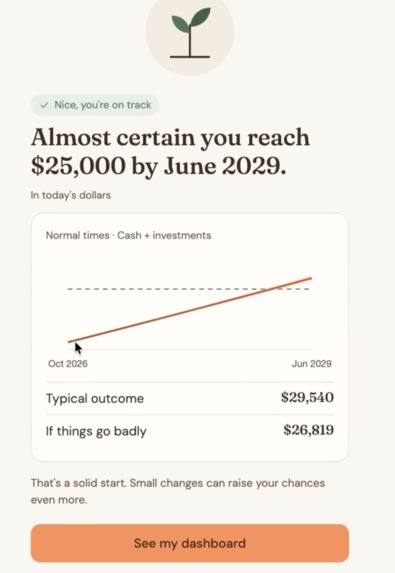
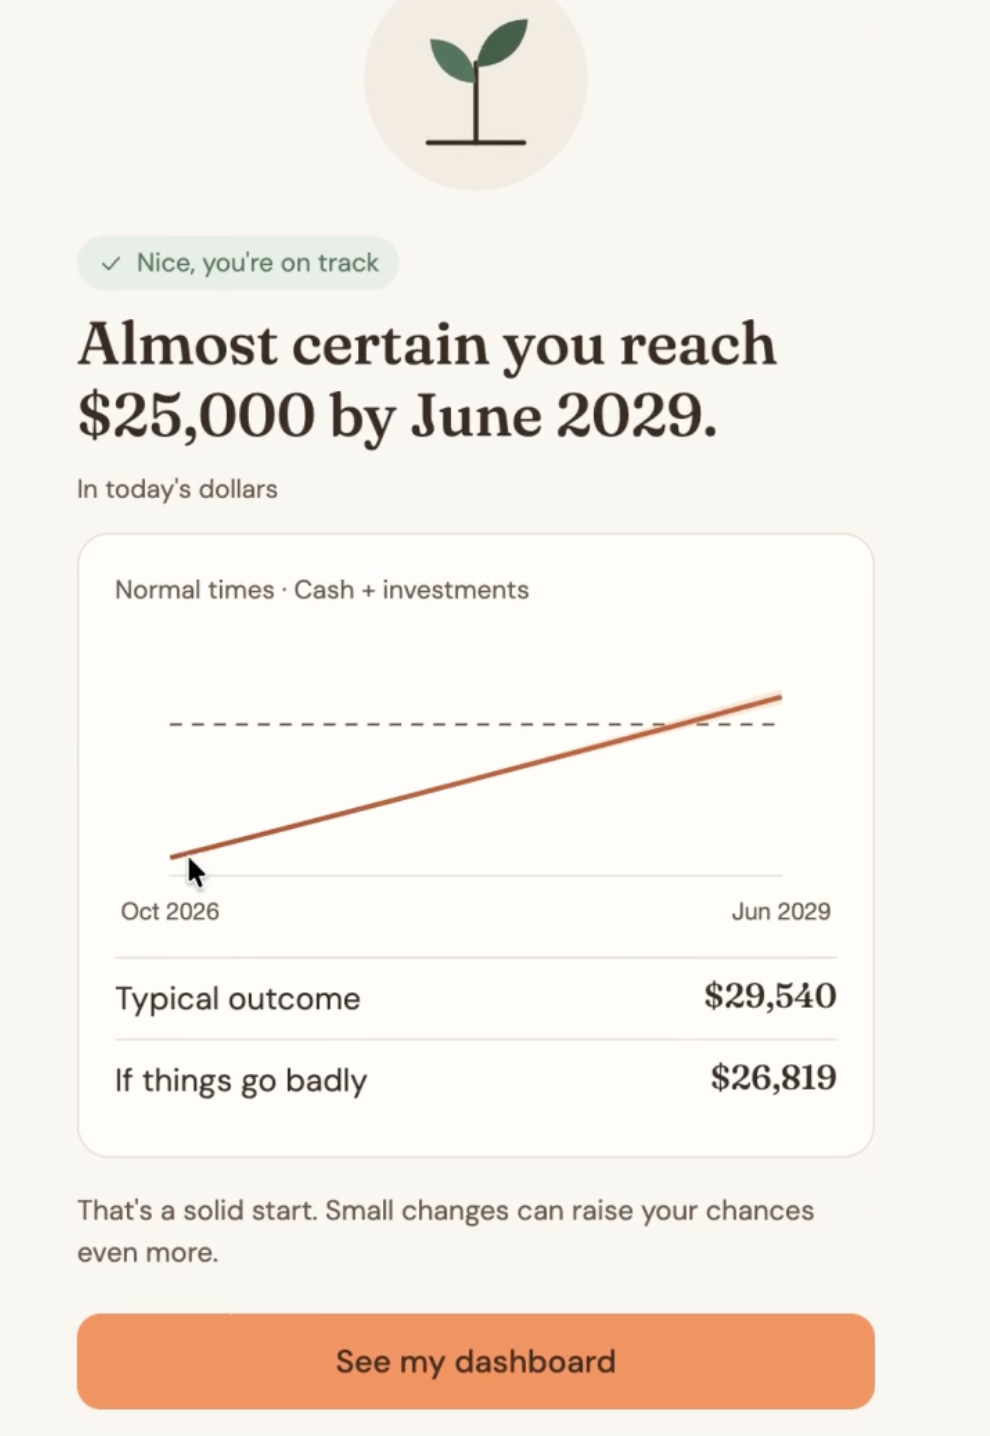
After simulating 10,000 futures, you get a clear verdict, a typical outcome, and what happens if things go badly.
-
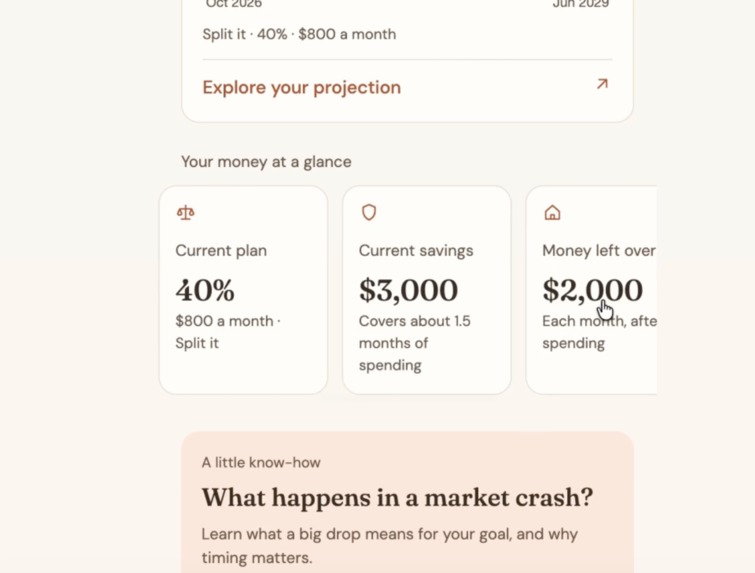
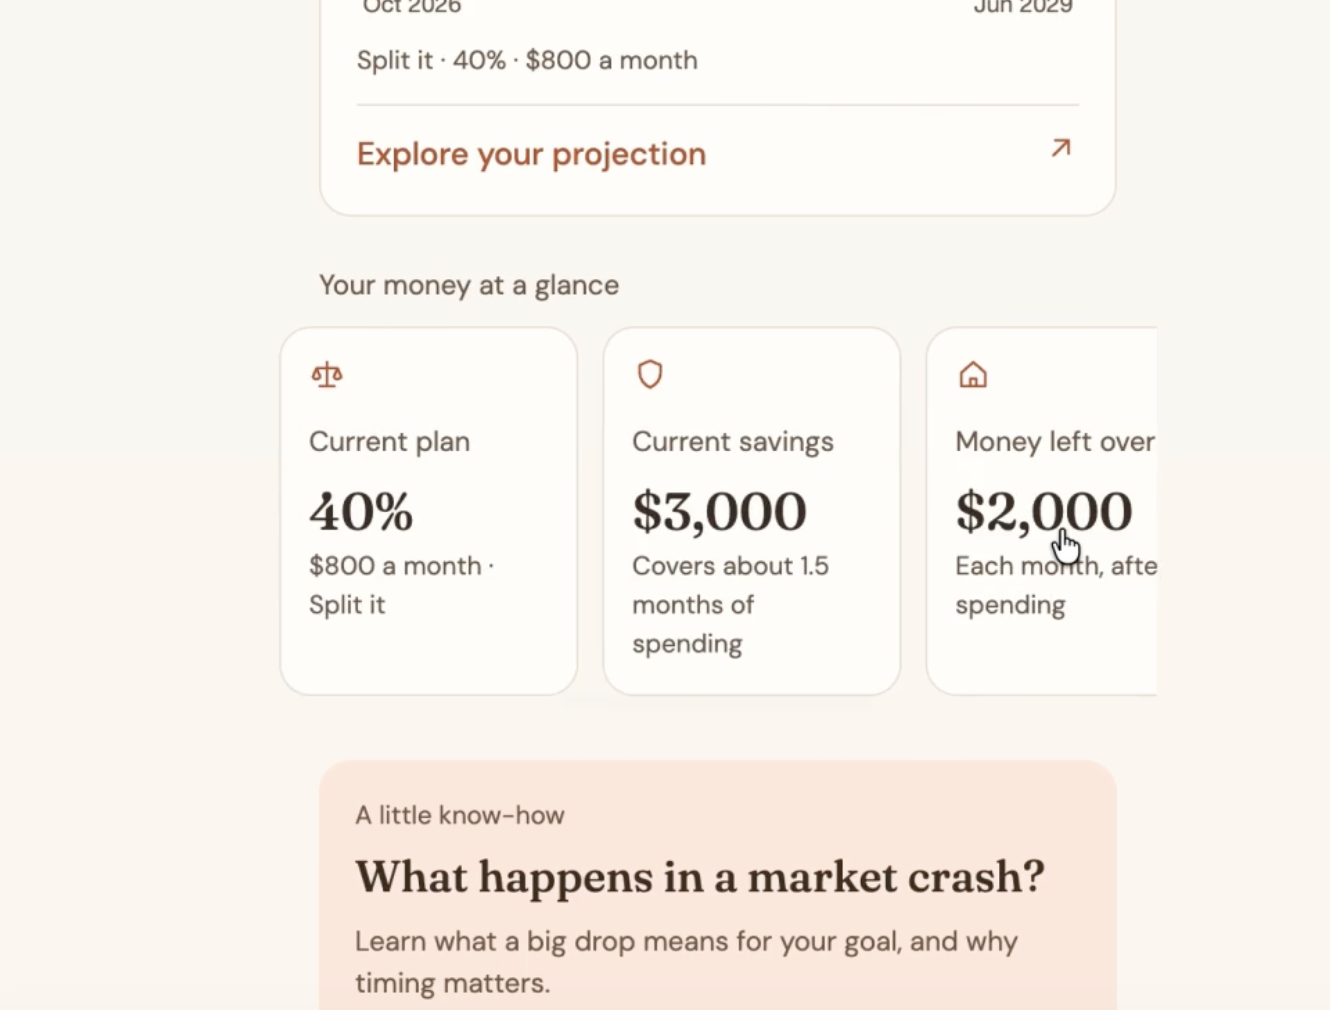
A calm home base: your goal outlook, plan, savings, and leftover money at a glance, plus a quick lesson.
-
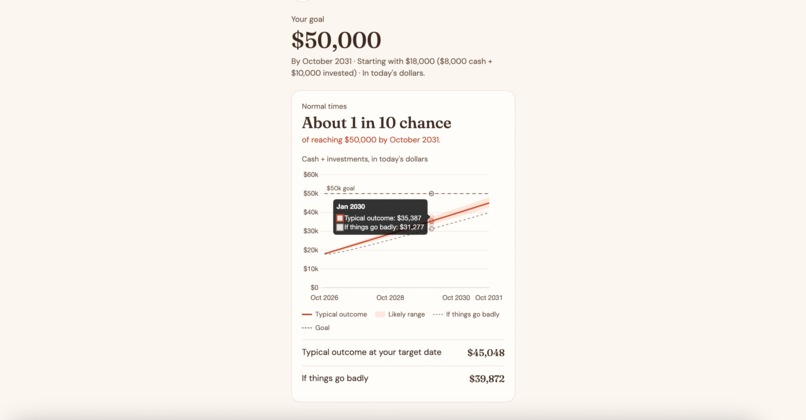
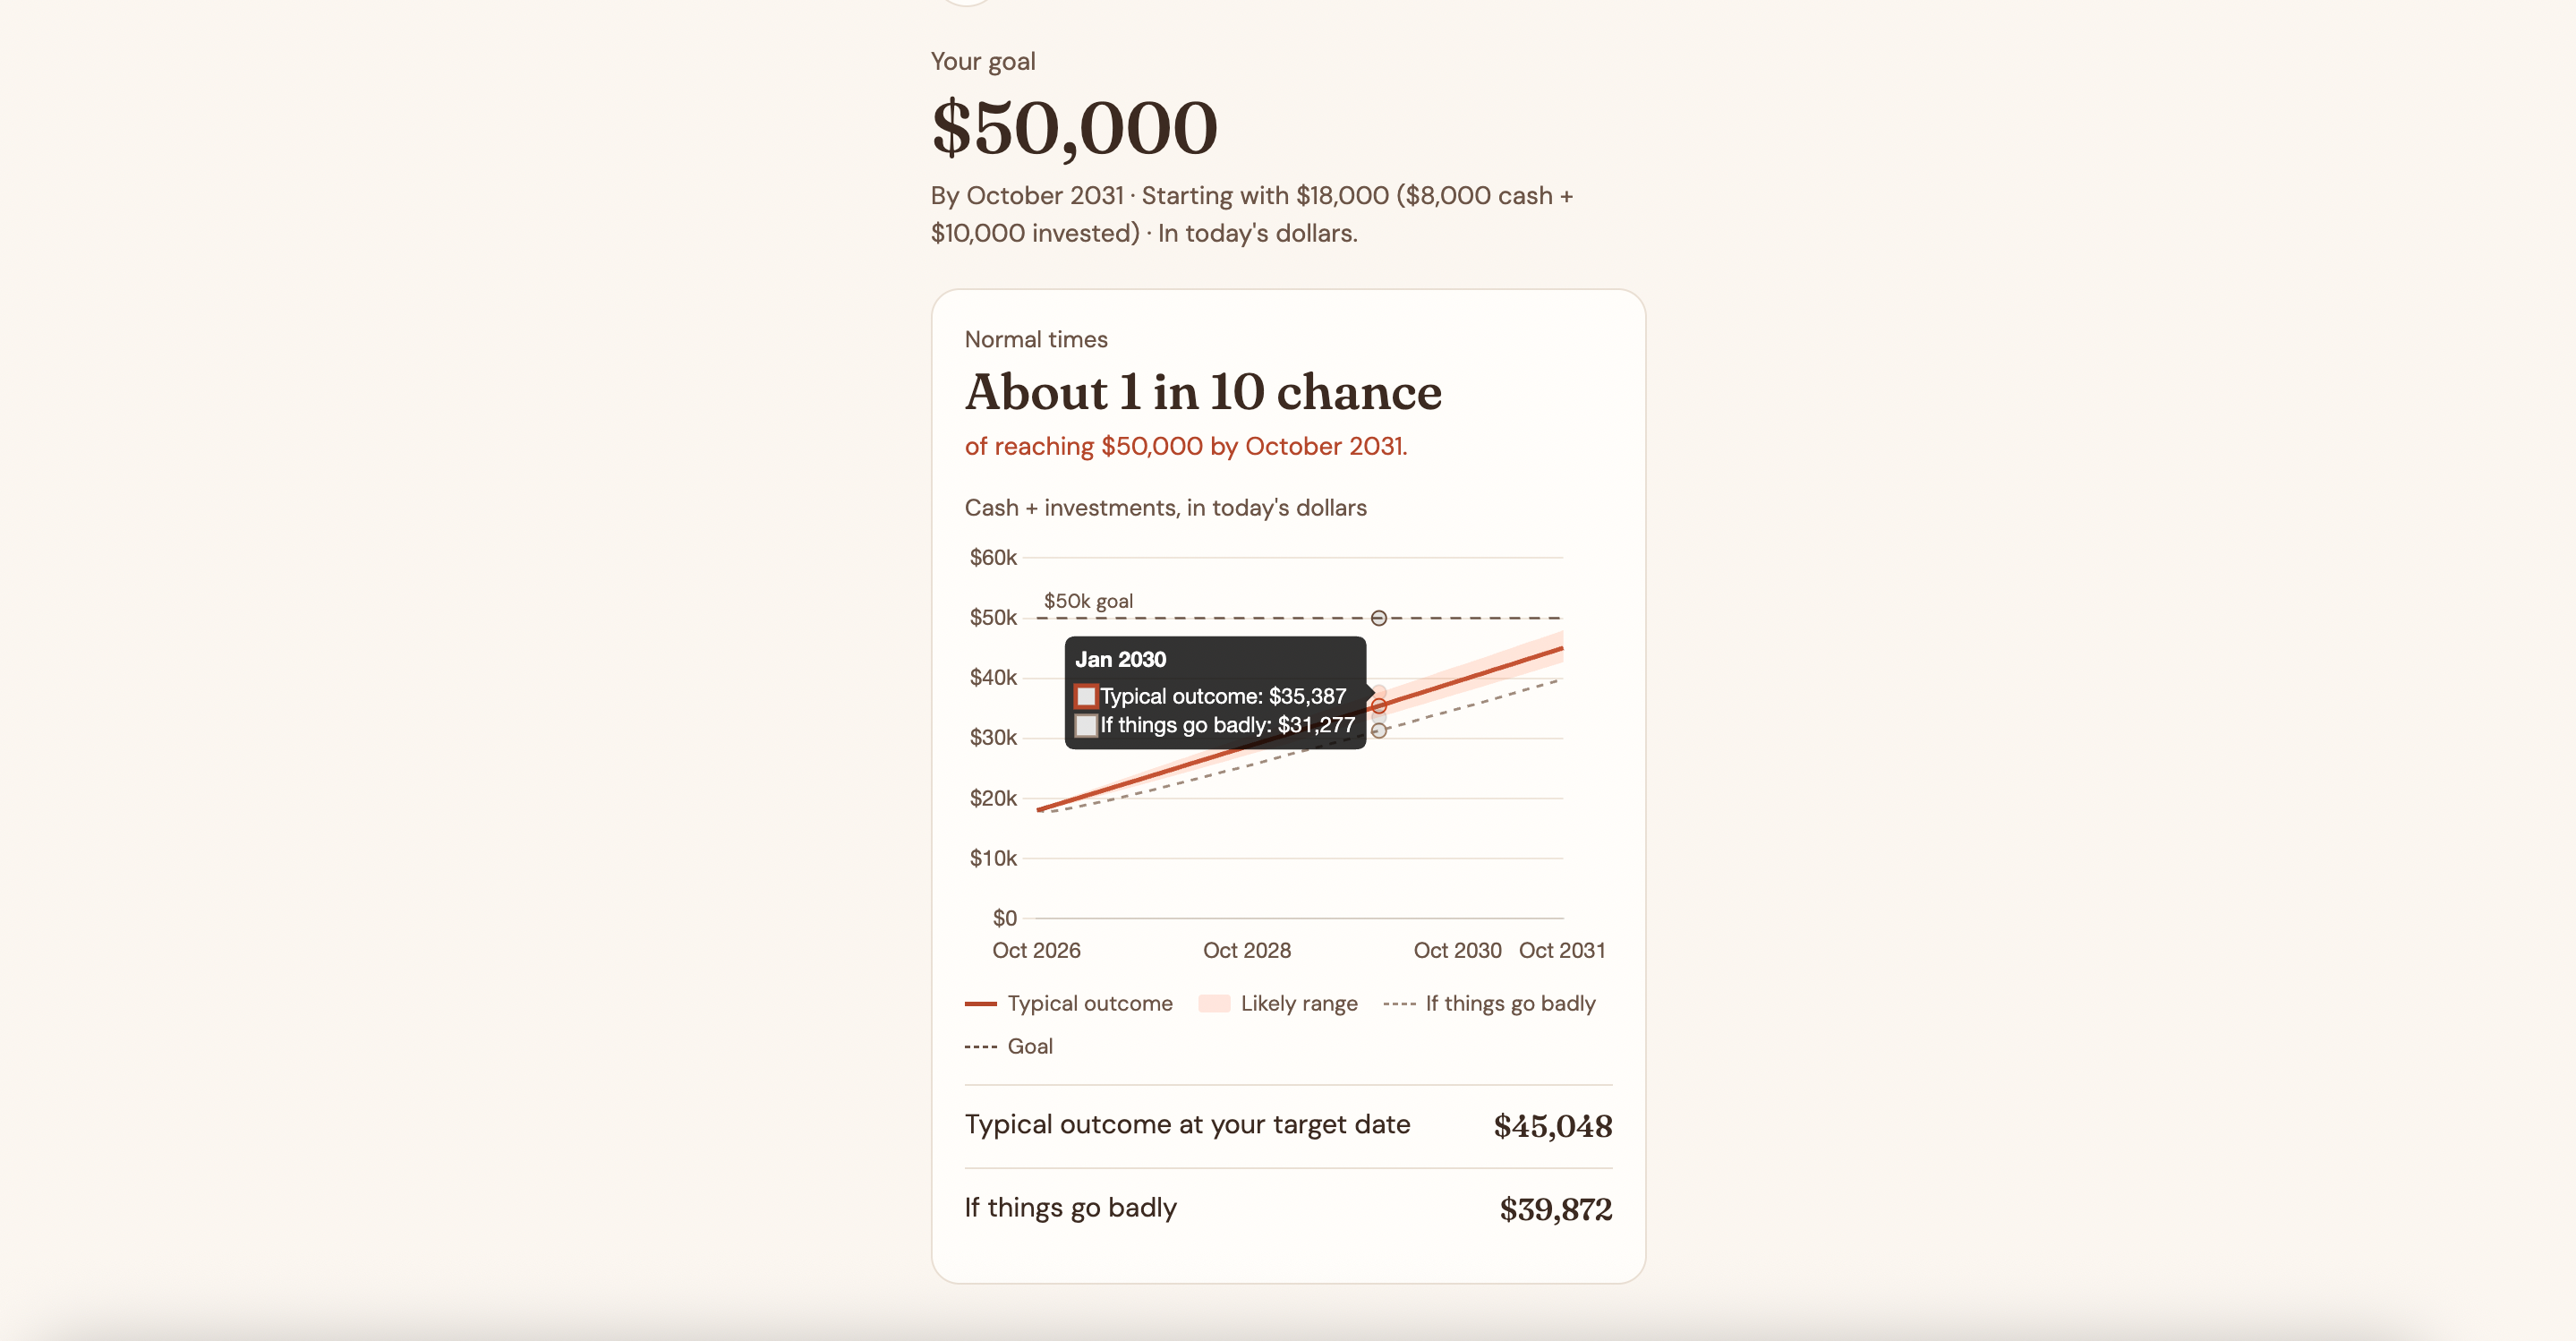
See 10,000 simulated futures at once: a typical outcome, a likely range, and a bad-luck line, with exact values on hover.
-
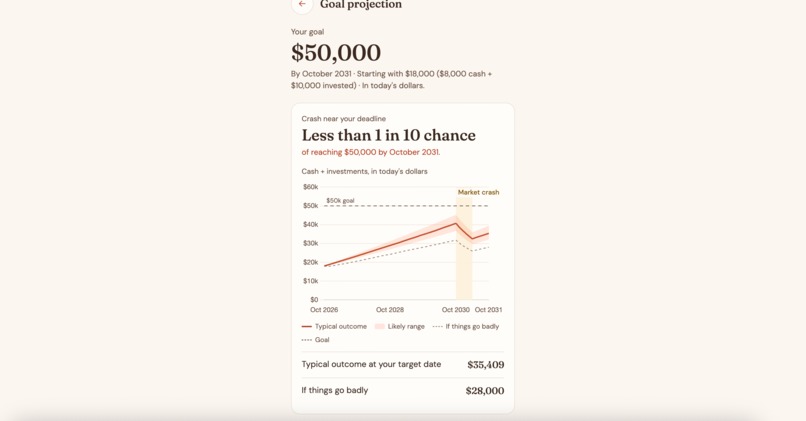
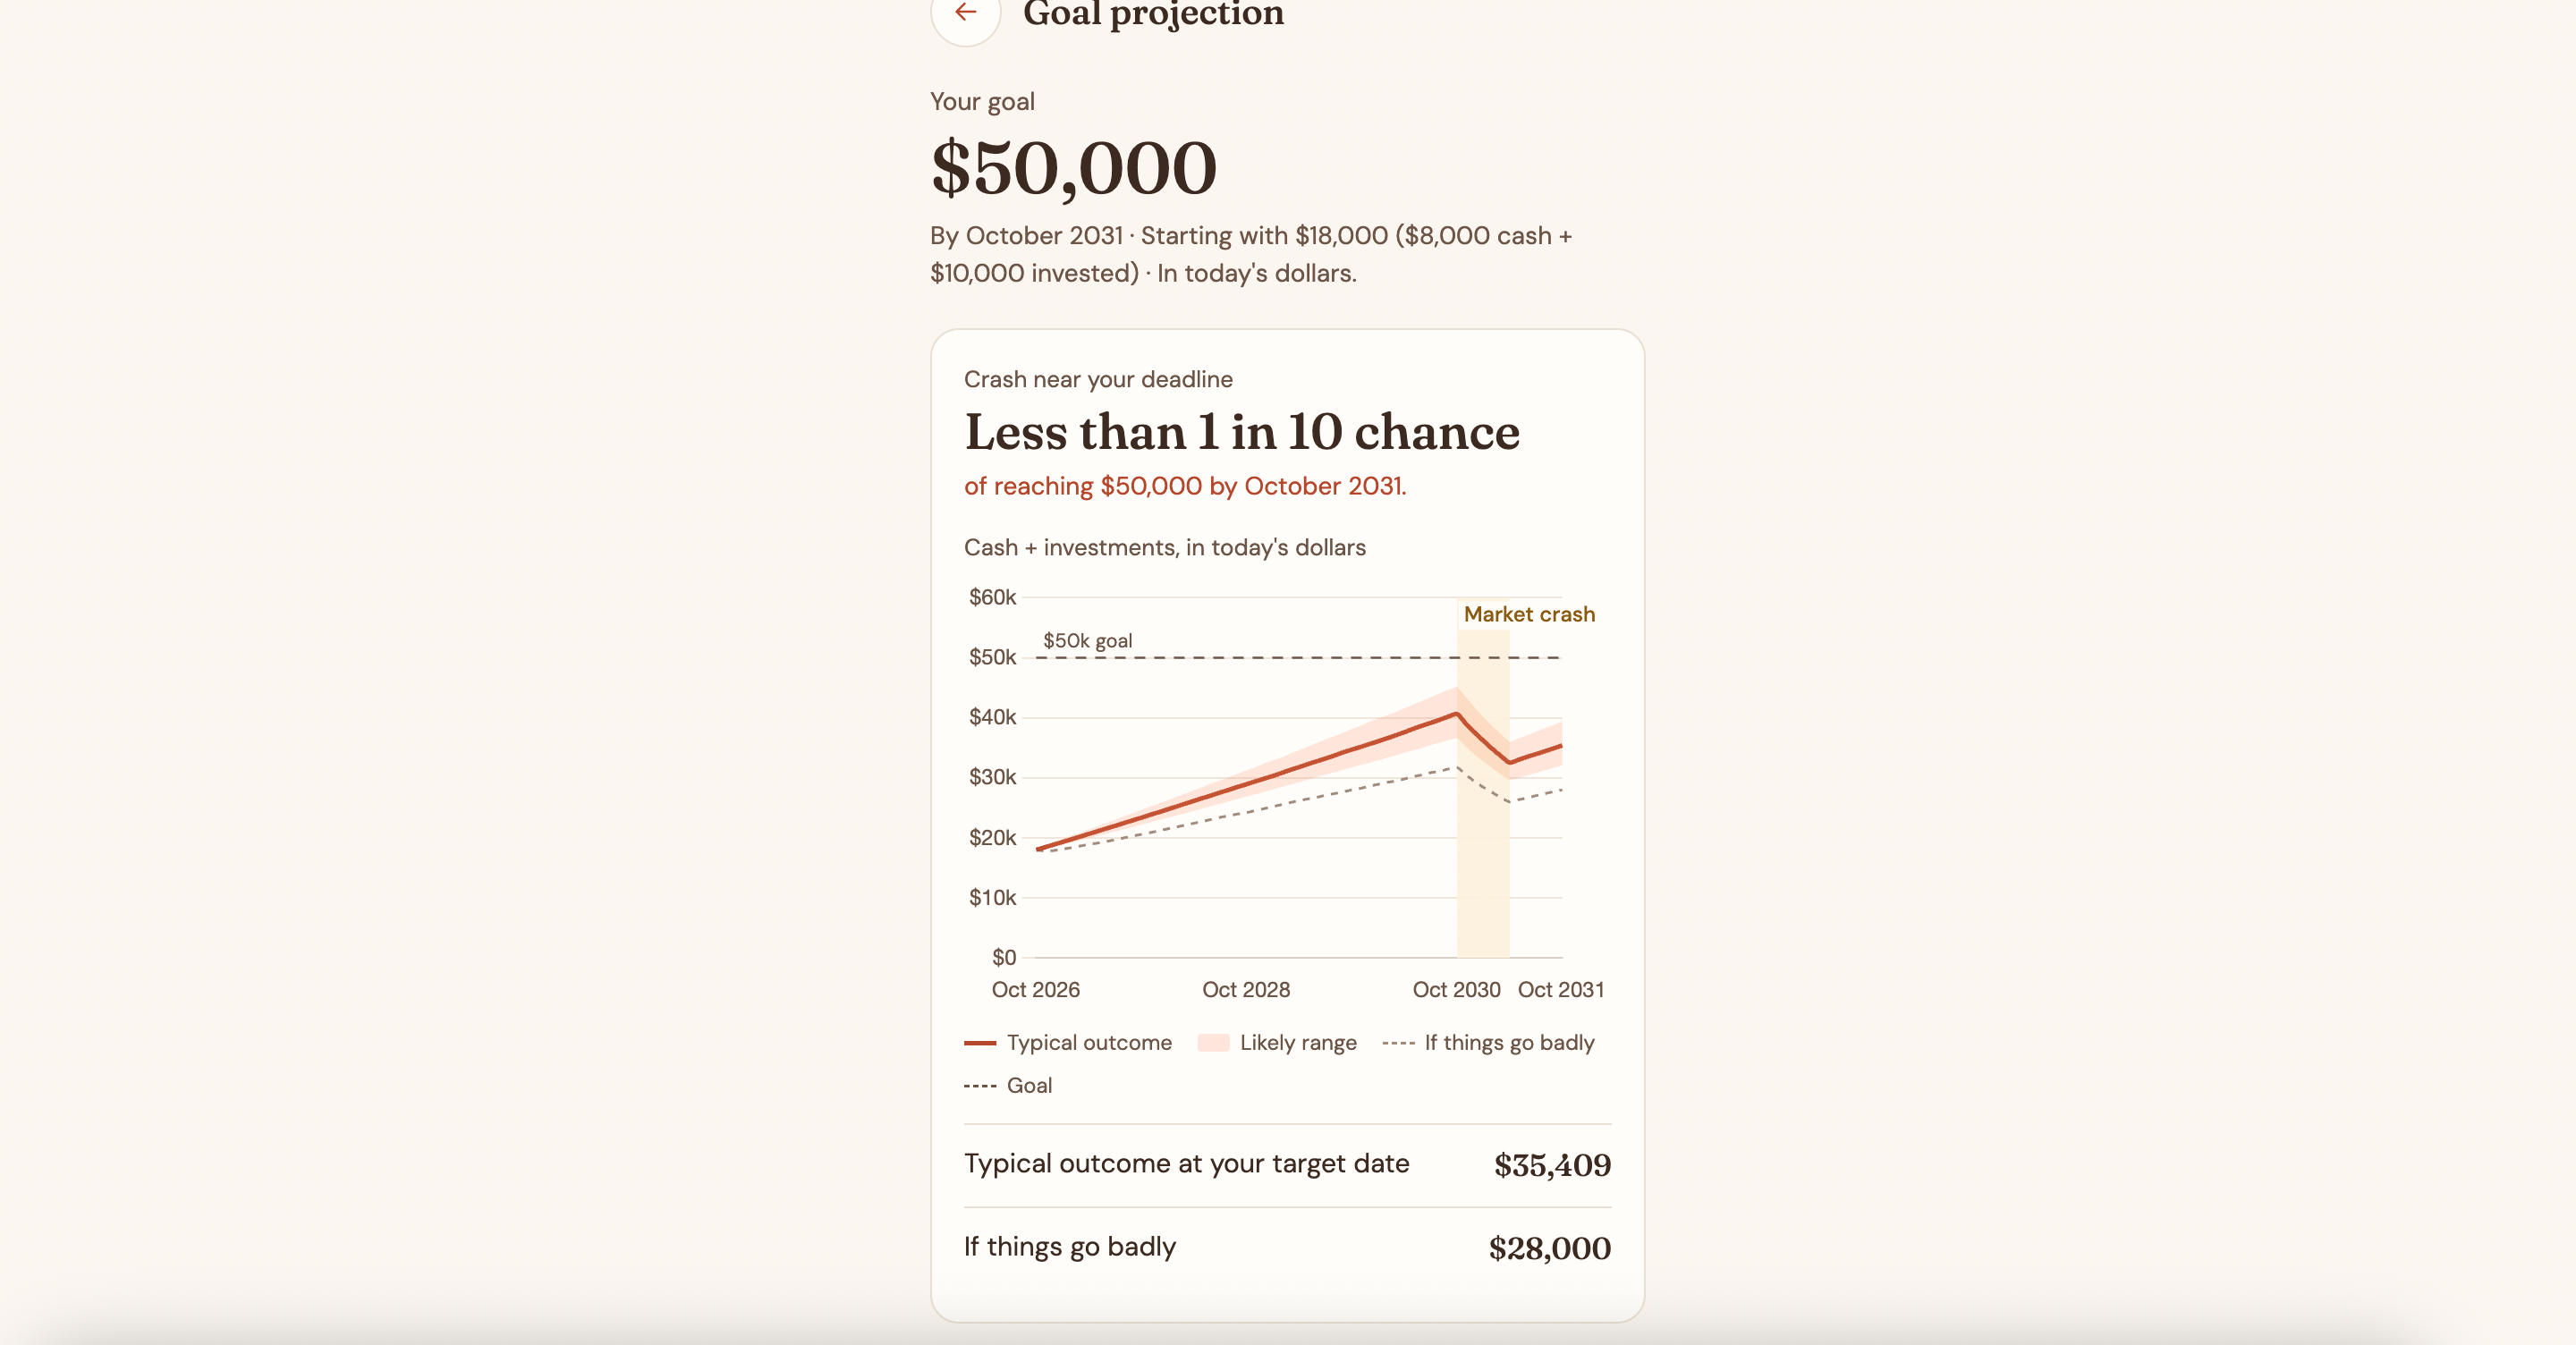
A crash right before your deadline shows why timing matters, with the event shaded right on the chart.
-
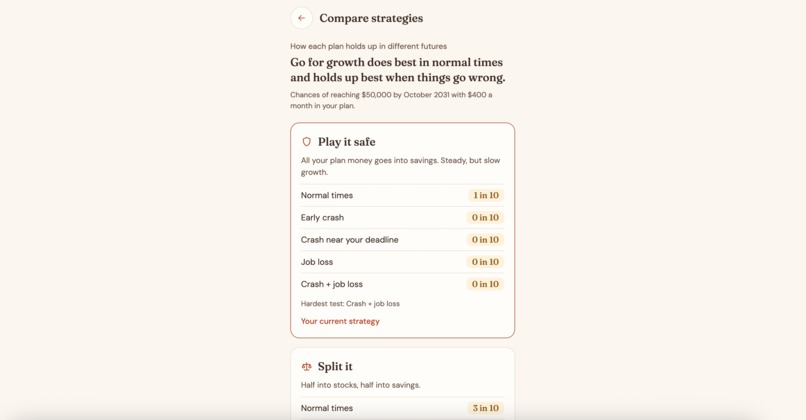
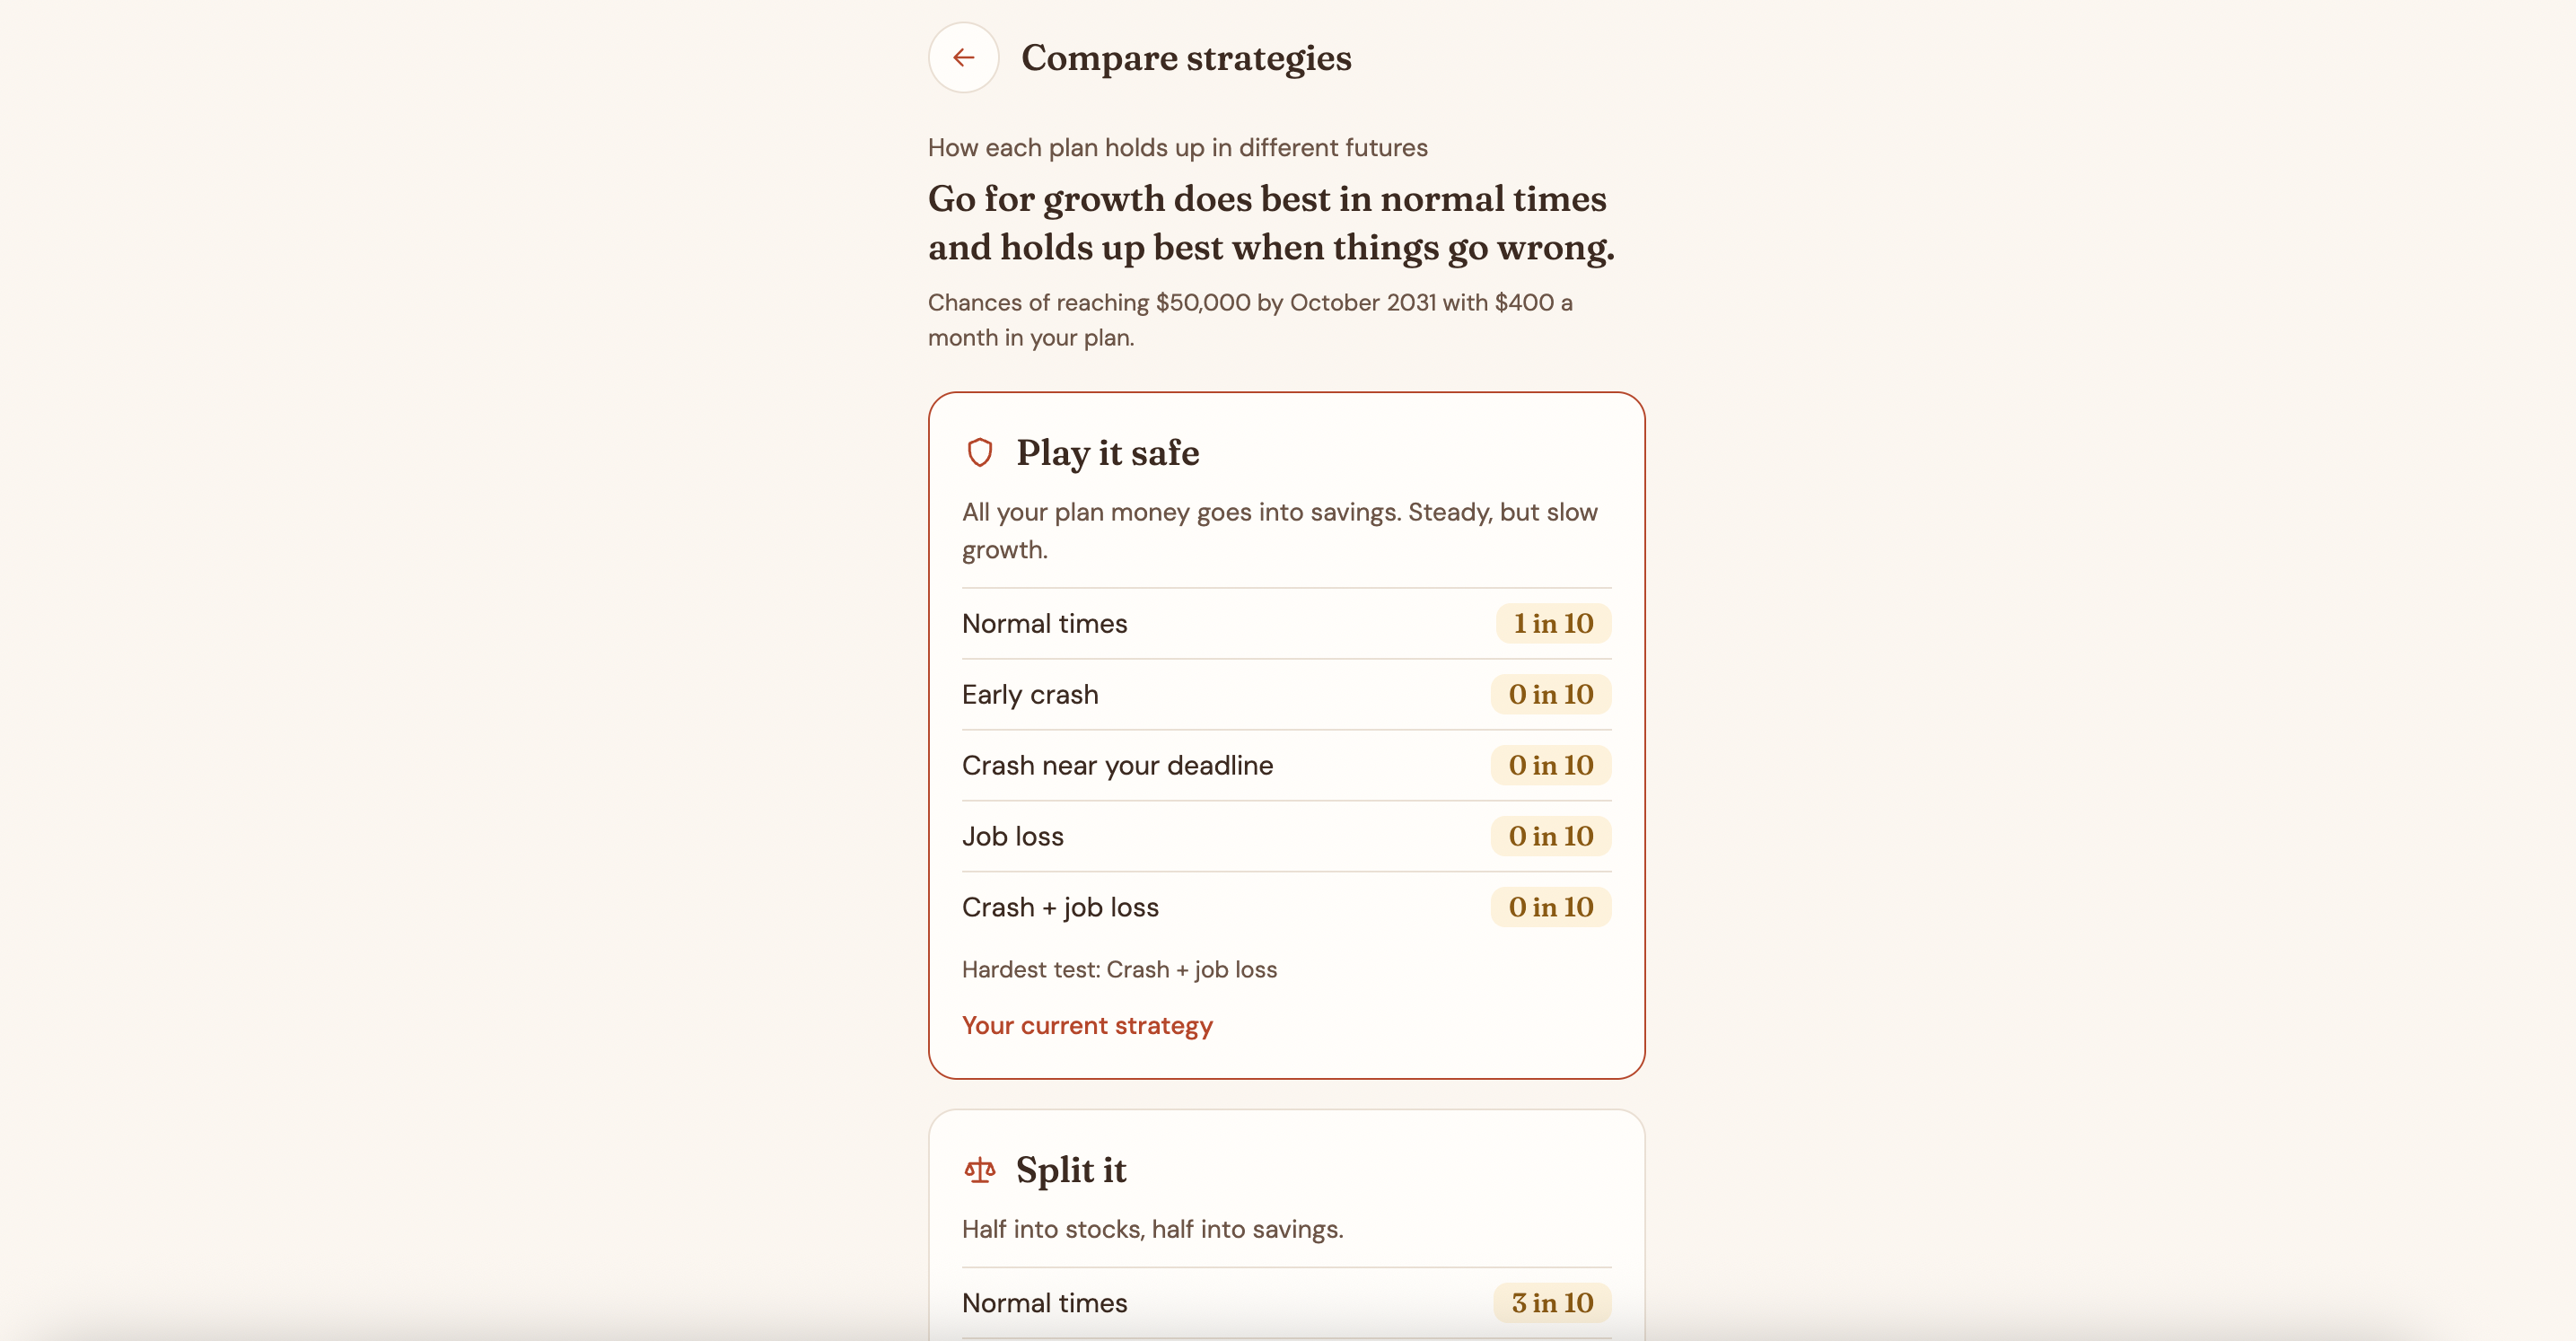
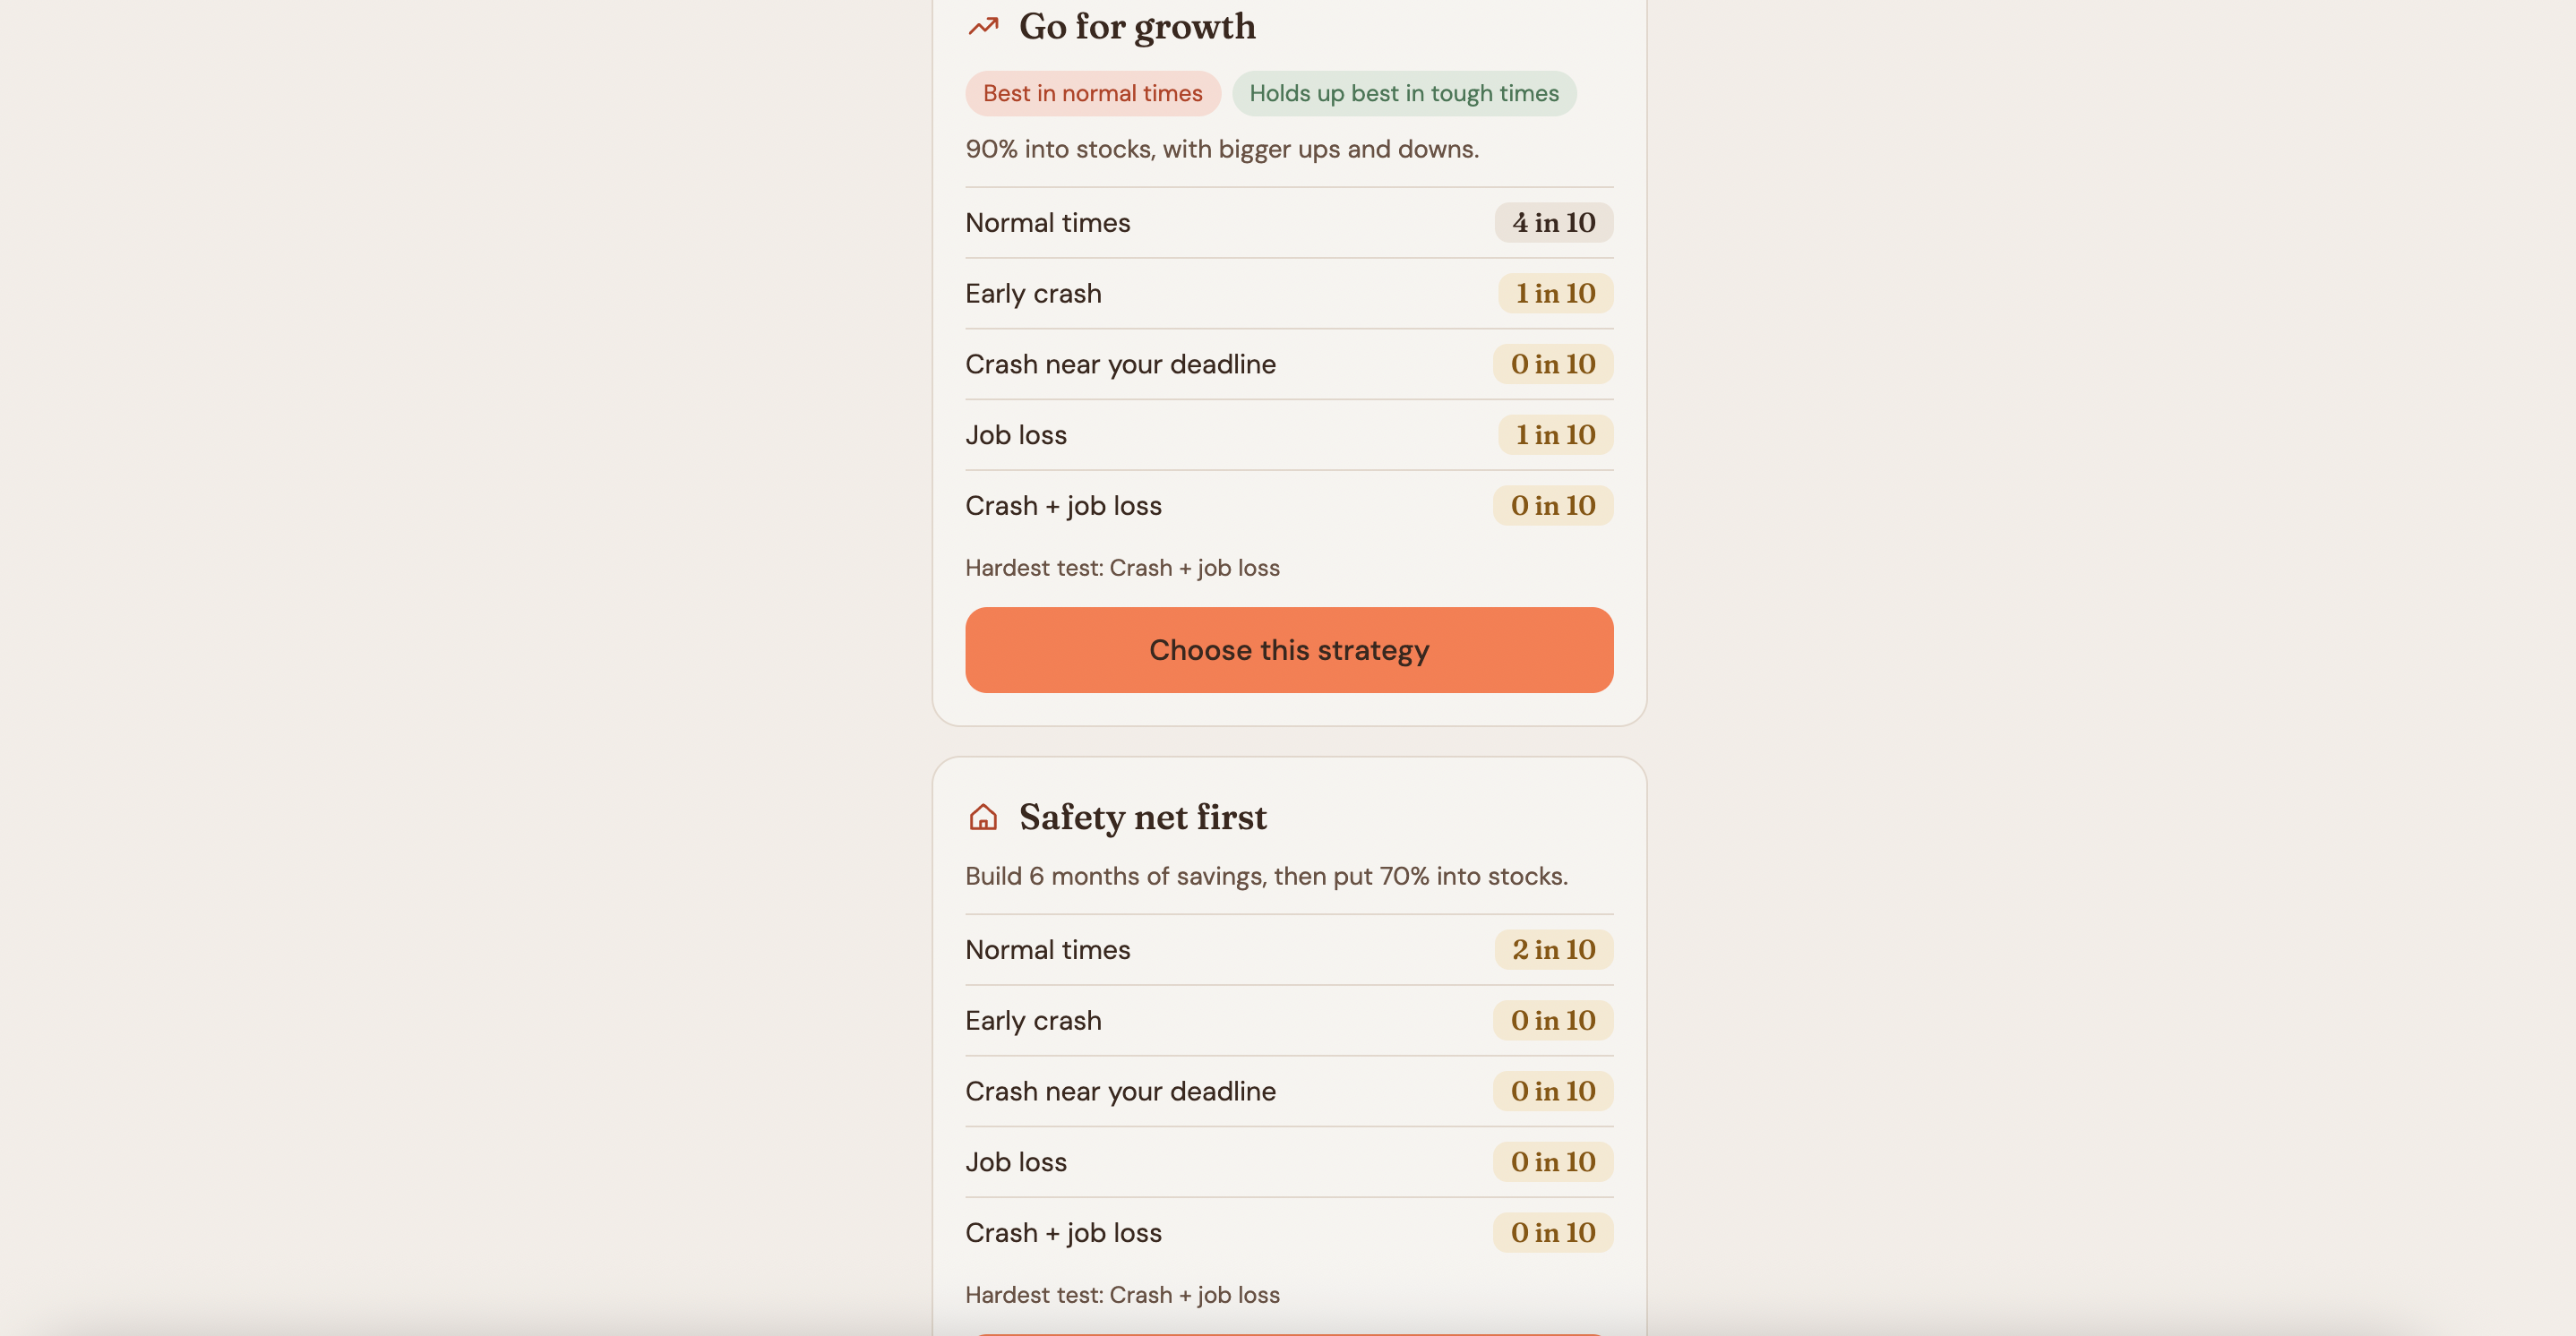
Compare strategies leads with a one-sentence takeaway, then shows each plan's chances in plain "X in 10" terms.
-
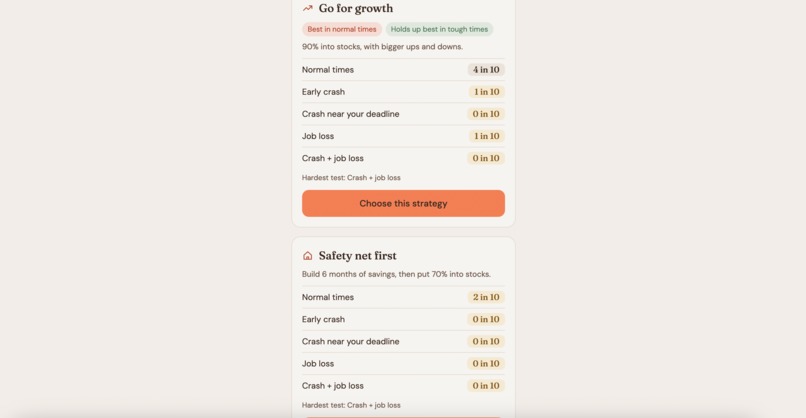
Each strategy is stress-tested against five futures, with badges for what does best in normal times and in tough times.
Inspiration
Most money apps show you a number or a pie chart. Almost none show you what happens when things go wrong, and that's exactly what people who are new to money can't picture. What does a market crash do to a savings plan? What if you lose your job for six months? Which matters more?
We wanted a tool that answers those questions in plain English: a crash test for your financial life.
What it does
Grow lets you set a savings goal ("$44k in five years") and compare a few simple strategies for where your monthly savings go: save it all, half and half, mostly invest, or build a cushion first. It then runs each strategy through five situations: normal times, an early crash, a crash right before your deadline, losing your job, and a crash plus a job loss.
For every strategy and situation, you see your chance of reaching your goal, a fan chart of 10,000 possible futures, and how many months of bills you could cover if the money stopped. Sliders for savings and emergency fund update the picture instantly.
- Plain language, no jargon. Results read like "72% chance you reach your goal," not "95% VaR."
- Connect an account. Grow fills in your inputs from Capital One's Nessie API, so you don't have to type them. <!-- CONFIRM: Nessie import is working -->
- Keep track. Sign in to save your plan and check in each month to see how your odds are changing. <!-- CONFIRM: accounts + snapshots are working --> Grow compares options and shows the tradeoffs. It is education, not financial advice.
How we built it
The engine is a Monte Carlo simulation in Python and NumPy. It steps month by month, with fat-tailed stock returns, savings returns, a job-loss model, and forced crash windows, all in today's dollars. Every strategy and scenario reuses the same pre-drawn random shocks, so comparisons are paired: a difference between two results comes from the strategy, not from luck. Money flows through three layers each month: your surplus (income minus expenses), what you choose to save from it, and how that saving splits between stocks and savings after the emergency fund fills.
The server is FastAPI with strictly validated requests. It serves /simulate for a single result and /grid for the full strategy-by-scenario comparison. One simulation takes about 20 ms in our tests, and the whole grid under half a second, which is what makes the sliders feel instant.
The data and accounts. Capital One's Nessie API supplies the mock bank data. Supabase handles sign-in and a Postgres database with row-level security, so each user can only ever read their own plans and check-ins. We tested those rules against a real Postgres instance.
The frontend is <!-- FILL IN: partner's stack (React / Svelte / React Native...) --> built mobile-first by our UI lead.
We wrote automated tests for the engine (closed-form growth checks, crash sizing, ruin logic, paired shocks) and for the API.
Challenges we ran into
- Deciding where the money goes. Our first version quietly dumped any unsaved income into a cash account, which made the savings slider almost meaningless. Rebuilding it as three layers (surplus, contribution, split) fixed it.
- Strategies shouldn't force you to sell. If someone already holds a $5k portfolio and picks "save it all," we don't liquidate it. A strategy only decides where new money goes, so we renamed the strategies to say exactly that.
- Honest numbers. A fixed goal creates odd incentives: when you're already behind, a riskier strategy has a better chance of catching up, even though it's worse in most outcomes. We had to think about how to present that without misleading people.
Building in parallel. The engine and the UI had to move at the same time, so we agreed on the API's request and response shapes early and built the interface against fake data.
Accomplishments that we're proud of
A simulator fast enough that sliders update live, with paired random shocks so scenario comparisons are fair.
Results that teach something real: if you can reach your goal by saving, extra risk only hurts, and losing income can be a bigger threat to a plan than a market crash.
Security rules that we tested instead of assumed, and a design that stores only numbers, never bank credentials.
A tested codebase, built in a weekend.
What we learned
Modeling choices decide what the product teaches. A small decision about unsaved income changed the whole meaning of a slider.
"Probability of hitting a goal" is a slippery metric on its own, so we should show typical and bad-luck outcomes beside it.
Never build auth yourself when a hosted service does it better.
Scope is everything at a hackathon: agree on the contract between the engine and the UI first, and get a thin version working end to end before polishing.
What's next for Grow
Richer assets and risks: bonds, inflation as an uncertain risk, and job loss tied to recessions instead of fixed timing.
Smarter strategies: glide paths that shift toward cash as the deadline nears, and an option to rebalance existing holdings.
More goals and scenarios: retirement, paying off debt, a surprise medical bill.
Real bank connections through an aggregator such as Plaid, with encrypted token storage, a security review, and a clear way to disconnect and delete your data.
Plan vs. actual: overlay your real balances on your original forecast so you can see how you're tracking.
A native mobile app for monthly check-ins.
Built With
- css
- fastapi
- figma
- html
- javascript
- python

Log in or sign up for Devpost to join the conversation.