-
-
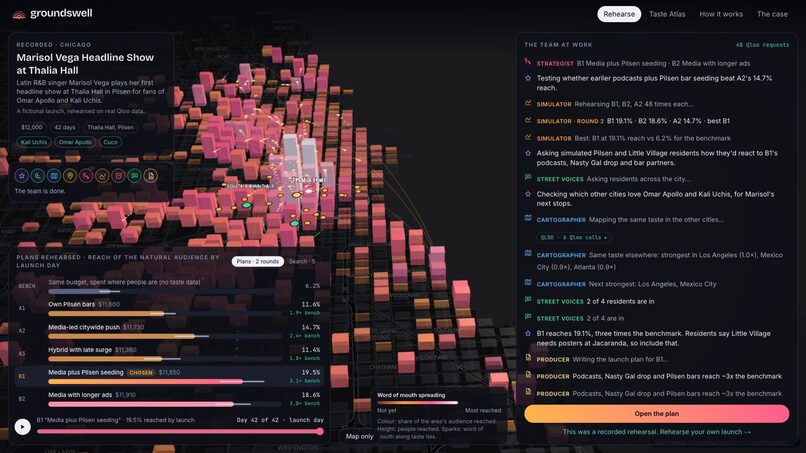
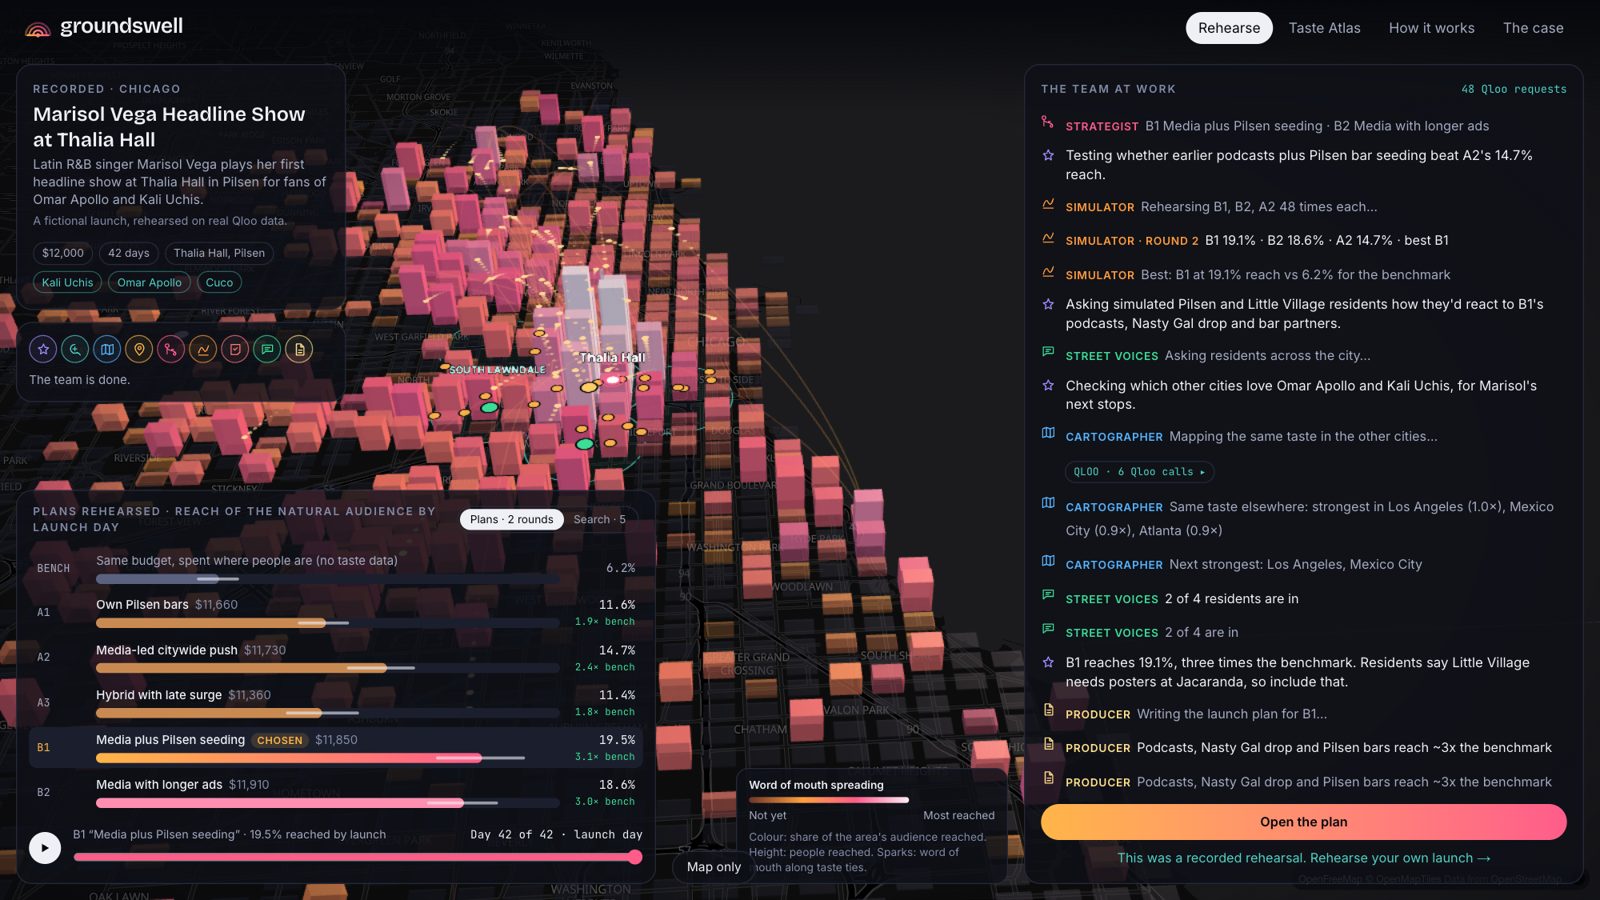
A rehearsal in Chicago: the hot neighbourhoods around Thalia Hall rise as word of mouth spreads, against the benchmark.
-
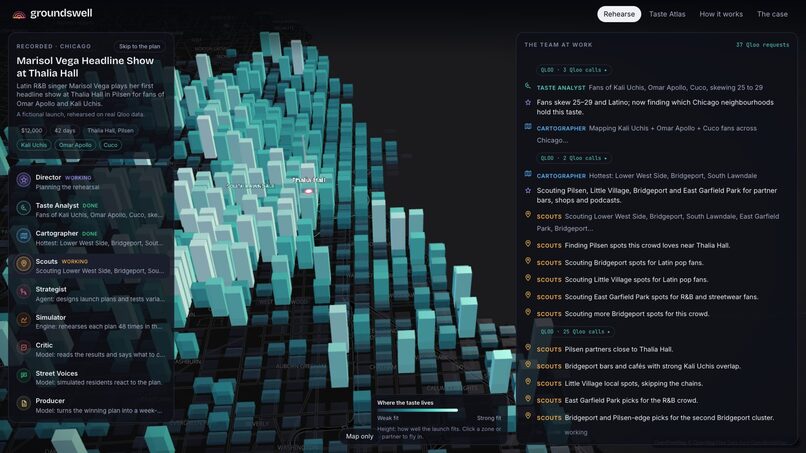
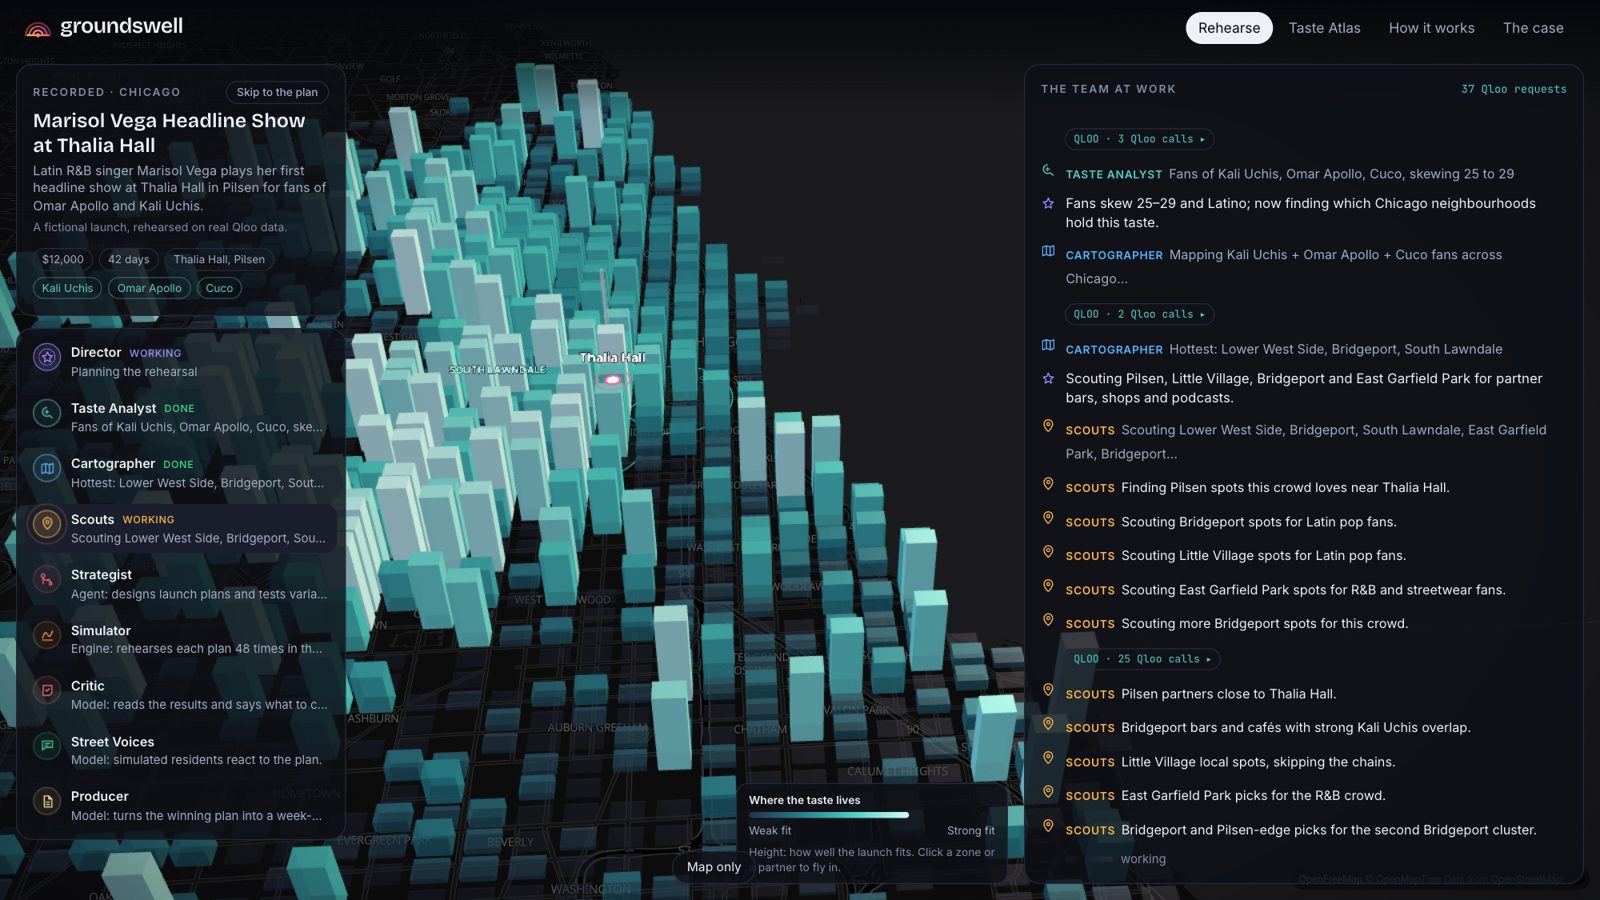
The team at work: Claude agents map where the taste lives on Qloo, with every Qloo request shown in the feed.
-
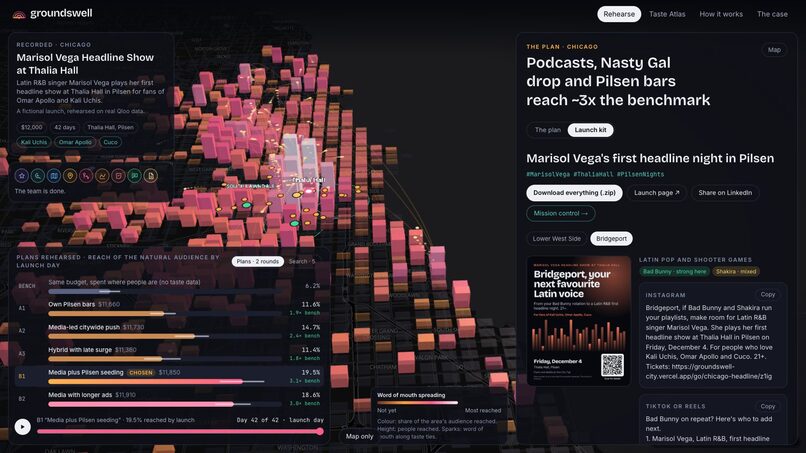
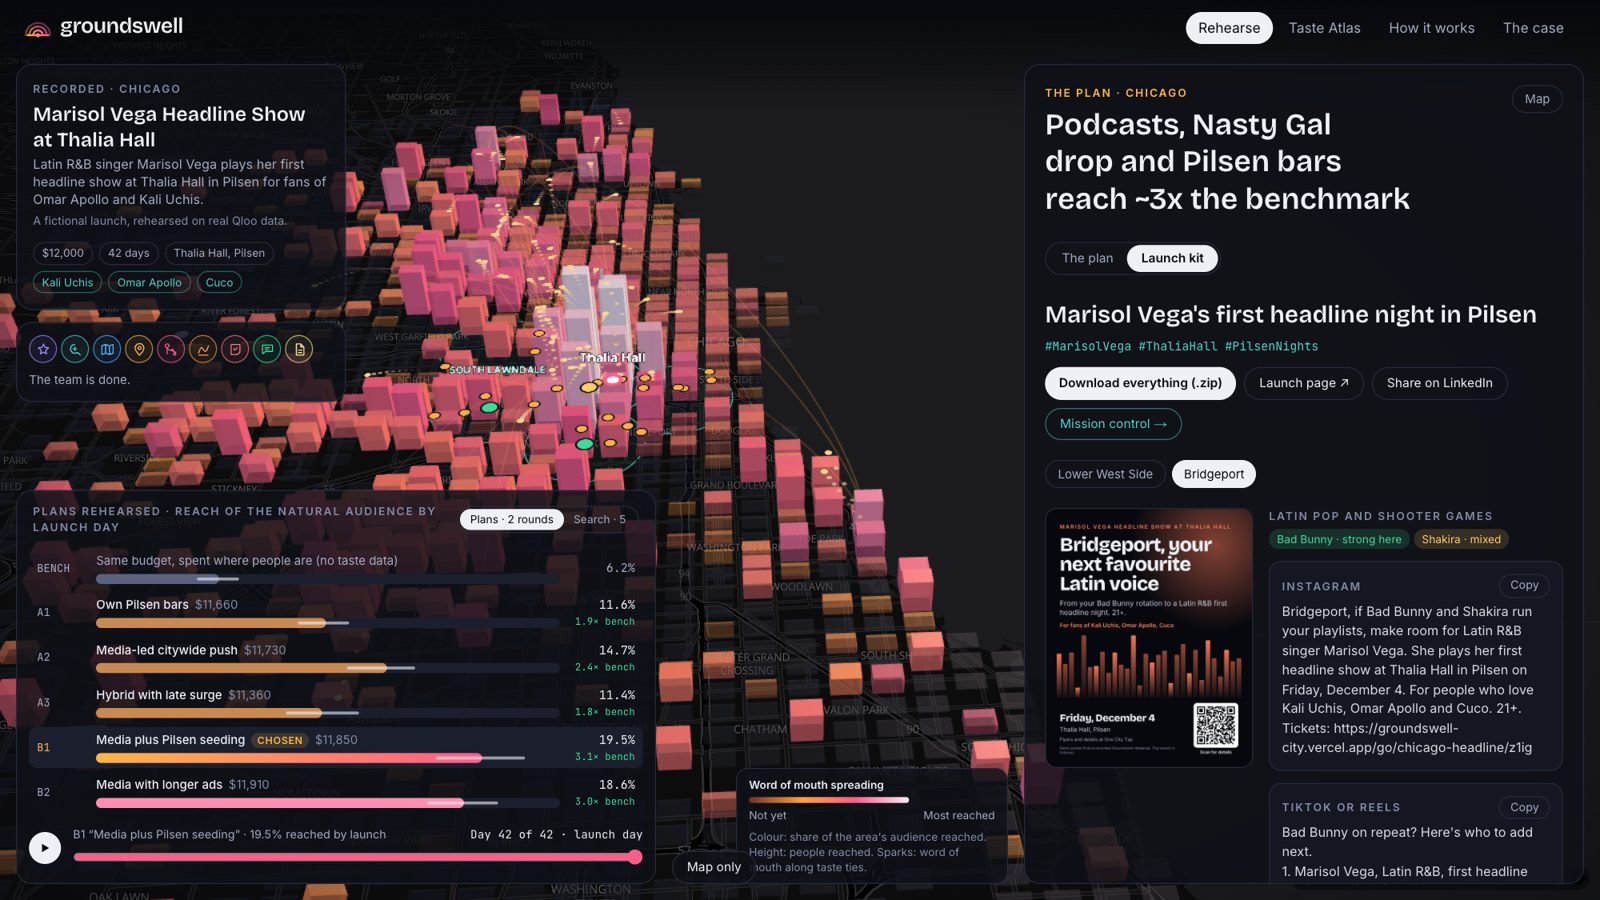
The launch kit: copy for Bridgeport, with each cultural reference checked on Qloo for that neighbourhood first.
-
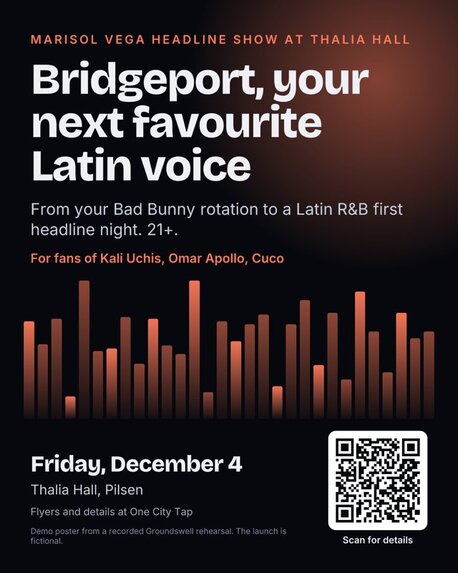
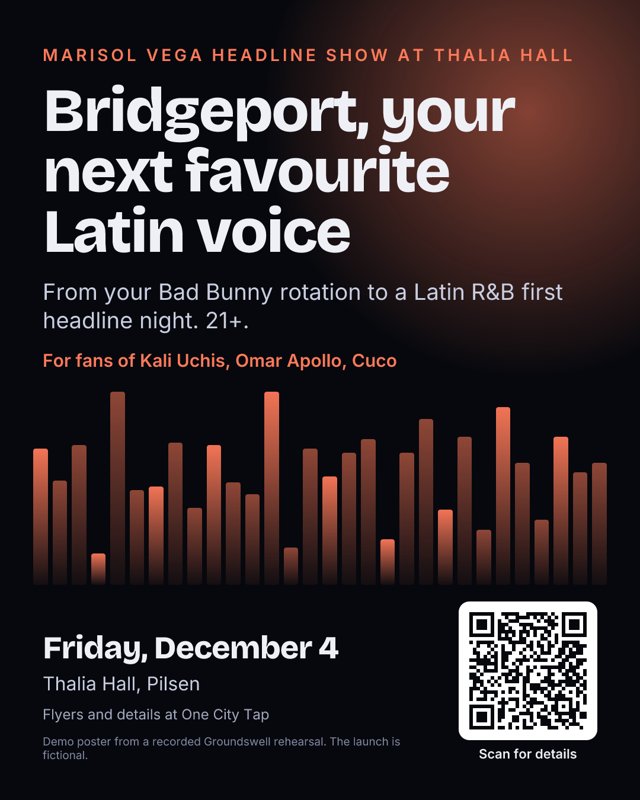
A generated poster with its own tracked QR code, one per partner place (demo launch, fictional).
-
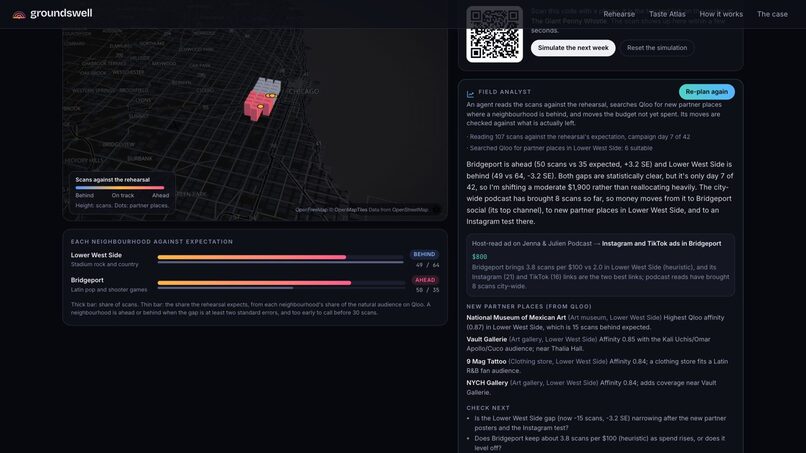
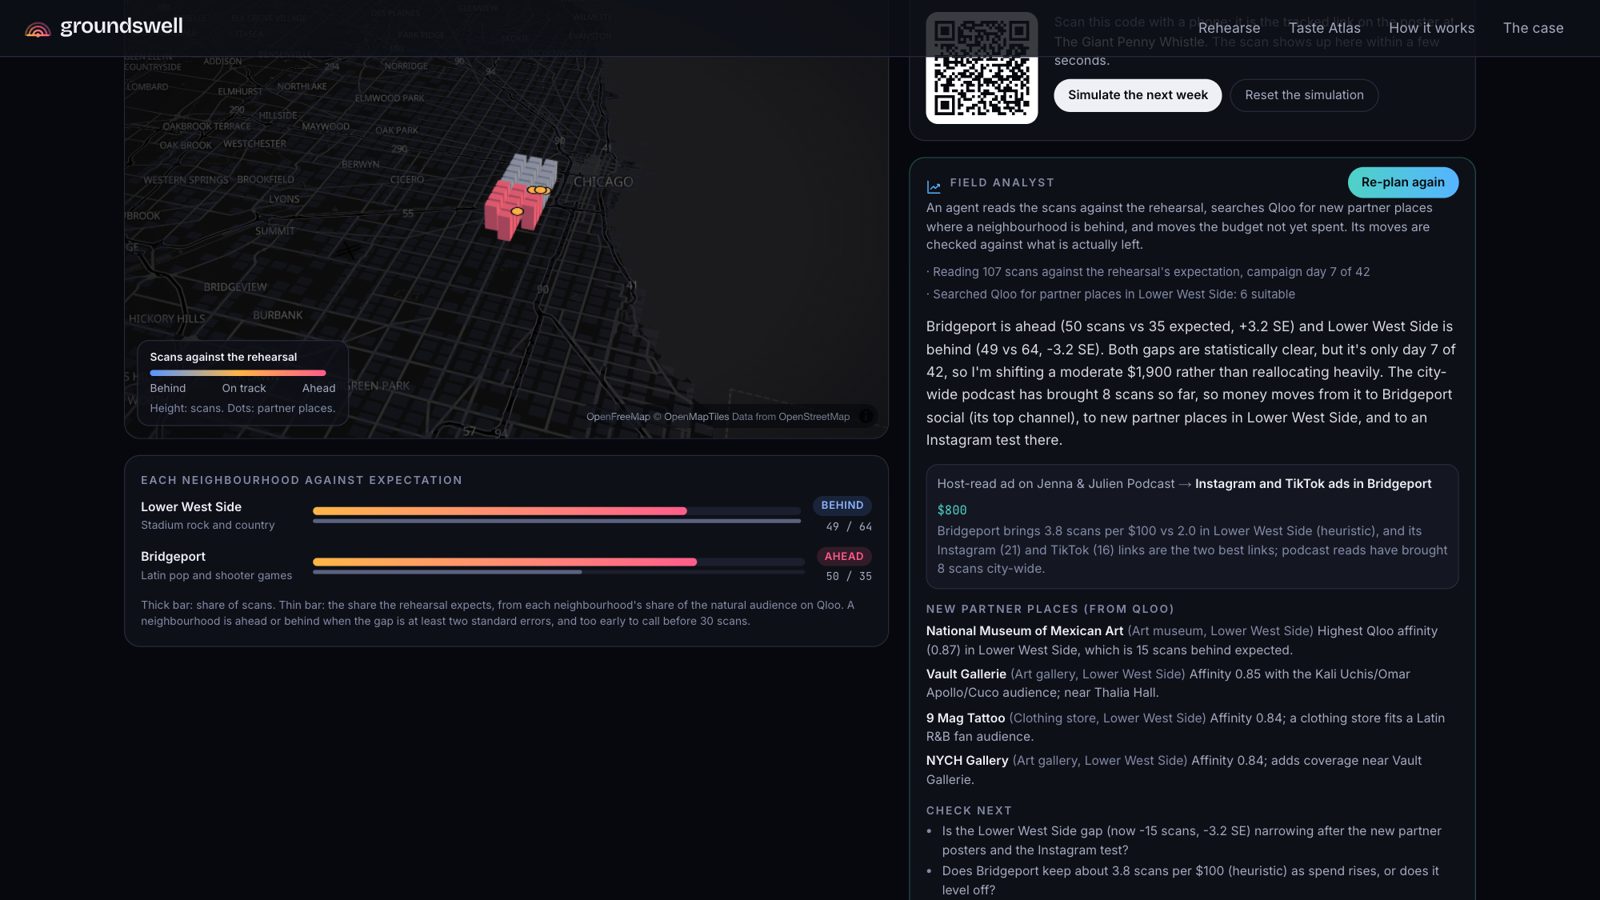
Mission control: scans per neighbourhood against expectation, and the Field Analyst's re-plan with new partners from Qloo.
-
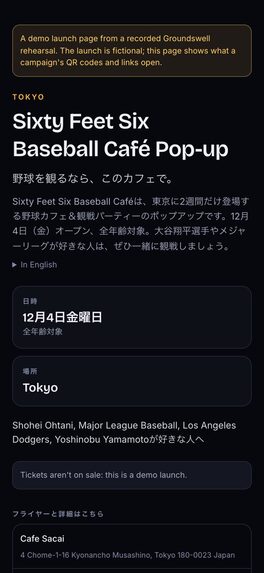
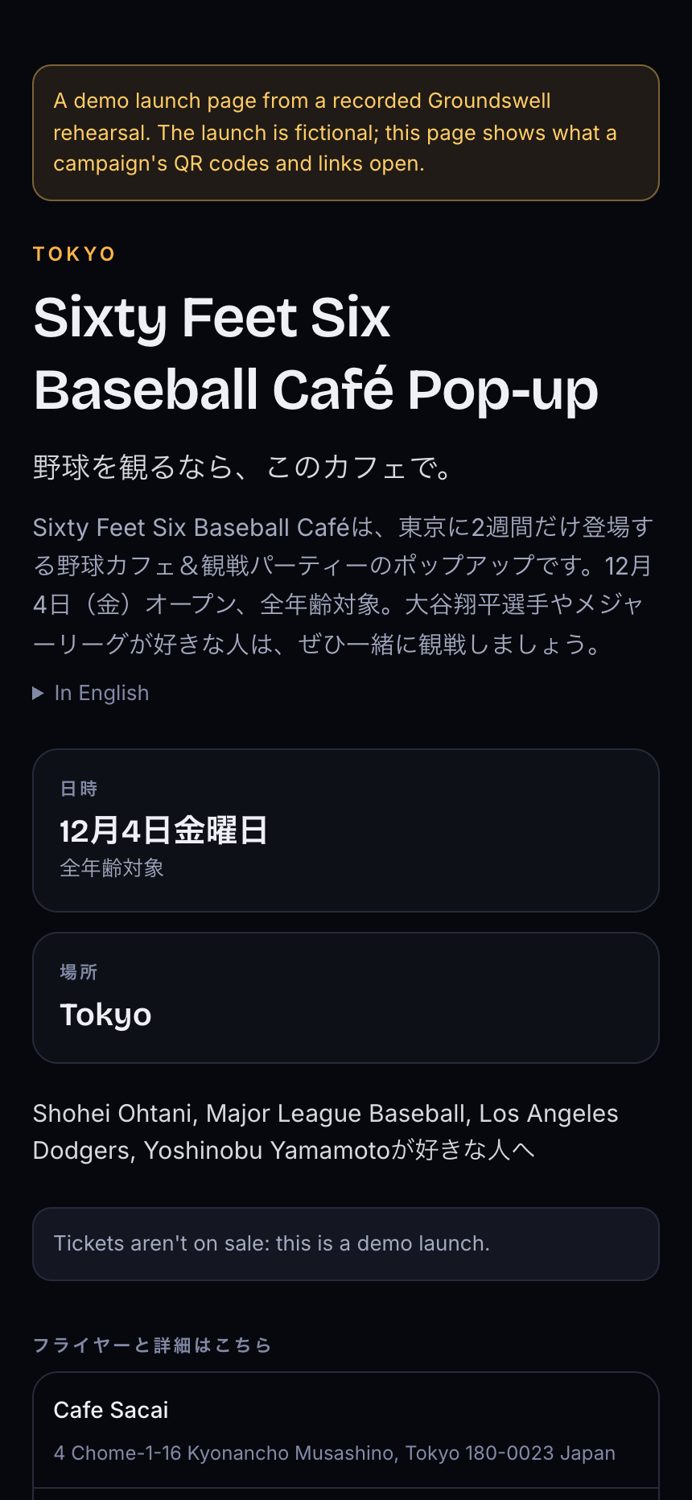
A launch page in Japanese for the Tokyo showcase, as a poster's QR code opens it.
-
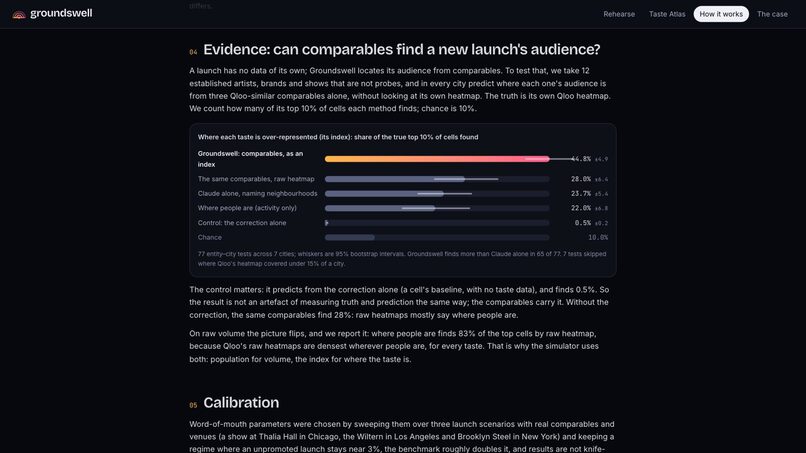
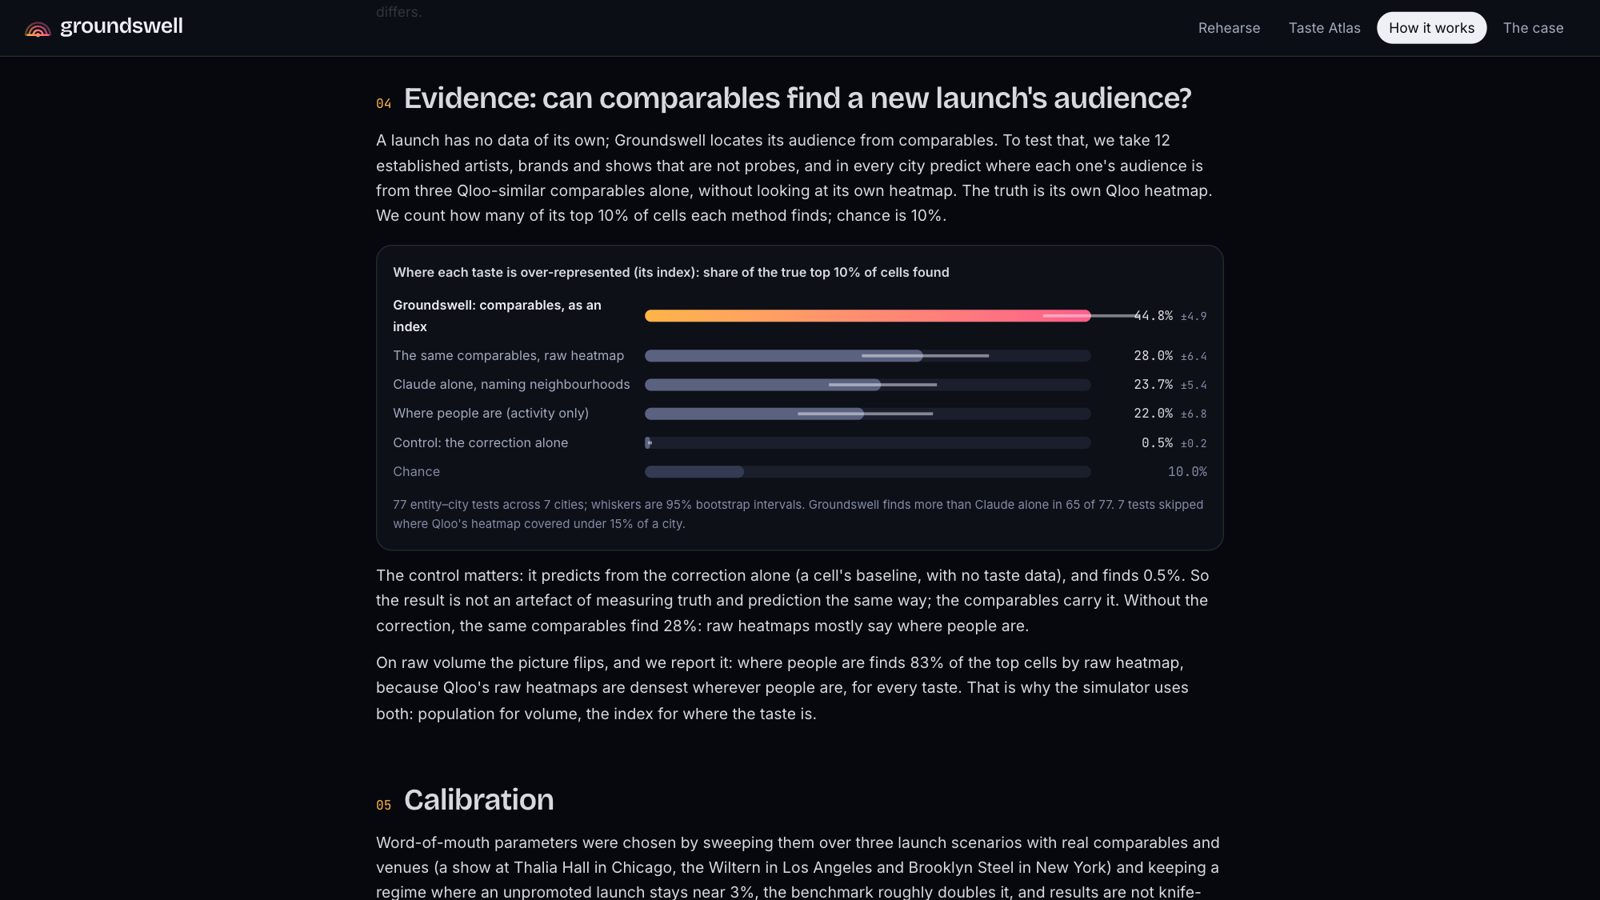
Evidence: from comparables alone, 44.8% of a taste's top neighbourhoods found, vs 23.7% for Claude alone (77 tests).
-
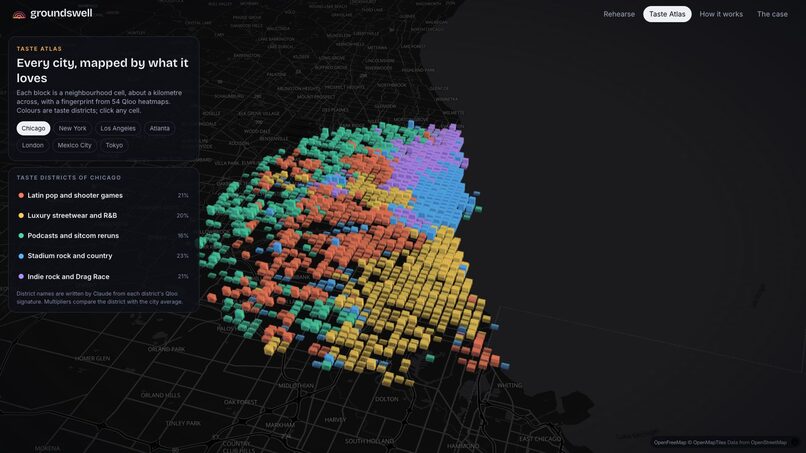
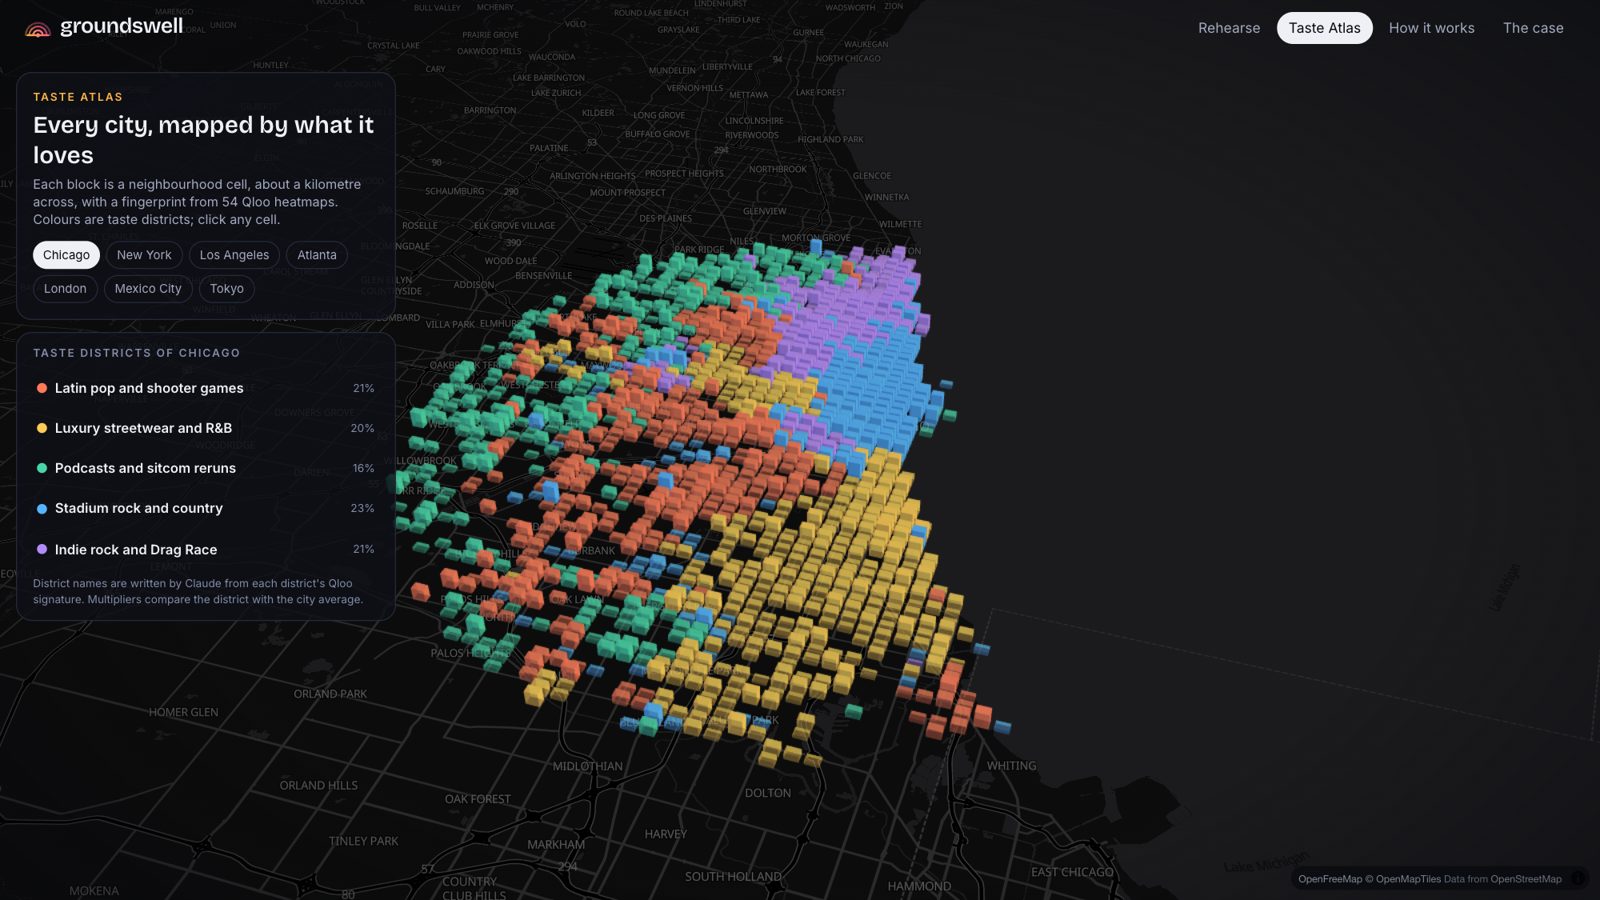
The Taste Atlas: Chicago's neighbourhoods coloured by taste district, from 54 Qloo heatmaps per city.
Inspiration
Every week thousands of things launch into cities: a singer's first headline show, a comedy night, a pop-up, a film's preview week. Most are planned on instinct. Where do the posters go? Which neighbourhood first? Which podcast? Big companies pay for research; the independent promoter, the comedian and the start-up guess, and the margin for guessing is thin. Only 36% of US independent venues were profitable in 2024, according to the National Independent Venue Association.
Pilots don't learn on real planes. They rehearse in a simulator faithful enough that what works there works outside. We wanted that for culture: a model of a real city that is faithful to what its neighbourhoods love, a team that rehearses a launch inside it before anyone spends money, and then the tools to run it and steer it.
Qloo made it possible. Its taste graph knows, at street level, where the people who love a given artist, show or brand live and go.
What it does
Rehearse. Describe a launch in a sentence and pick one of seven cities (Chicago, New York, Los Angeles, Atlanta, London, Mexico City, Tokyo). A team of Claude agents takes it from there while you watch on a live 3D map:
- The Taste Analyst chooses comparables Qloo covers well in that city and profiles their fans.
- The Cartographer maps where that taste is over-represented at neighbourhood level, corrected for where Qloo simply has more data, with distance to the venue.
- The Scouts pick real partner places in each hot zone, each with a role (poster spot, ticket outlet, pop-up host, street-team base, cross-promotion), plus the podcasts and brands the audience over-indexes on.
- The Strategist designs plans and tests variations in a simulator of word of mouth; each plan runs 48 times against a benchmark that spends the same budget where people are.
- The Critic sends changes back and the team runs a second round. Street Voices, simulated residents labelled as such, react. The Producer writes the week-by-week plan.
- The Director runs the team: it decides the order, retries what fails and decides when a plan is good enough.
You can edit the plan and re-run the simulation in your browser, and see where the same taste is strongest in the other six cities.
Launch. The Creative Director writes copy for each neighbourhood: poster, Instagram, TikTok or Reels, X or Threads, a podcast host-read and an email to each partner. Before it uses a cultural reference in a neighbourhood ("Bad Bunny on repeat?"), it checks that reference on Qloo for that neighbourhood, and its submit tool rejects references that are weak there, claims like "sold out", and assumptions about a partner it can't back. In Tokyo and Mexico City it writes in Japanese and Spanish, with English alongside. Code builds the rest: a poster per partner with its own tracked QR code, a launch page, an ad-targeting brief per neighbourhood, a calendar, and one zip.
Steer. Every poster, post and email carries its own tracked link. Mission control maps scans per neighbourhood against what the rehearsal expected and calls each one ahead, behind or too early, by a stated rule (two standard errors; nothing before 30 scans). The Field Analyst reads that, searches Qloo for new partner places where a neighbourhood is behind, and moves the budget that hasn't been spent; the tool checks every move against what each action has left. Scan a poster's QR code with your phone and it shows up within seconds; "simulate a week" adds labelled synthetic scans for a demo.
Also: a Taste Atlas of the seven cities with taste districts and cross-city twins, seven recorded rehearsals with their launch kits (fictional launches on real data, so they open instantly), saved and shareable live runs, and an MCP server so other agents can map audiences, scout partners or run a full rehearsal.
How we built it
The city model. For each city we pull Qloo heatmaps (filter.type=urn:heatmap, a point and radius) for 54 probe entities that span taste: artists, TV shows, brands, games, podcasts and athletes. That gives 10,636 neighbourhood cells, each with a taste fingerprint. Qloo returns a cell only where it has data, so busy downtown cells appear for everything; we correct each probe for that density before clustering cells into taste districts (named by Claude from the signature only) and tying each cell to its most taste-similar cells across town.
Where a launch lands. A cell's fit is its percentile for the comparables minus what it shows for everything: an index of where the taste is over-represented. Population comes separately, and a venue adds Huff-style distance decay.
The simulation. @groundswell/sim, a dependency-free package in the repo: a stochastic, spatial Bass diffusion with complex contagion, fading buzz, binomial draws and Monte Carlo bands. Every adopter is credited to an action, word of mouth or organic discovery. It runs on the server for the agents and in the browser for what-if edits.
The agents. Claude (claude-opus-5-5) through the Anthropic SDK's tool runner and structured outputs. Six are agents that choose their own tools: Director, Taste Analyst, Scouts, Strategist, Creative Director and Field Analyst. Critic, Street Voices and Producer are single structured calls. Rules live in the tools: plans use only what the scouts found, fit the budget, and need two rounds of plan → simulate → critique; partners exclude schools, places of worship, clinics, gun and cannabis shops, bars for all-ages briefs and children's places for adult ones; the kit and re-plan tools check their inputs as described above. A live rehearsal has a time budget so it fits a 300-second serverless limit, and agents stop the moment they submit.
The app. Next.js 15 and React 19, deck.gl on MapLibre for the 3D city, server-sent events streaming every agent step and every Qloo request, next/og posters with bundled fonts and QR codes, Postgres (Neon) for campaigns, scans and saved runs.
Evidence (how we know the core idea works)
A launch has no data of its own; everything rests on finding its audience from comparables. So we tested exactly that. For 12 established artists, brands and shows (not probes) in each of 7 cities, we predicted where each one is most over-represented from three Qloo-similar comparables alone, without looking at its own heatmap, then compared with its real Qloo heatmap.
| Method | Share of the true top 10% of neighbourhoods found |
|---|---|
| Groundswell | 44.8% (95% CI 40.0–49.8) |
| Claude alone, naming neighbourhoods | 23.7% |
| Going where people are | 22.0% |
| Chance | 10% |
Groundswell beats Claude alone in 65 of 77 tests and leads in every city. A control that uses only our density correction finds 0.5%, so the result comes from the comparables, not from how we measured. We report where it loses too: on raw volume, "where people are" wins, because Qloo's raw heatmaps are densest wherever people are; that's why the simulator multiplies population by the index.
In the seven recorded rehearsals, the final plans reach 2.3–4.6× more of the natural audience than the same budget spent where people are, in simulation.
Challenges we ran into
- Qloo's heatmaps are densest where Qloo has the most data. Niche probes show up mostly in busy cells, so a naive city model mislabels downtown. Correcting each probe for data density, and clustering only on probes that cover most of a city, fixed it; the same insight became the fit index the benchmark validates.
- A knife-edge simulation. Our first version either fizzled or swallowed the city. Fading buzz, complex contagion, realistic per-day conversion for each channel and a parameter sweep over three launch scenarios gave a regime that isn't knife-edge.
- Copy that sounds local without making things up. A model writing "Bad Bunny on repeat?" for Bridgeport is only useful if it's true there. Making the Creative Director check each reference on Qloo for that neighbourhood, and rejecting unbacked claims in its submit tool, turned a style choice into a data-backed one.
- Honest numbers. The simulation's population scale is arbitrary, so agents report reach of the natural audience and cost per point of reach, never head-counts or tickets. Mission control says "too early" instead of guessing.
- Time. A rehearsal must finish inside a serverless limit, so the Director has a time budget, the Strategist batches its simulator tests, and every agent stops the moment it submits.
Accomplishments we're proud of
- A validated core: comparables plus our correction find about twice as many of a taste's top neighbourhoods as Claude alone or going where people are, with a control that rules out a measurement artefact.
- Agents that act on a model of the world, not just text: the Strategist tests ideas in the simulator, the Creative Director tests its references on Qloo, the Field Analyst re-plans against what's actually left.
- A whole loop, from a sentence to a running campaign that learns: rehearse, launch, steer.
- Seven cities on three continents, built entirely from Qloo, with copy in each city's language.
What we learned
- Qloo's heatmaps carry two signals at once: where people are and where a taste is over-represented. Separating them is what makes the second useful.
- Geography changes what works: seeding the hot neighbourhoods reached about 13% in Chicago and New York but 7% in sprawling Los Angeles in our calibration scenarios.
- Agents get much better when they can test ideas against a model, and much more trustworthy when their submit tools refuse what they can't back.
What's next
- Real outcomes. Mission control already records scans per neighbourhood and channel; with ticket sales from promoters and venues, the same data can calibrate each channel's effect per city.
- More cities, built on demand with the same pipeline (108 Qloo requests each).
- Census population where it exists, in place of the activity-based proxy.
- Integrations where launches are planned: ticketing platforms and promoter tools, through the API and the MCP server.
The business (planned, not built)
Free rehearsals; a per-launch fee for the kit and mission control; ticketing platforms and promoters calling it per rehearsal through the API or MCP. The atlas compounds: every city added and every real outcome fed back makes the next rehearsal more faithful.
Try it
- Live app: https://groundswell-city.vercel.app
- A recorded rehearsal, end to end: https://groundswell-city.vercel.app/rehearse/chicago-headline
- Its mission control: https://groundswell-city.vercel.app/campaign/chicago-headline
- How it works, with the evidence: https://groundswell-city.vercel.app/method
- The business case, with sources: https://groundswell-city.vercel.app/pitch
- Code: https://github.com/TusharTechs/groundswell (every claim mapped to code or data in docs/CLAIMS.md)
Built With
- anthropic
- claude
- deck.gl
- maplibre
- model-context-protocol
- neon
- next.js
- openfreemap
- postgresql
- qloo
- react
- tailwindcss
- typescript
- vercel
- vitest
- zod

Log in or sign up for Devpost to join the conversation.