Inspiration
Earthquakes are reduced to numbers. Magnitude, depth, distance. Useful, but detached. They do not answer the question people actually have which is simple. What would it feel like where I am.
I wanted to close that gap. Not with a map or a chart, but with something immediate and physical. If seismic simulations already exist at high resolution, there should be a way to translate them into something intuitive. Something you can see and understand instantly.
Ground Truth came from that idea. If you give me an address, I should be able to show you how that exact location moves.
What it does
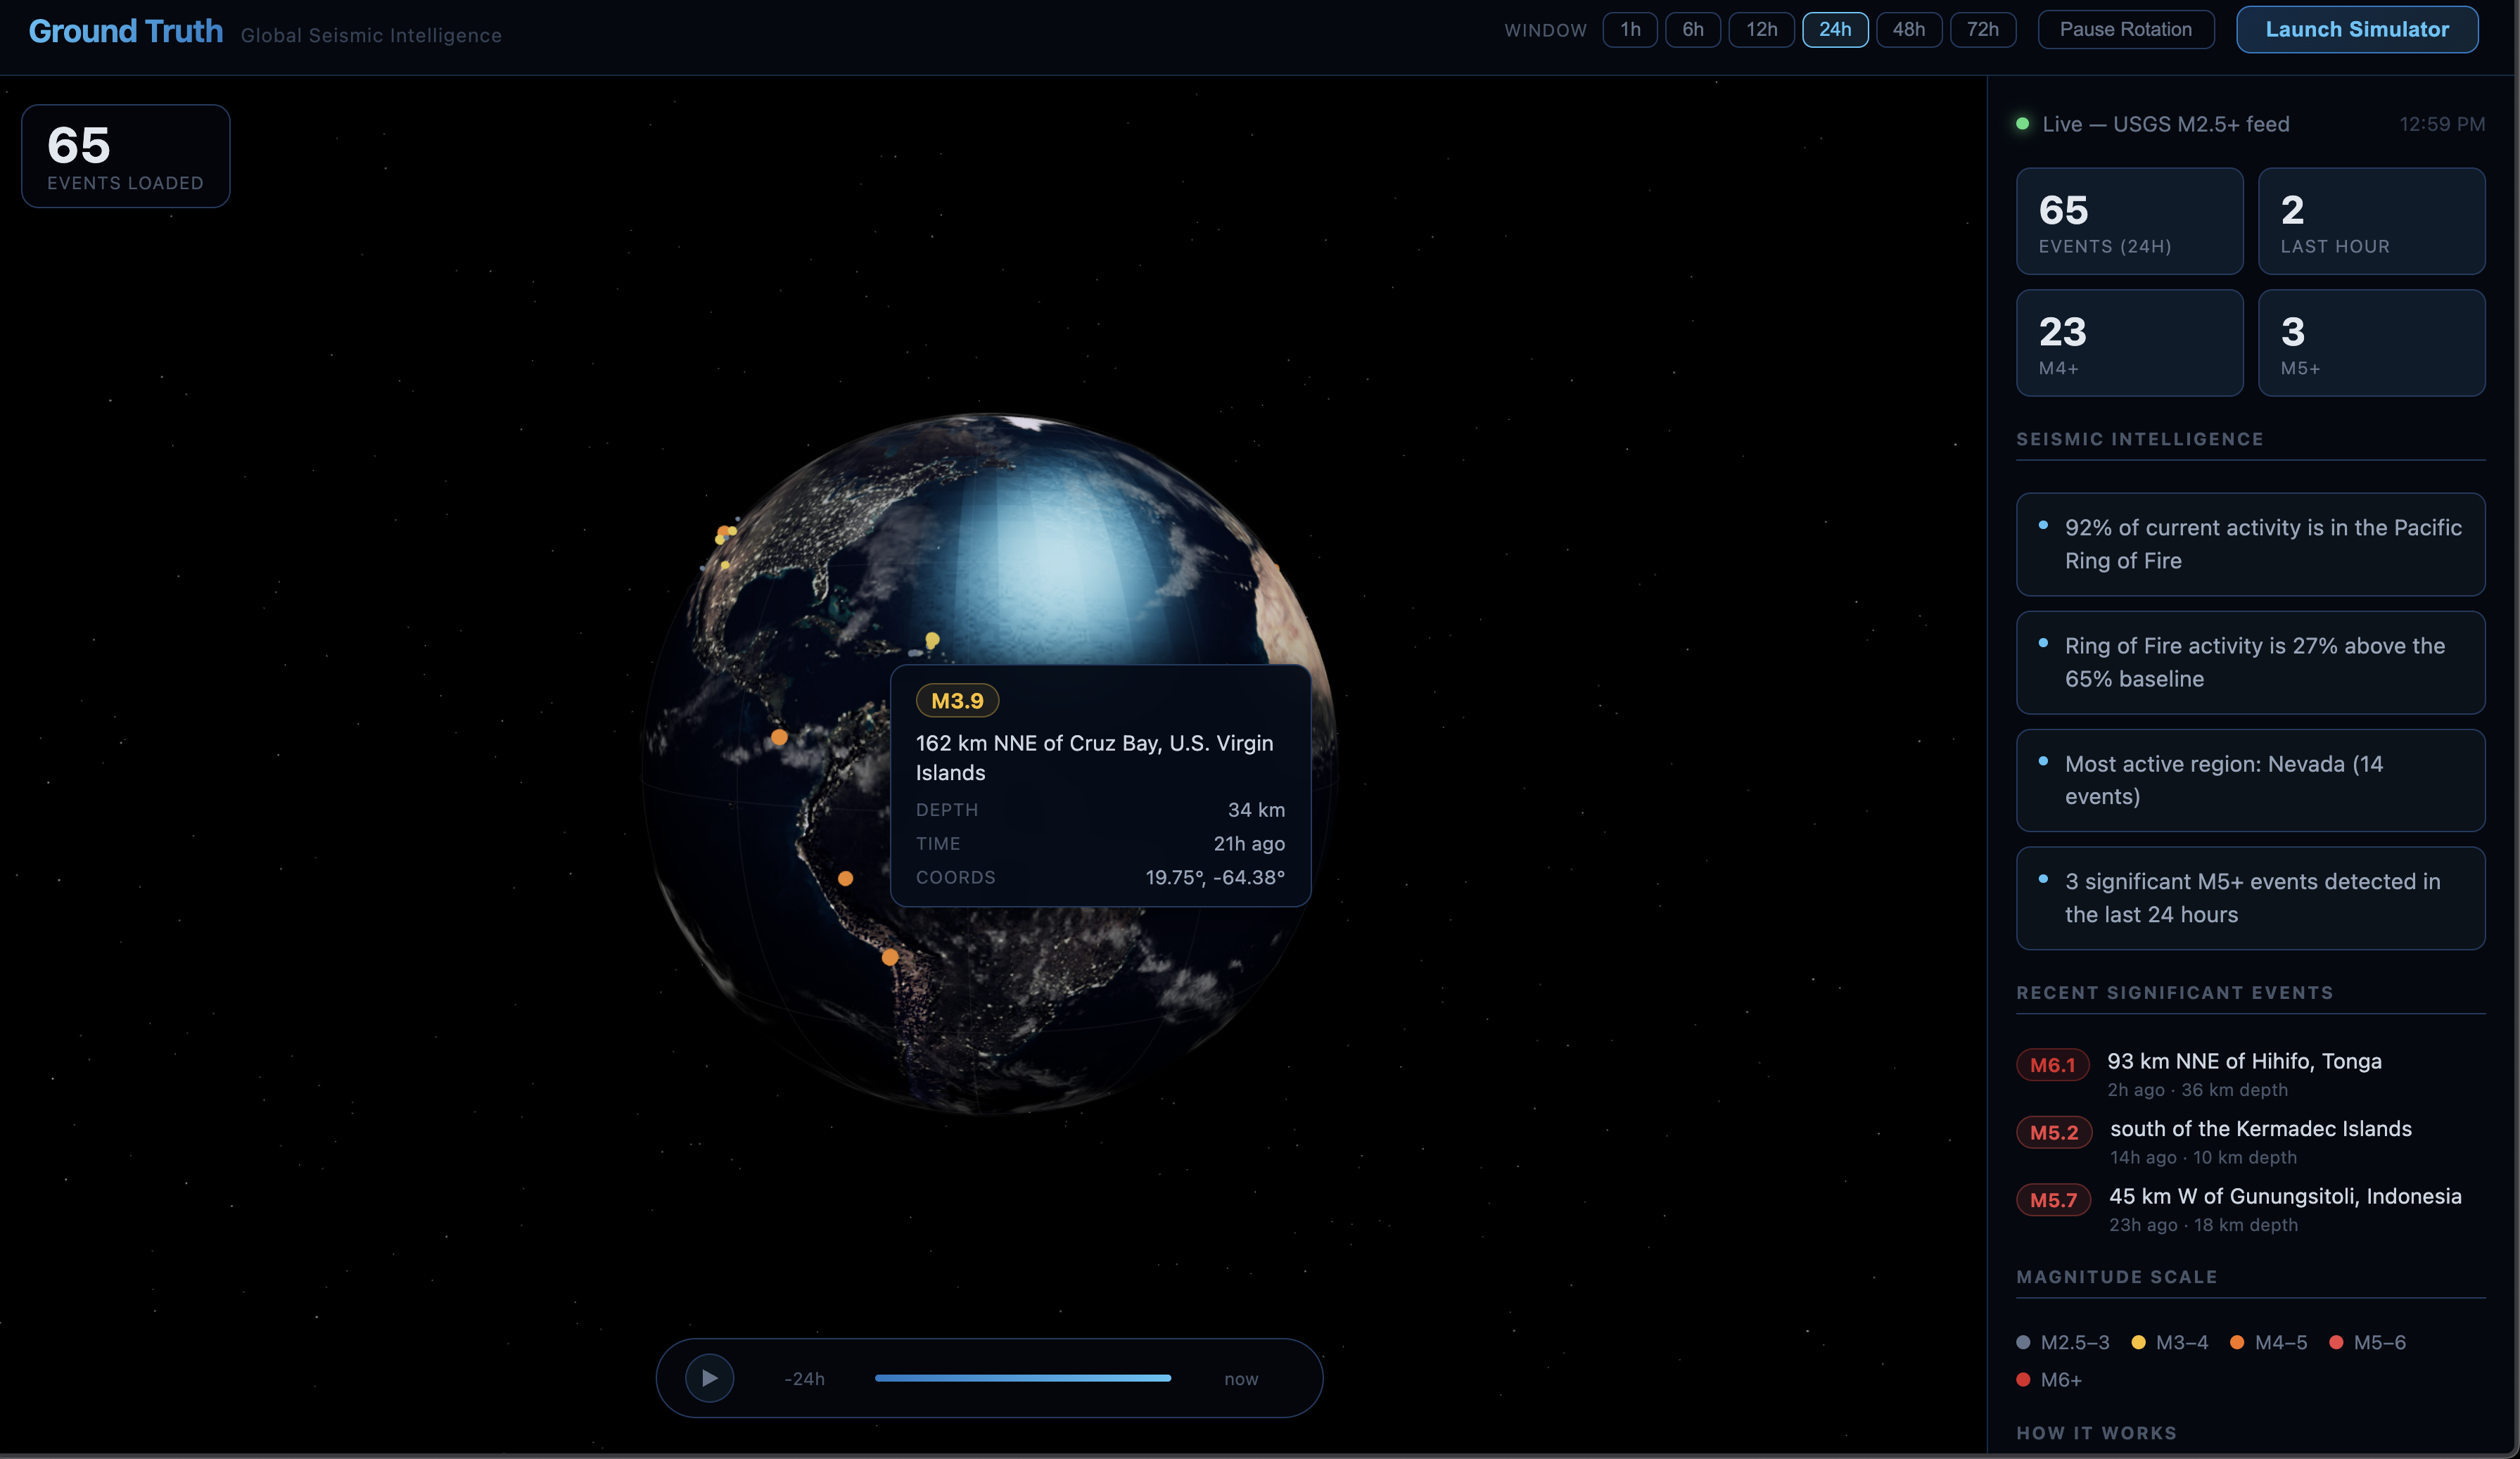
Ground Truth is a real time seismic visualization engine that converts any address into a physically scaled building response.
It has four core components:
Geocoding layer
An address is converted into latitude and longitude using Nominatim. The system takes raw human input and resolves it into coordinates with a single stateless request.
Seismic lookup engine
The coordinates are mapped to the nearest point in the Scripps ground velocity grid stored in Snowflake. A single SQL query computes distance across all grid points and returns the closest match in under a second.
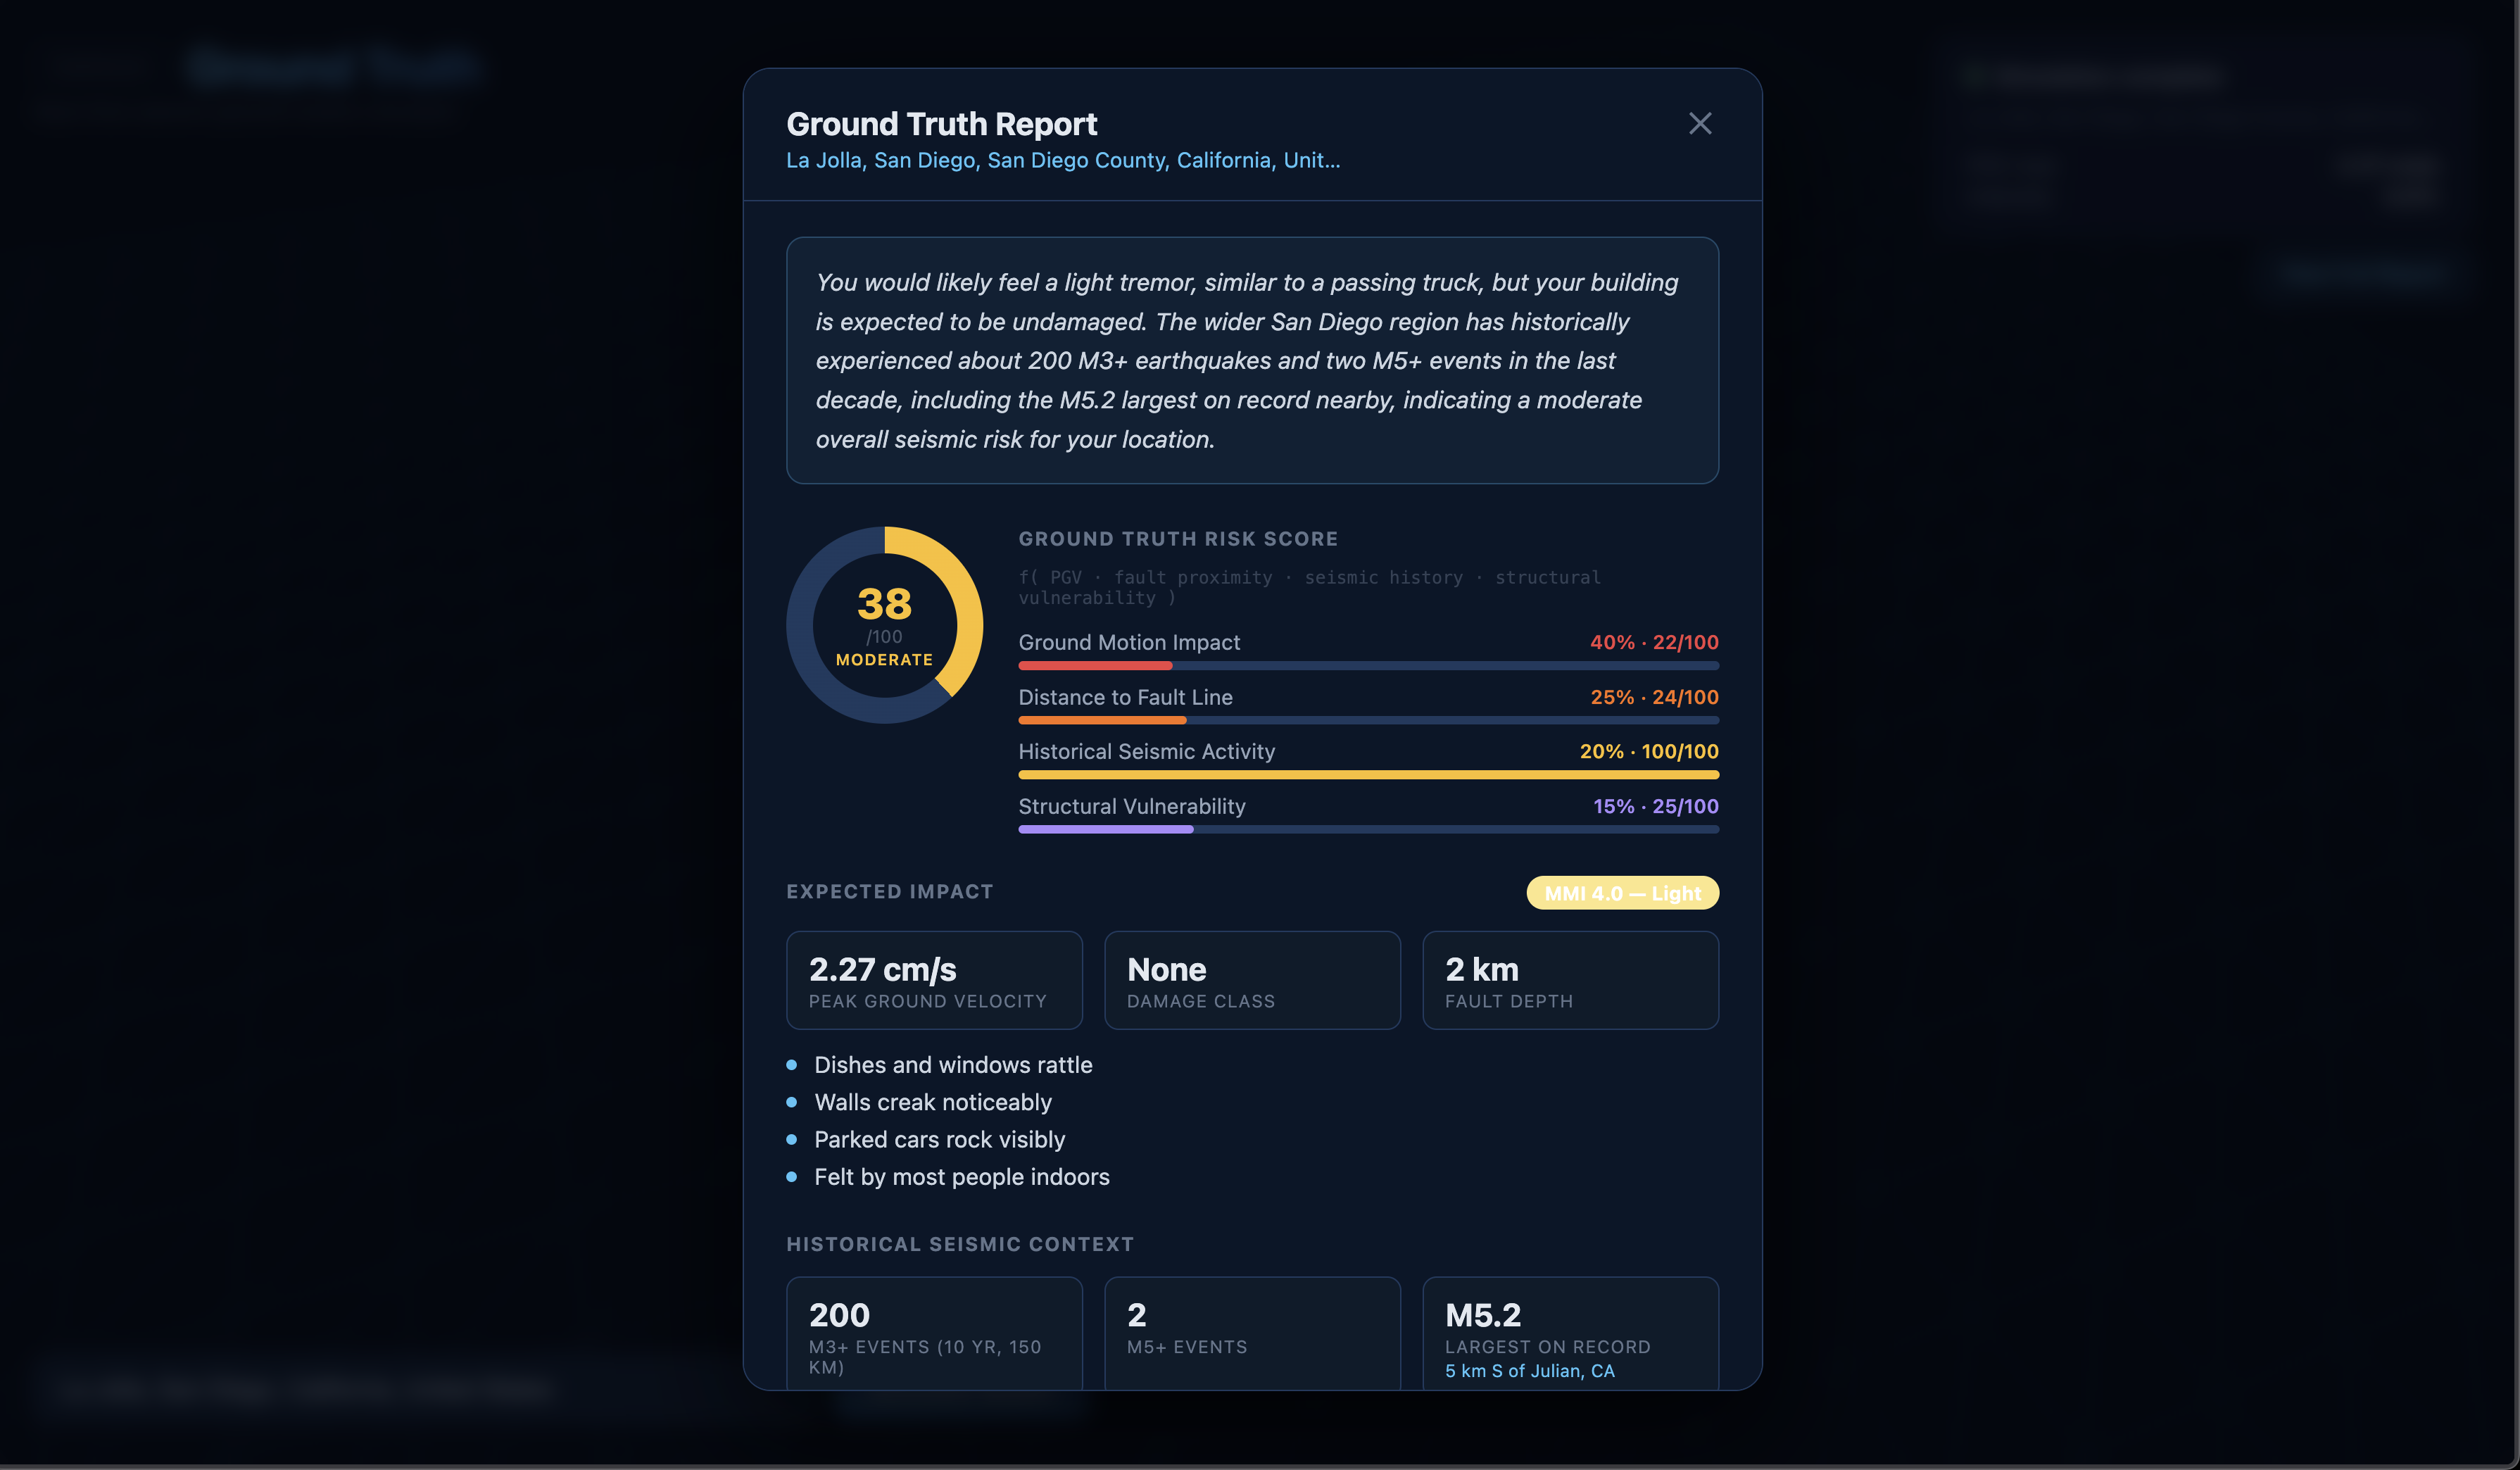
Intensity model
Raw peak ground velocity values are transformed using a logarithmic scale to normalize extreme differences. This produces a stable intensity value between 0 and 1 and maps it to a Modified Mercalli category for readability.
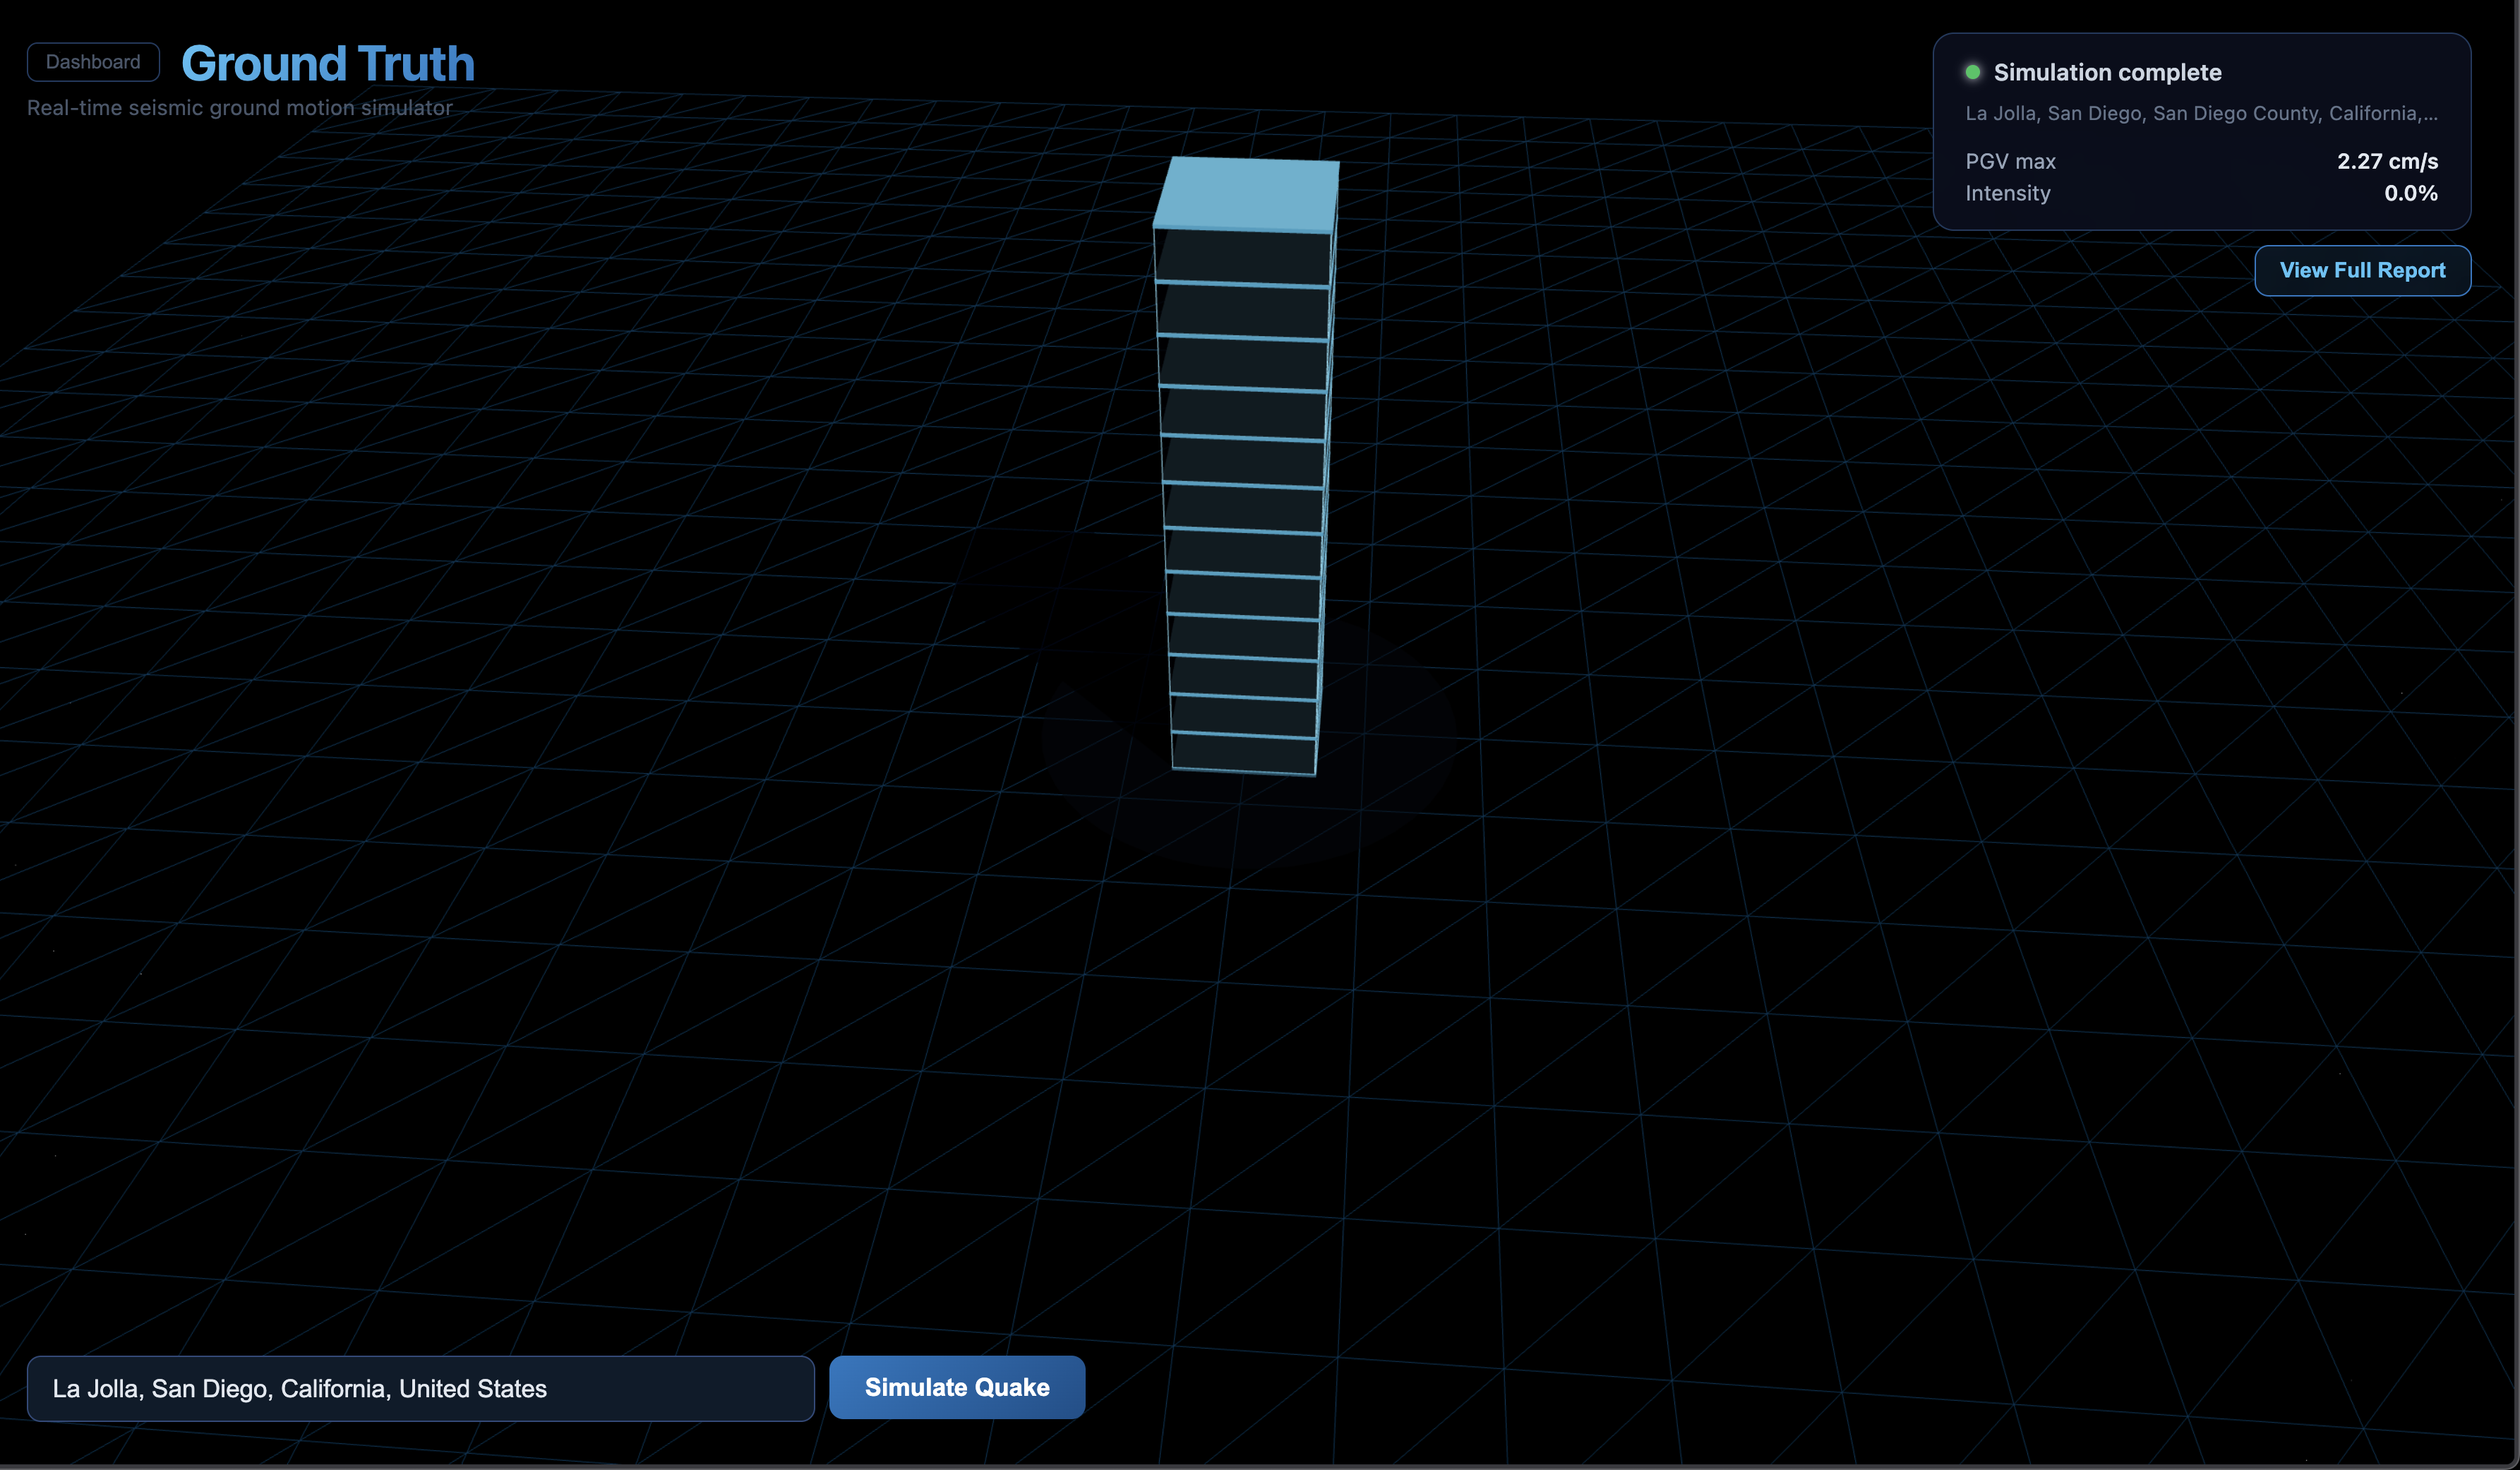
Dynamic rendering system
The frontend generates a custom animation at runtime based on intensity. Amplitude, frequency, and motion profile all scale with the data so every address produces a unique physical response.
How we built it
The system is designed as a minimal pipeline where each component exists only to move data forward with as little latency as possible.
Backend
Flask serves a single HTML page and a JSON API. The goal was to keep the backend thin and predictable. No unnecessary abstraction, no database layers beyond what is required.
Geocoding
Nominatim is called through a simple HTTP request. The first result is parsed and passed directly into the next stage. No caching or batching since the system is optimized for single interactive queries.
Data layer
Snowflake stores the seismic grid. The query computes squared Euclidean distance between the input coordinates and every grid point, then returns the nearest one. At this scale, simple math in SQL is faster than introducing specialized geospatial tooling.
Computation
The intensity calculation applies a log transformation to compress the PGV range into something visually meaningful. This is the core translation layer between physical data and perception.
Frontend
A single HTML file with inline JavaScript and SVG. No framework, no build step. This allows direct control over animation behavior and fast iteration during development.
Rendering
The building is an SVG anchored at its base so motion feels grounded. JavaScript generates a keyframes animation dynamically where displacement scales with intensity. Higher intensities introduce vertical jitter and slower oscillations to reflect real seismic motion.
Micro interactions
Window flickering is triggered at higher intensities using randomized timing. It is a small detail that adds disproportionate realism to the scene.
Challenges we ran into
Perceptual scaling
Raw seismic values do not translate cleanly into motion. Linear mappings made most inputs invisible. Finding a transformation that preserved differences while remaining visible required iteration.
Latency across the pipeline
Each step is fast on its own but chaining them creates compounded delay. The system had to be designed so no step became a bottleneck.
Avoiding overengineering
There was constant pressure to add spatial indexing, caching, or a frontend framework. In practice, each addition increased complexity without improving performance for the use case.
Animation realism
Early versions looked mechanical. Making the motion feel believable required tuning amplitude, frequency, and randomness rather than just increasing displacement.
Accomplishments that we're proud of
Built a complete input to visualization pipeline that runs in near real time
Translated real seismic simulation data into a perceptible and intuitive visual system
Achieved sub second data resolution using only simple SQL and direct API calls
Created a dynamic animation system where every input produces a unique response
Designed a zero friction interface with no setup, no login, and no learning curve
What we learned
That simplicity is often the fastest path to performance in latency sensitive systems
That physical data needs transformation before it becomes meaningful to humans
That SQL can handle spatial problems effectively at moderate scale without specialized tools
That realism in interfaces comes more from motion behavior than visual complexity
What's next for Ground Truth
Model improvements
Introduce interpolation between grid points for smoother spatial transitions
Incorporate magnitude and depth into the intensity model for more accurate responses
Rendering fidelity
Differentiate building types with unique motion profiles
Add frequency based motion characteristics to better reflect real seismic waves
Interface expansion
Move from address input to an interactive map for spatial exploration
Support multiple simultaneous locations to visualize regional impact
System evolution
Introduce caching and parallel queries for higher throughput
Expand beyond Southern California as more seismic datasets become available
Ground Truth should become a system where seismic data is not just observed but experienced.

Log in or sign up for Devpost to join the conversation.