-
-
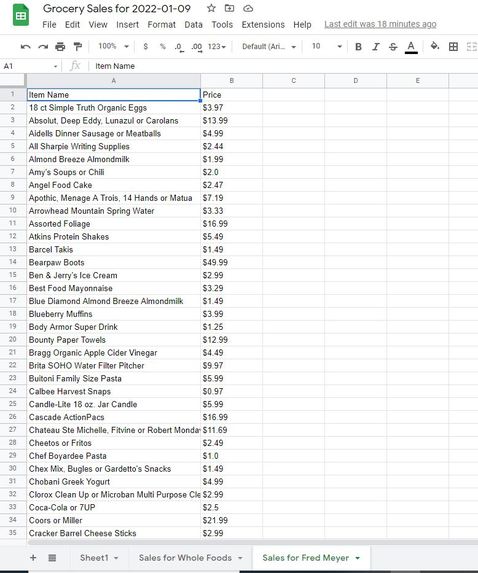
Output sales data information

Inspiration
One of the biggest stories of 2021 was inflation and the rising cost of everything. As a frugal shopper I thought it would be valuable to able to quickly aggregate the grocery weekly sales ads into a spreadsheet to help swiftly find good deals.
What it does
This project is pretty simple. It will take a users current zip code as a parameter (USA only) and then pull the weekly sales data for the closest store to that zip code for a chosen grocery store. Right now the project can only pull data for Whole Foods and Fred Meyer though my ambition was to be able to also grab from other major chains. The program will then create a google sheet spreadsheet of the sales data for the stores and populate separate worksheets for it. One spreadsheet per store and one worksheet per day. Right now the data is stored in two columns, one for the items name and another for the price. Data for items from Fred Meyer are also cleaned and those that are marked as "2 for 3" etc. are recalculated for their cost as just one item.
How I built it
I built this using Python and utilizing a combination of selenium, beautiful soup, and gspread. I used selenium to navigate each site as each site had different pop-ups or zip-code search bars that needed to be automatically filled in before navigating to the right stores sales flyer. Selenium would then pass off the page source data directly to beautiful soup which would then pull out the relevant sales data from the html. I wrote some additional code in Python to clean the data up a bit and organize them in lists which are then passed to a class I built for gspread which creates a new workbook with today's date and spreadsheets within the workbook for each store the user calls.
Challenges I ran into
So many challenges! First I was definitely less motivated by myself to marathon code for this project and other obligations throughout the time period meant I didn't have that much time to work on this project.
While I had ambitions of categorizing my sales data and perhaps even creating some price visualizations I actually ran into an early hurdle which turned out to be my biggest challenge. As this was my first time really using any of these tools before and my lack of familiarity with HTML/CSS meant I ran into a lot of headaches trying to figure out how to program the right commands into selenium to click on a search bar or a search result from a drop down menu. Most of my time was spent fiddling around trying to get just one click to work so a page would successfully navigate.
I also ran into a wall on how to pull out data when JavaScript renders the sales flyer and the information is not immediately available in the page source HTML, this prevented me from getting more grocery store chains into the project as I could not figure out how to pull their flyer information that was available from Inspect Element but not page source.
Accomplishments that I'm proud of
I am actually pretty proud I got this project working at all as it was pretty tough getting the websites and their data set up. The google sheets portion of the project actually turned out the easiest, though that is perhaps because I have done the least with that part. I am proud of how much I learned from all this despite all the challenges to build a pretty simple project as this was my first time doing any of this.
What I learned
I've never used selenium, beautiful soup, or gspread before and this was my first time building a web scraper or a data collection engine and collator before so I learned a lot about all those tools and how to read documentation for them. I also learned quite a bit more about HTML/CSS, for example I did not know what an iframe or a modal was before this. Would probably have been helpful to do this project after taking web development!
What's next:
I hope to expand on this project in the future, completing the scraper portion for more grocery store websites, expanding the data collected, the cleaning of the items so that they have information such as their brand or type (produce, meat etc) classified as well. I also hope to have this project eventually have an additional feature to analyze sales data over time to provide a picture of how deals compare to similar deals in the past for those items and trends in food prices or what goes on sale.
Built With
- beautiful-soup
- gspread
- python
- selenium
