-
-
Socio-Demographics Mode
-
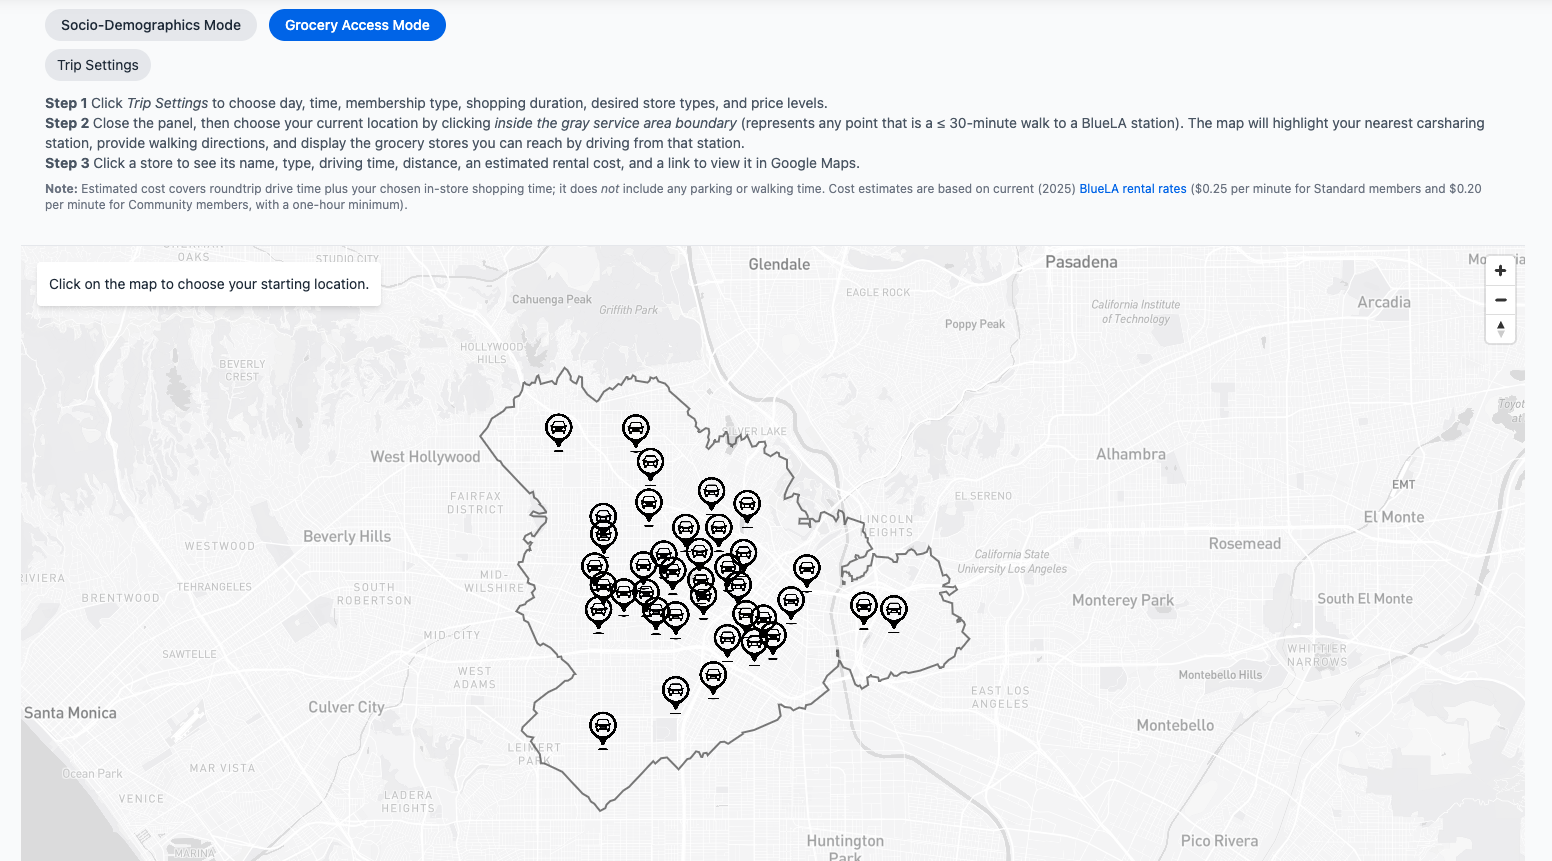
Grocery Access Mode - Overview
-

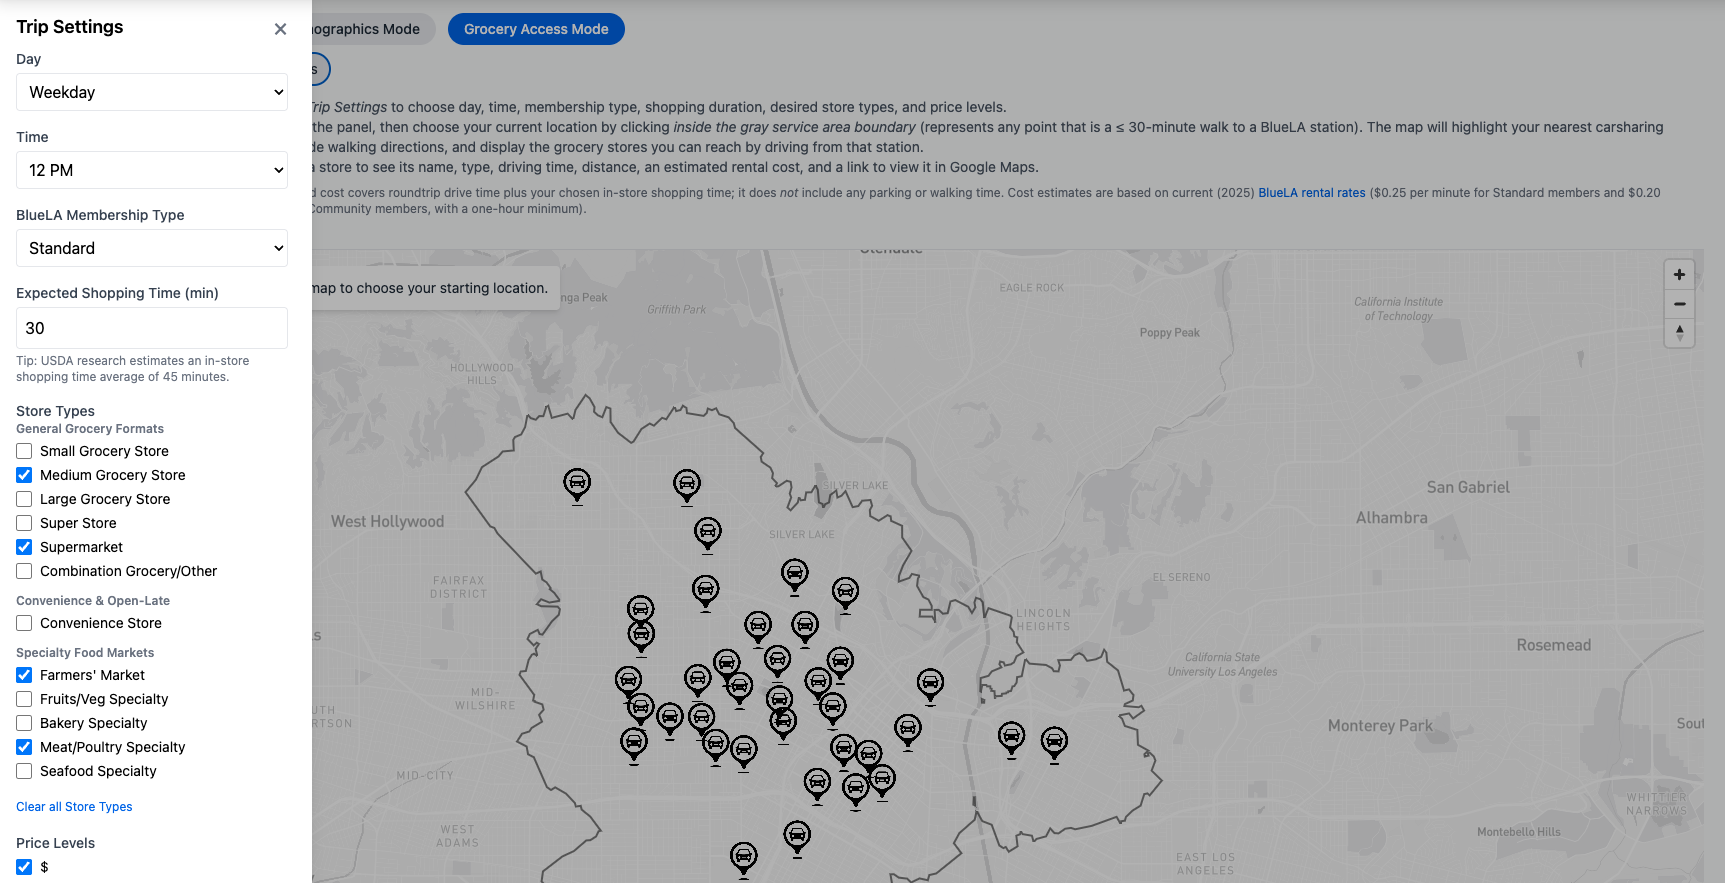
Grocery Access Mode - Trip Settings
-
Grocery Access Mode - Query Result

Inspiration
Across the U.S., many neighborhoods face limited access to affordable, nutritious grocery stores. According to national statistics, 23.5 million Americans live in low-income areas more than a mile from a grocery store, and 2.3 million of those households do not have access to a private vehicle (Ver Ploeg et al., 2009). Without a car, grocery trips become significantly more difficult, especially when carrying heavy or bulky items. Carless households often rely on nearby convenience or dollar stores, which stock fewer food options. For example, supermarkets carry 95% of essential food items like fresh produce and meat, while convenience stores only carry about 50% (USDA Food Store Survey). Public transit is an alternative, but grocery trips by bus or rail can be time-consuming and inflexible, particularly for shift workers, parents, or those with caregiving responsibilities.
Research has shown that shared mobility services like carsharing can help improve grocery access. My goal was to build an interactive tool that could help both grocery shoppers and city planners understand how shared mobility services can expand access to grocery shopping and how those access patterns change by time of day, traffic, pricing, and store operating hours. As an example use case, this tool focuses on carsharing and uses BlueLA, a station-based electric vehicle carsharing service that allows people to rent cars by the minute and pick them up or drop them off at designated stations in Los Angeles, California.
What it does
The Dynamic Grocery Access Trip Planning Tool is an interactive web application that helps grocery shoppers, city planners, and shared mobility providers understand how carsharing can improve access to grocery shopping. It includes two interactive modes:
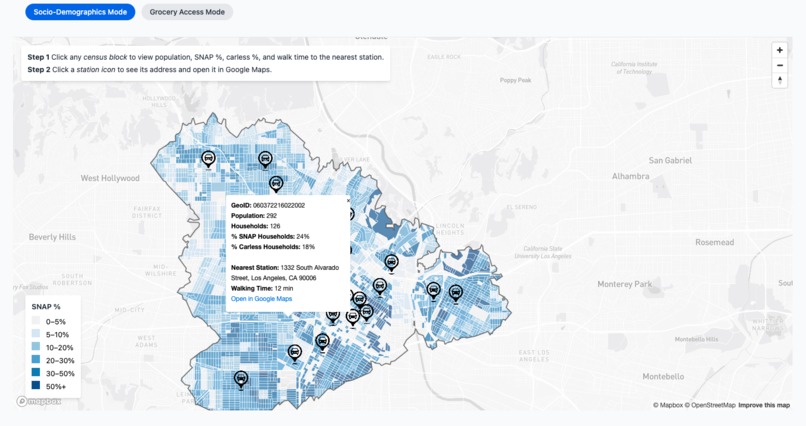
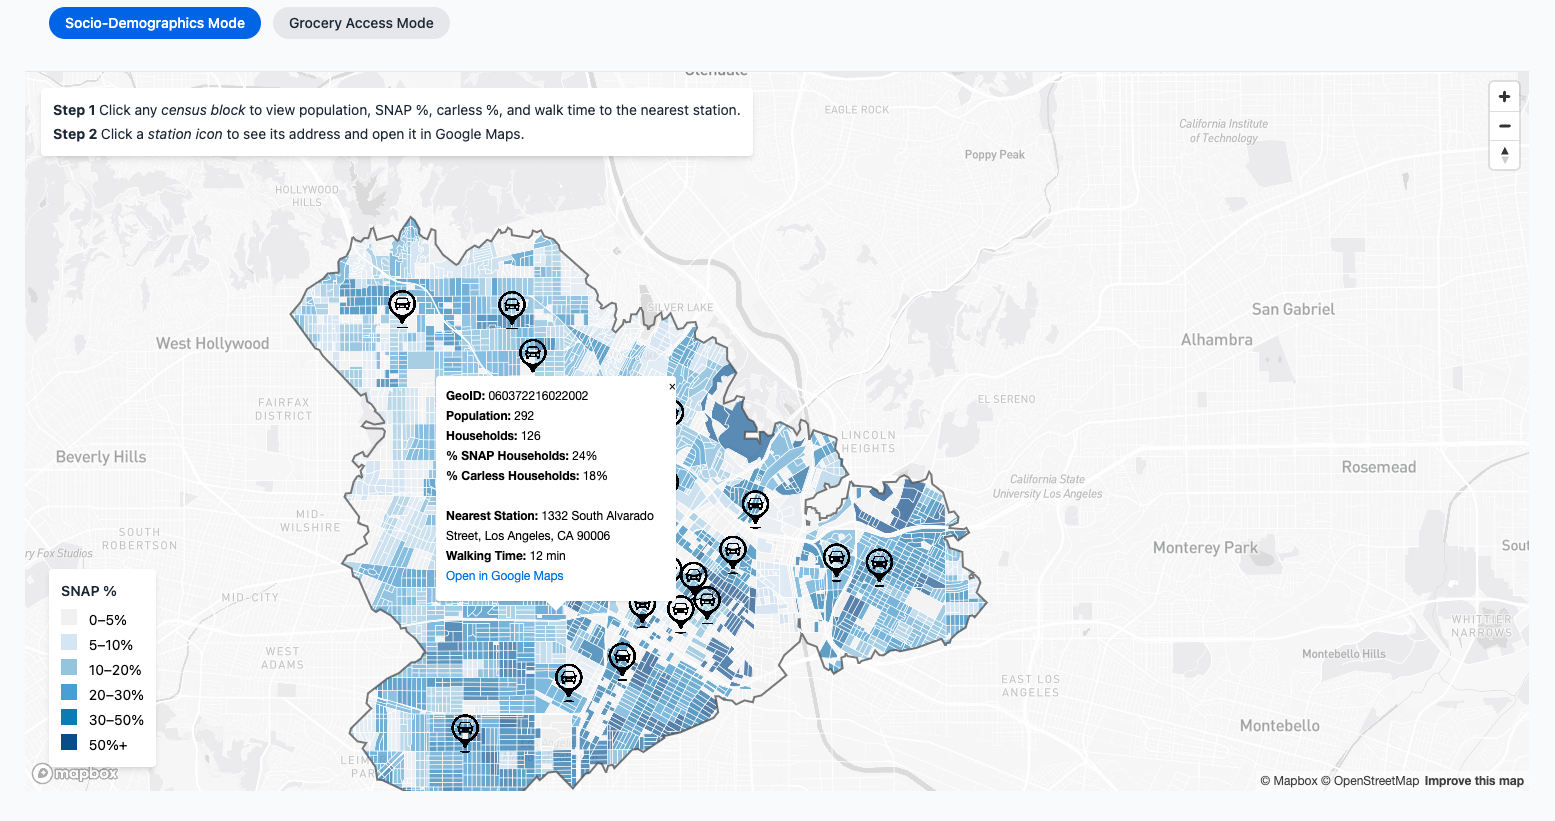
Socio-Demographics Mode
This mode displays household data from the U.S. Census at the census block level, including:
- Total population
- Total Households
- Percentage of households without a car
- Percentage of households receiving food assistance through SNAP (Supplemental Nutrition Assistance Program)
Each census block is color-coded by the share of SNAP households. Clicking reveals detailed stats, walking time to the nearest BlueLA station, and a direct link to Google Maps.
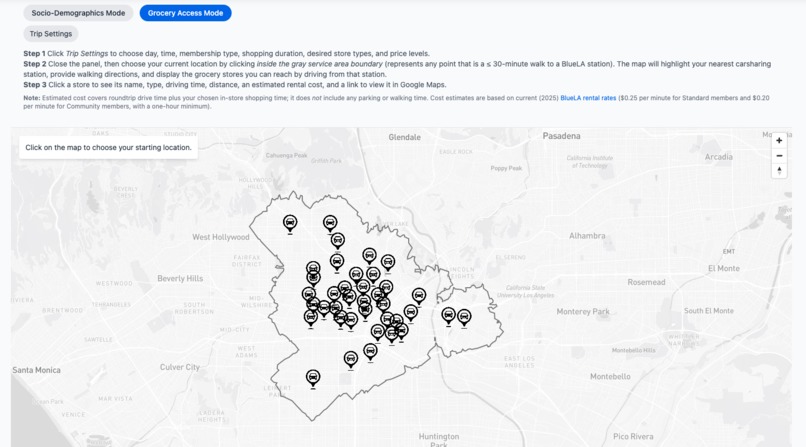
Grocery Access Mode
Simulates how someone without a car could reach stores using a shared car. Users can:
1) Select a day and time of trip
2) Choose a carsharing membership type
3) Enter expected in-store shopping time
4) Filter by grocery store type and price level
5) Click the map to select starting location (e.g., home location)
6) The map will highlight the nearest carsharing station and provide walking directions
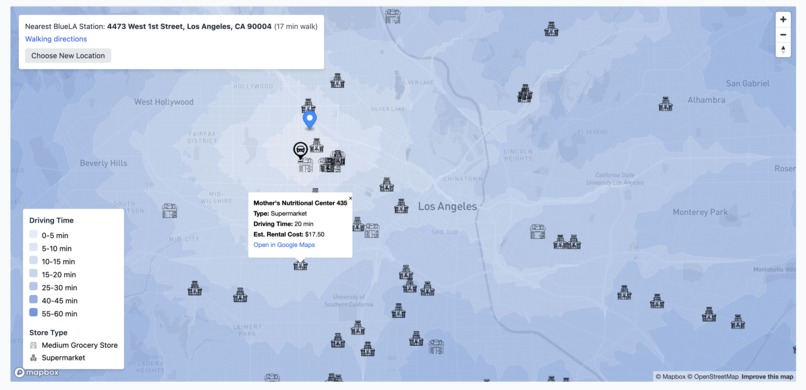
6) View all the grocery stores one can reach by driving from that station
7) Click on a desired store to display:
- Store name, address, and type
- Driving time from the station
- Estimated rental cost based on carsharing membership type, roundtrip drive time, and the chosen in-store shopping time (additional parking or walking time not included)
- A link to view the store in Google Maps
How i built it
This tool brings together data from multiple sources into a seamless, map-driven user experience.
Data and APIs
Grocery store locations came from the USDA SNAP Retailer Locator dataset, which lists stores that accept food assistance. I chose this dataset because it identifies SNAP-authorized stores that serve households relying on food assistance. In Los Angeles, 12% of households are carless and 18% receive cash public assistance or food stamps/SNAP.
Since the USDA data was sometimes outdated, I used the Google Maps Places API to:
- Confirm which stores were still open
- Retrieve business hours
- Add price level
- Get a unique place ID to build directions links
To model walking and driving access, I used the Mapbox Isochrone API to generate:
- Walking zones: used to find the nearest BlueLA station for any location
- Driving zones: used to calculate which stores can be reached under traffic at different times
I also used 2020 U.S. Census data to map population, households, vehicle ownership and SNAP participation.
Workflow and Tools
- Data cleaning and GeoJSON formatting were done in Python using Pandas and GeoPandas
- Enriched store metadata with Google Places API
- Hosted static files (GeoJSONs, icons) on Supabase Storage
- Built the app interface in React using Mapbox GL JS
- All interactivity, including filtering, trip settings, and isochrone selection, runs client-side
Challenges i ran into
- Cleaning the USDA dataset took time due to duplicate or closed stores and inaccurate addresses
- Matching stores to the correct Google Places ID required fuzzy logic and some manual verification
- Rendering dynamic isochrones and store layers on the client while keeping performance fast was tricky
- Making the interface intuitive for both technical and non-technical users required multiple design iterations
Accomplishments that i'm proud of
- Built a fully functional public tool that combines multiple data layers and APIs
- Created a bridge between academic research and everyday planning use
- Made travel time, store availability, and rental cost interactive and understandable
- Designed a tool that supports both individual shoppers and citywide policy planning
What i learned
- How to integrate the Google Places API to enhance external datasets
- Best practices for structuring and loading large-scale GeoJSON layers efficiently in the browser
- How to apply Mapbox routing and isochrone tools for equity planning use cases
- The importance of presenting data in a way that is direct, visual, and user-driven
What's next for Grocery Access Trip Planning Tool
- Add public transit and walking-only modes for comparison
- Include real-time BlueLA vehicle availability if API access becomes available
- Allow users to save or compare trips
- Expand the tool to other cities with similar carsharing programs
- Make the system embeddable as a widget or open-source planning resource
Acknowledgement
While the accessibility methodology used in this project also contributed to a peer-reviewed journal article I co-authored as part of my Ph.D. at UC Berkeley, the interactive tool submitted here was conceived, developed, and implemented independently by me for this hackathon. The published article presents static analysis of accessibility outcomes; this project builds on that work by transforming it into a fully dynamic, user-facing platform.
Built With
- google-maps-places-api
- javascript
- mapbox-gl-js
- mapbox-isochrone-api
- netlify
- pandas
- python
- react
- supabase
- tailwind
- turf.js
- us-census-data
- usda-snap-retailer-locator-dataset
- vs-code

Log in or sign up for Devpost to join the conversation.