-
-
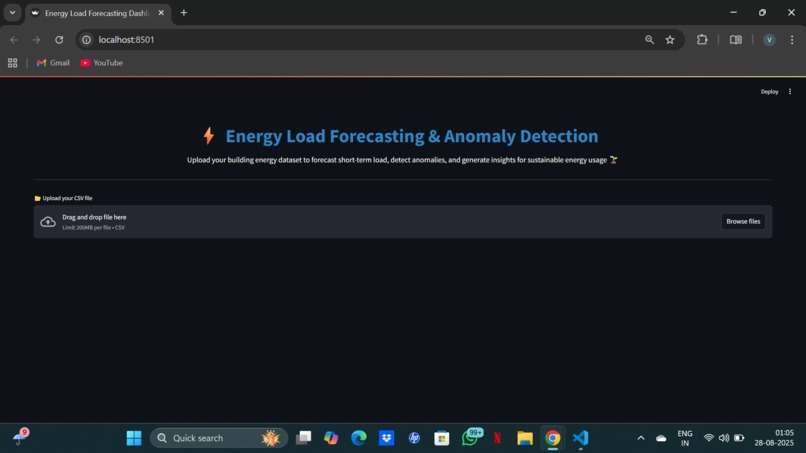
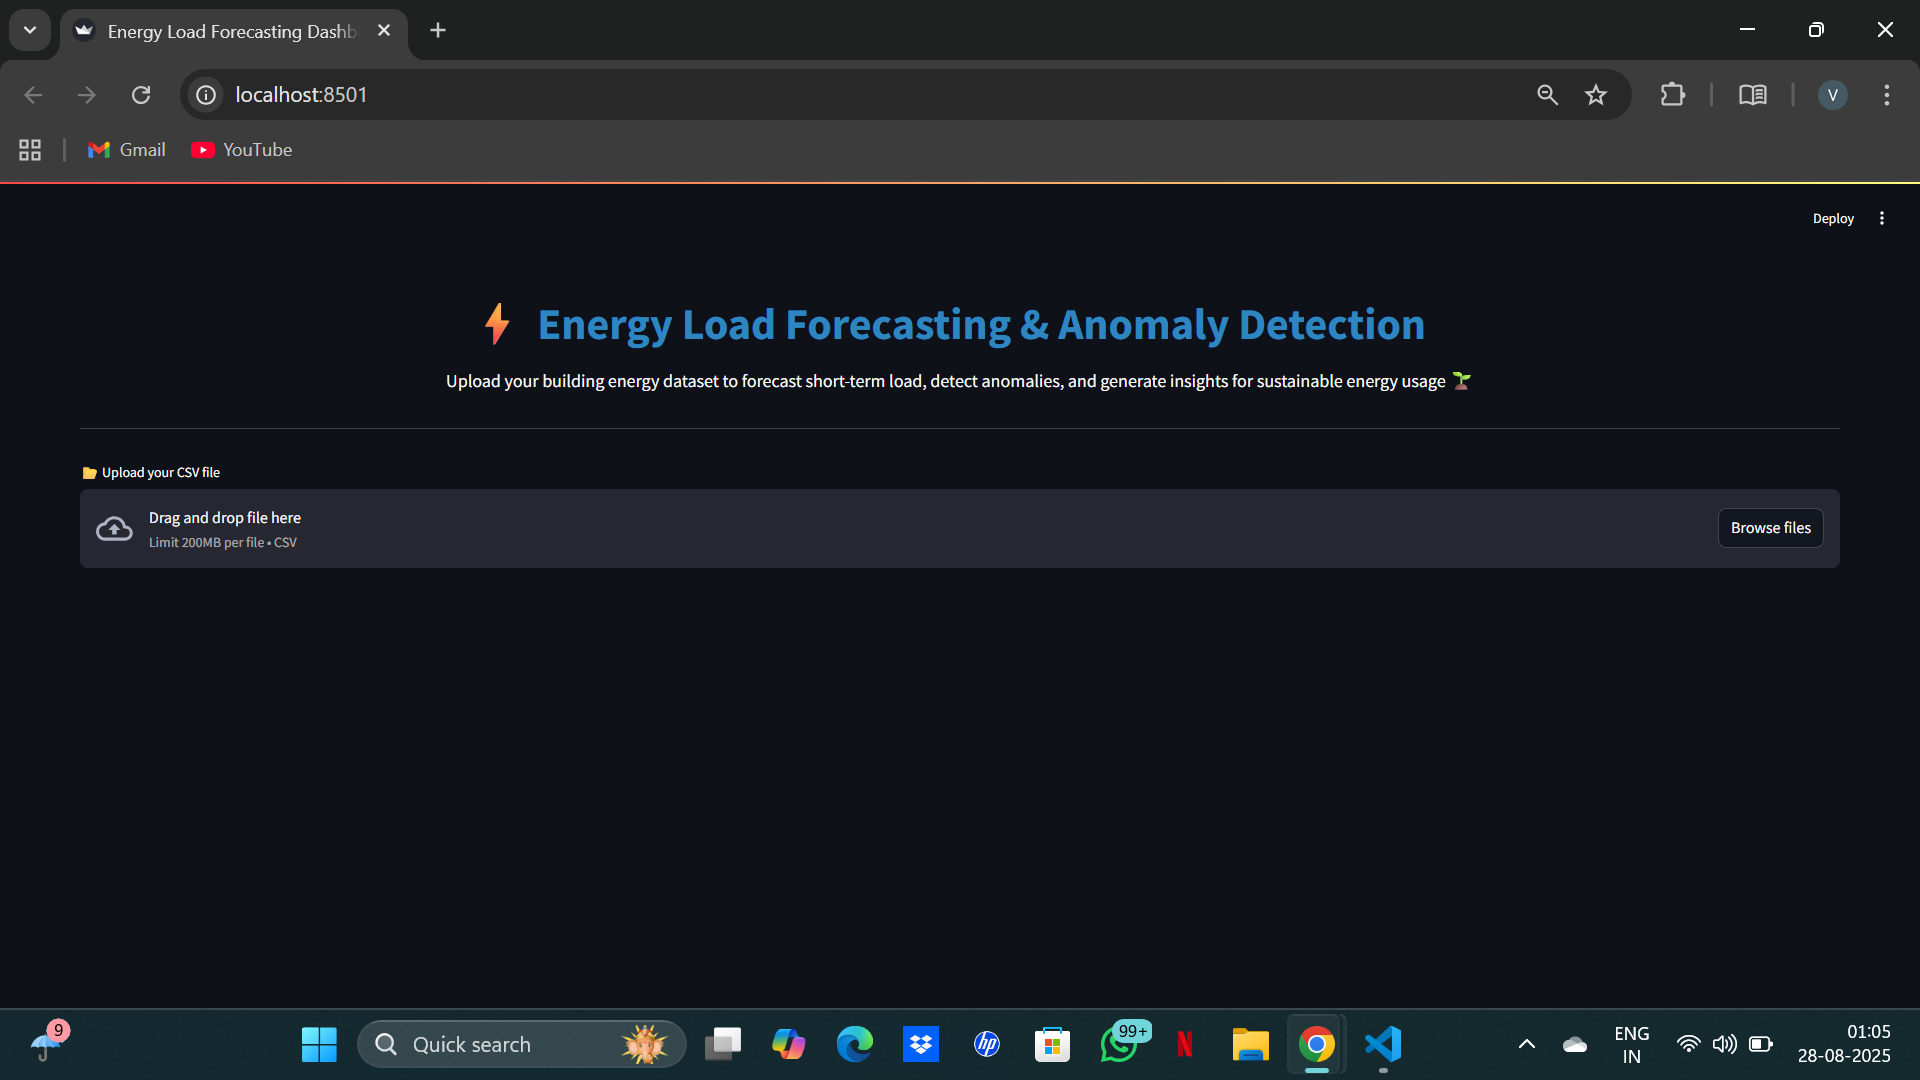
User-friendly interface to upload building energy data for forecasting and anomaly analysis
-
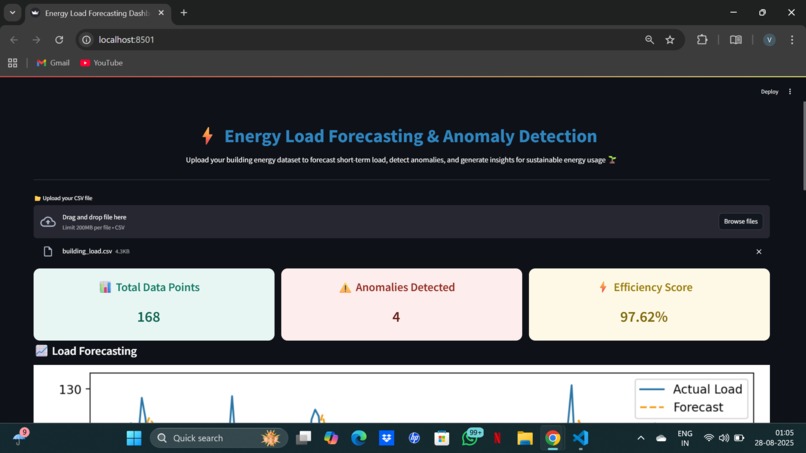
CSV upload results with total data points, detected anomalies, and forecasting efficiency score
-
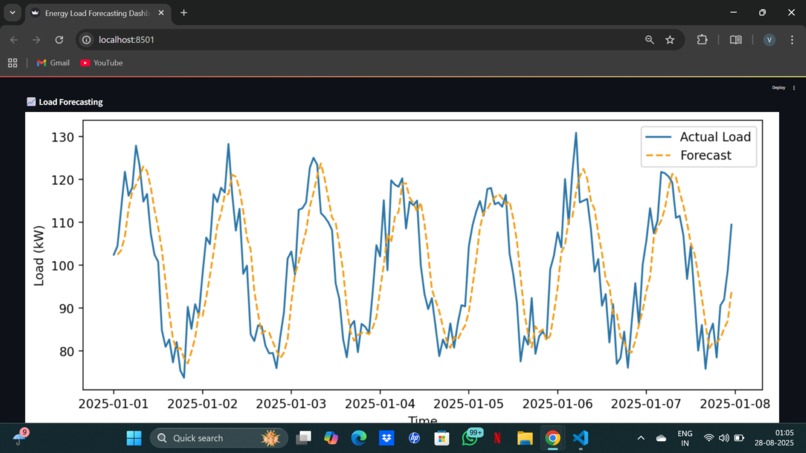
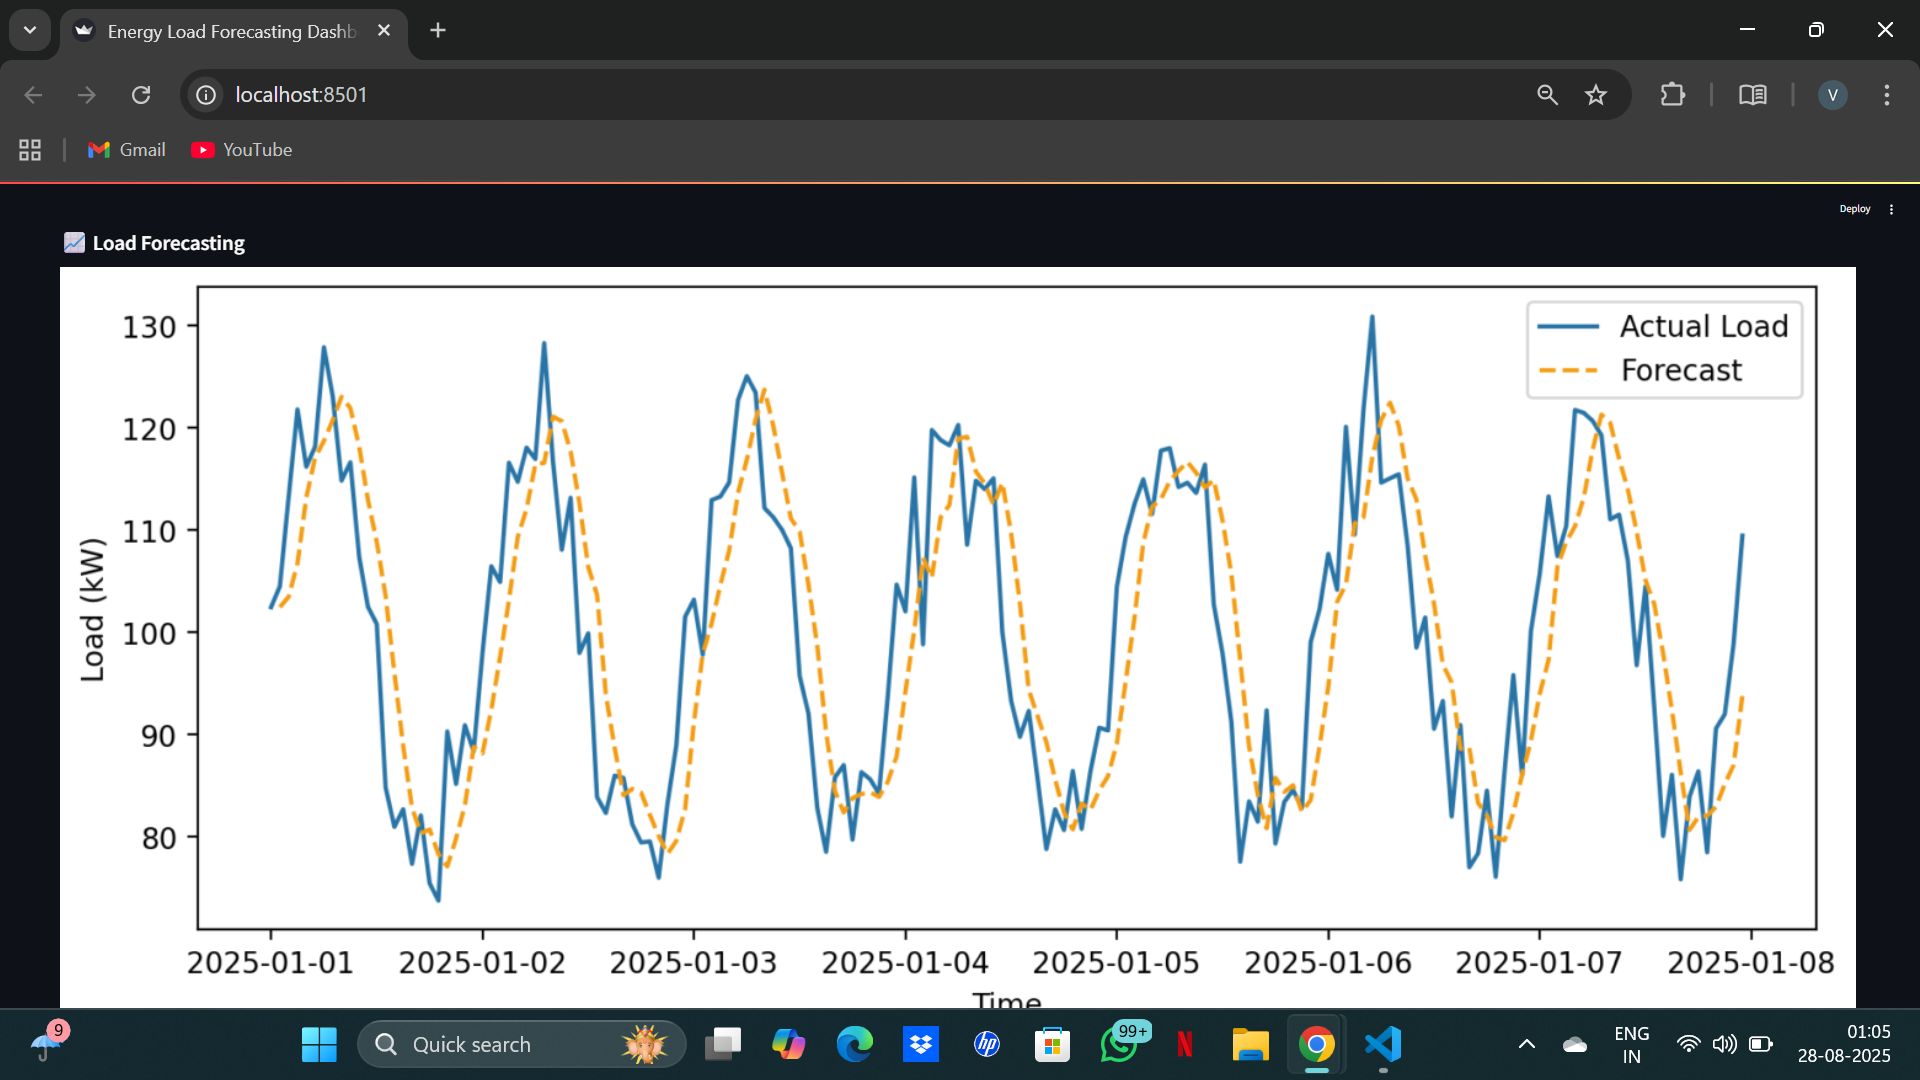
Comparison of actual vs forecasted energy load for efficient short-term load prediction
-
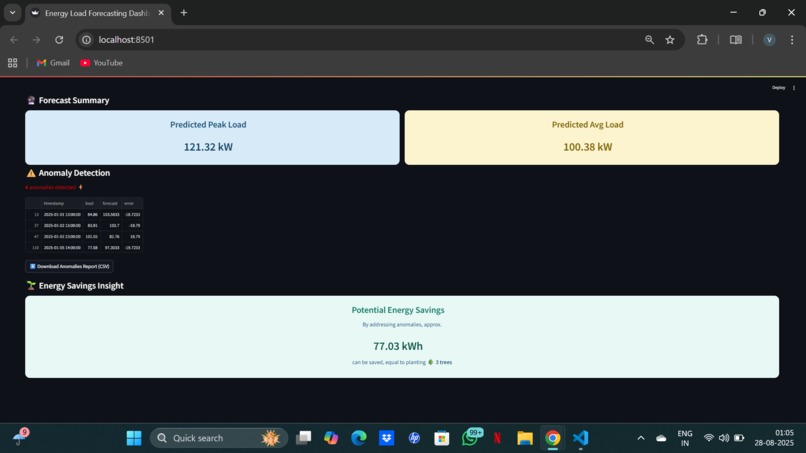
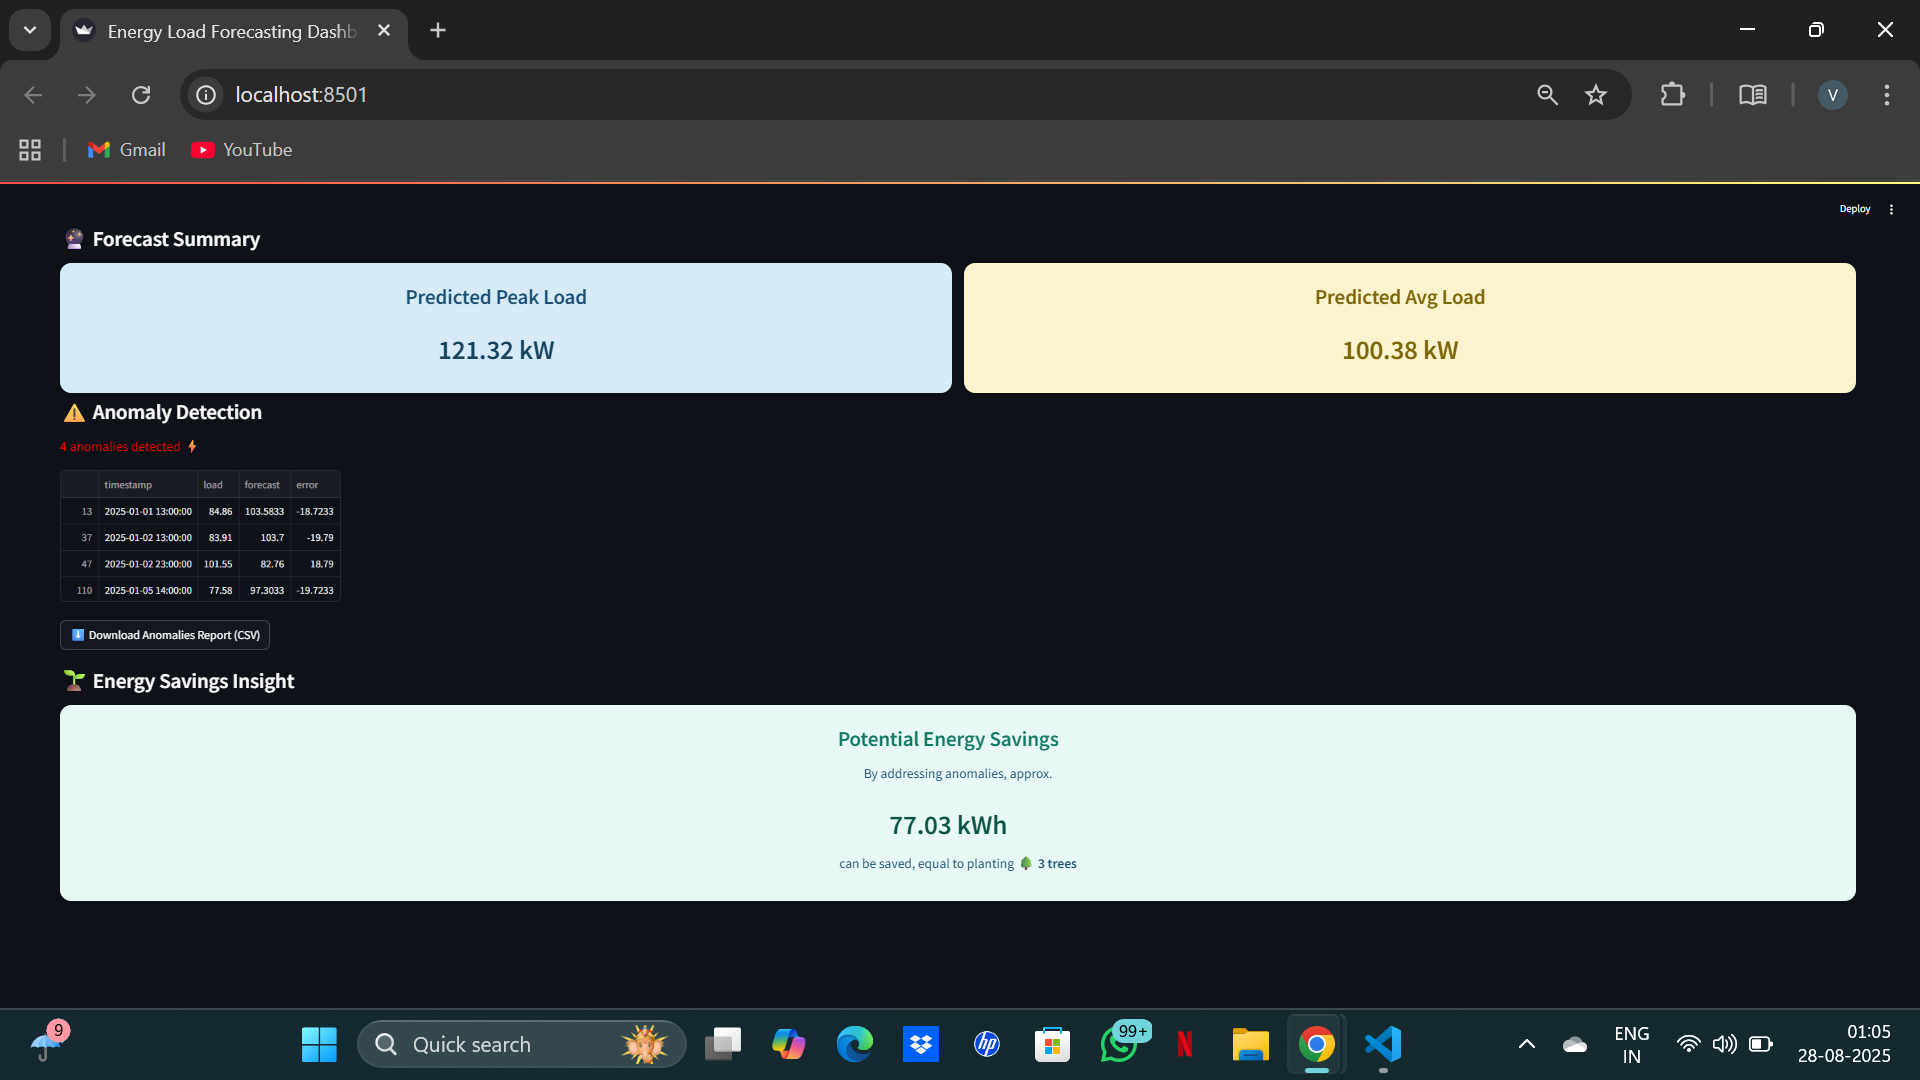
Forecast Summary with peak and average load, anomaly detection, and potential energy savings insights

Inspiration
Energy wastage often goes unnoticed in buildings and industries. I wanted to create a solution that not only forecasts future energy usage but also detects anomalies that could signal inefficiencies or faults helping reduce costs and carbon footprint.
What it does
The project predicts short-term energy demand and flags unusual consumption patterns. This enables smarter planning, efficient energy usage, and early detection of faults or wastage.
How we built it
I used Python, Pandas, NumPy, Scikit-learn for data processing and modeling. Streamlit and Plotly were used to create an interactive dashboard where users can explore forecasts and anomaly alerts easily.
Challenges we ran into
Handling noisy and incomplete data. Balancing anomaly detection so it’s neither too sensitive nor too lenient. Designing a dashboard that remains simple and intuitive for non-technical users.
Accomplishments that we're proud of
Building a complete end-to-end pipeline from data preprocessing to deployment. Creating a clean, interactive dashboard to visualize insights. Developing a model that can both forecast demand and detect anomalies effectively.
What we learned
How to structure forecasting and anomaly detection workflows. The importance of clean data and feature engineering for better results. How to communicate technical insights in a user-friendly way.
What's next for Energy Load Forecasting & Anomaly Detection
Integrating real-time streaming data for live monitoring. Adding support for renewable energy sources. Expanding the system to scale for smart cities and large industries.

Log in or sign up for Devpost to join the conversation.