Inspiration
Anyone who drives in South Florida knows the pattern: a road gets torn up, finally reopens, and a few weeks later the cones are back. A lot of the time it's not bad luck. It's two utilities working on the same street without knowing about each other. FPL digs for a power line, then another utility digs the same spot for its own project. Two crews, two permits, two road closures, same hole.
Nobody is doing anything wrong. Each utility plans in its own system, and those systems don't talk. That's a coordination problem, and coordination problems are what GridSync is good at.
What it does
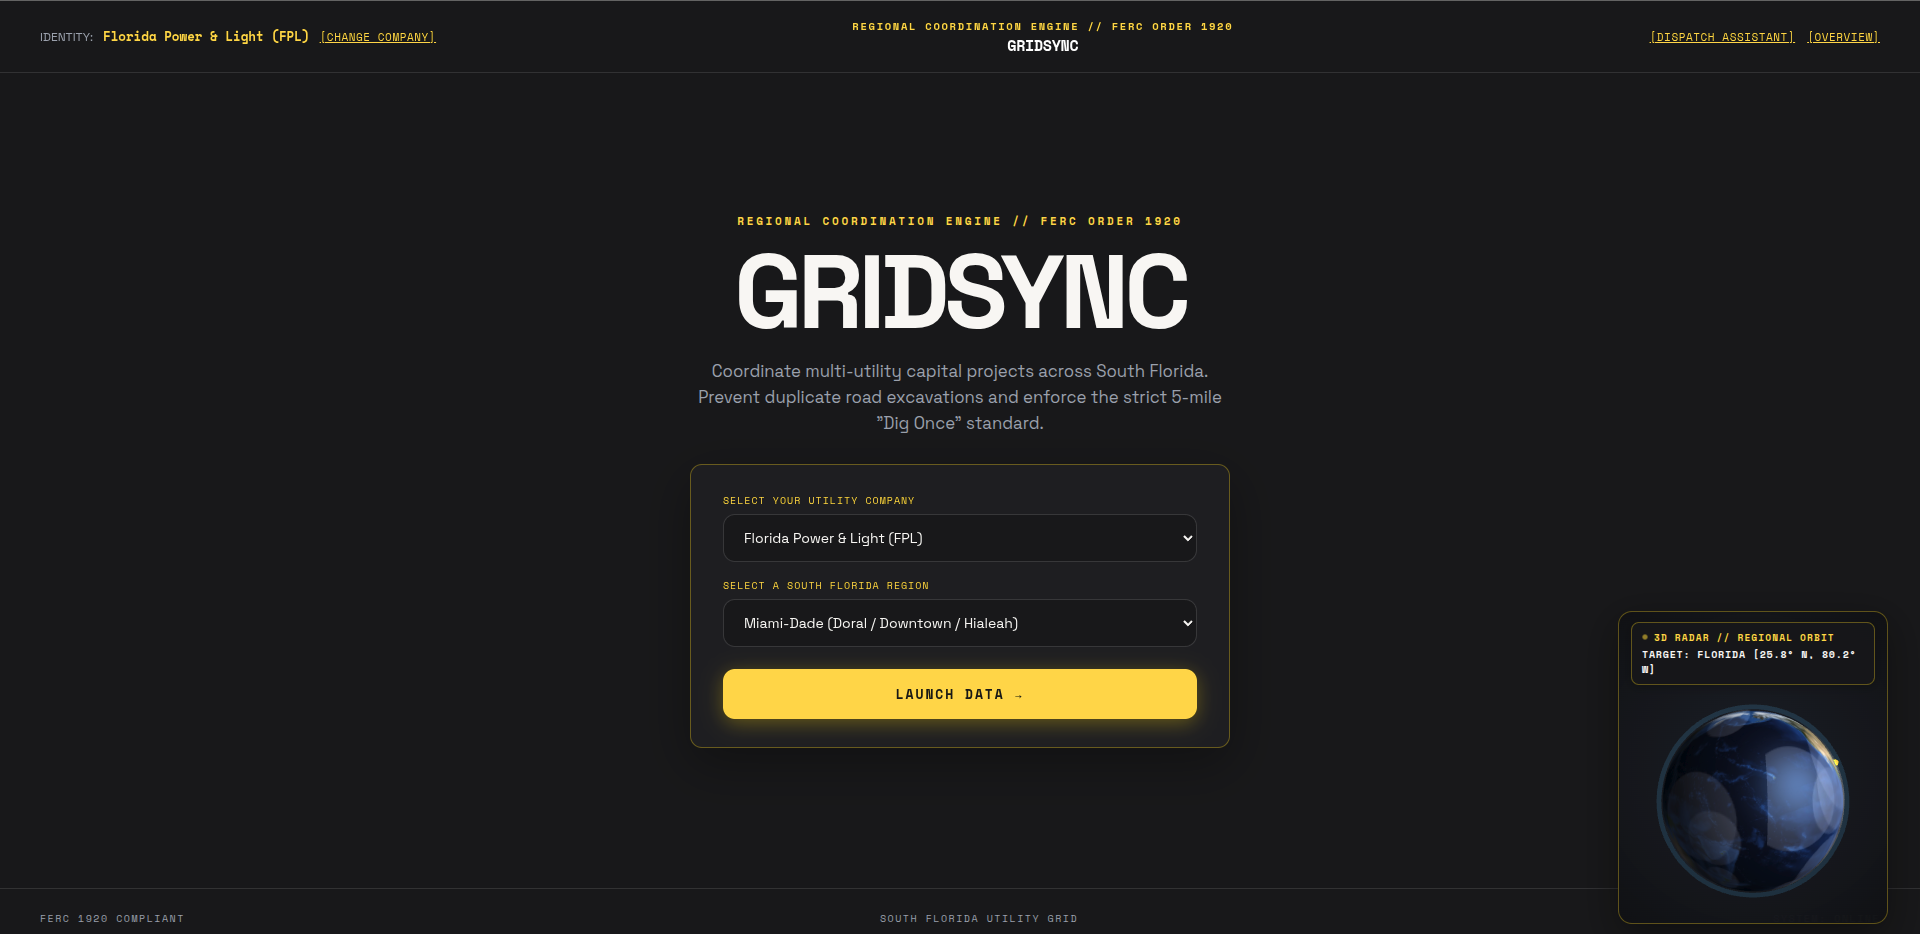
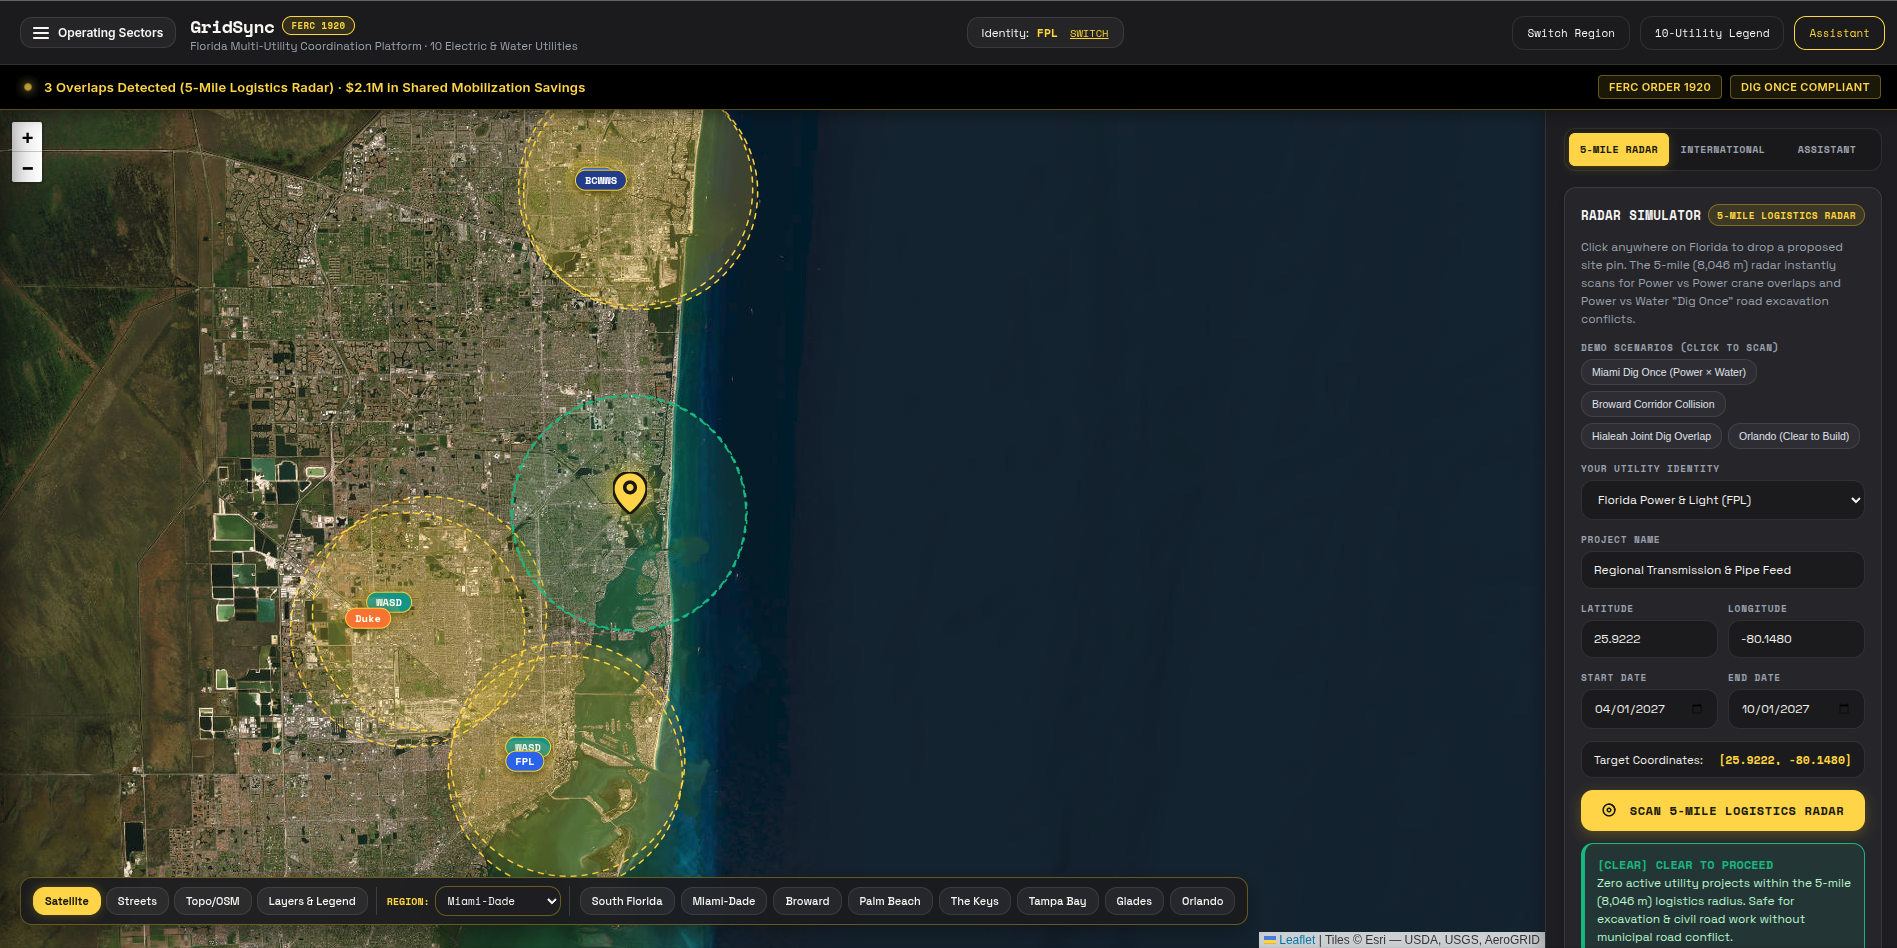
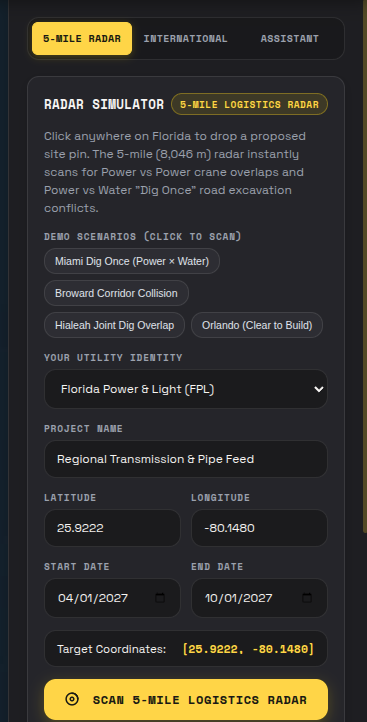
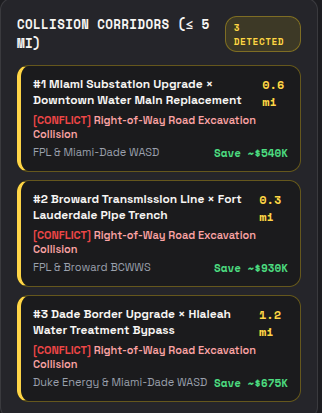
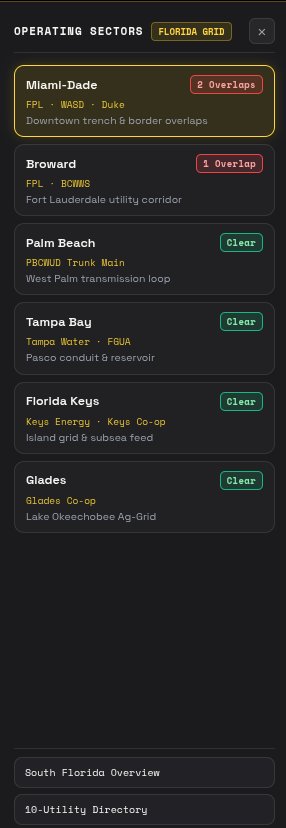
GridSync puts planned utility projects from multiple providers on one shared, interactive map. With one click on Find Overlaps, it checks every project against every other one by location and schedule, and flags any pair that's close together in both space and time. Those are double digs waiting to happen.
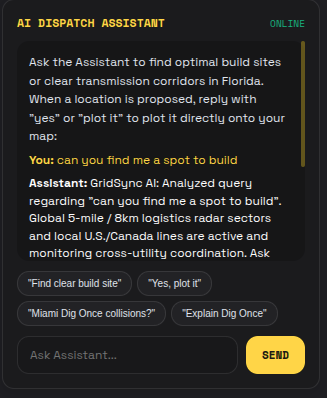
A flag on a map isn't enough, though. Project managers need to know what to do next. So GridSync uses Google Gemini to turn each overlap into a plain-English coordination plan: who should connect, what a shared crew could handle, and the estimated savings.
How we built it
Backend: Node.js and Express, handling project data and the overlap detection logic (comparing distance and date ranges between projects)
Frontend: An interactive map that shows each utility's projects color-coded and highlights overlapping pairs
AI: Google Gemini, which takes the details of an overlap and generates an actionable coordination plan
What's next for GridSync
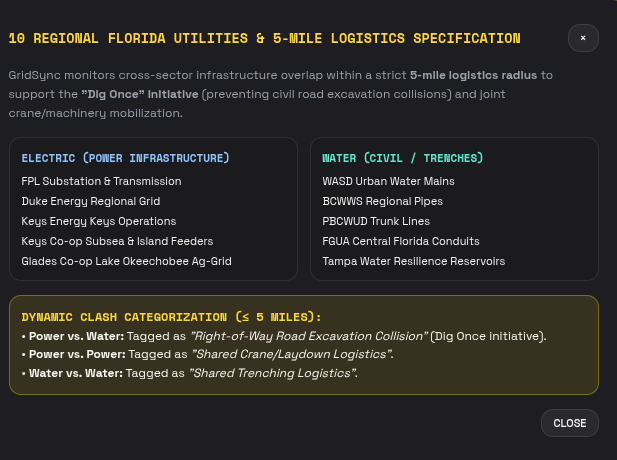
Expanding beyond power to water, gas, and fiber, all on the same map Pulling in real permit and project data from cities and utilities We also plan to implement it international with large cities throughout the 7 continents


Log in or sign up for Devpost to join the conversation.