-
-
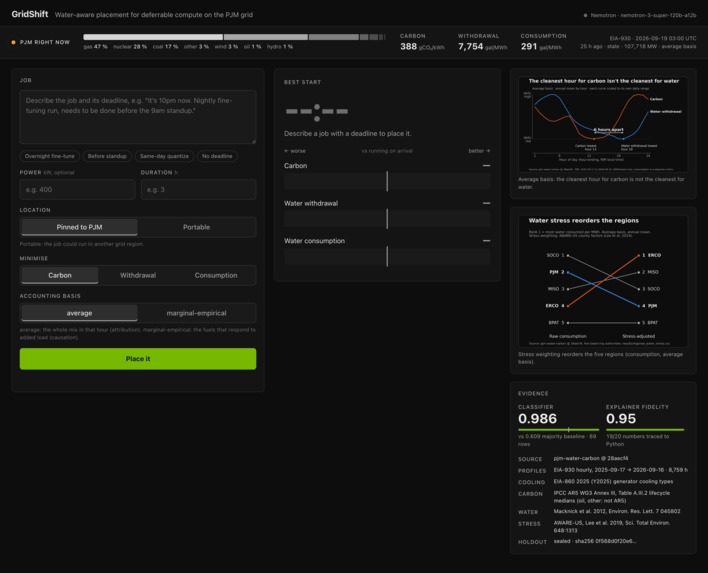
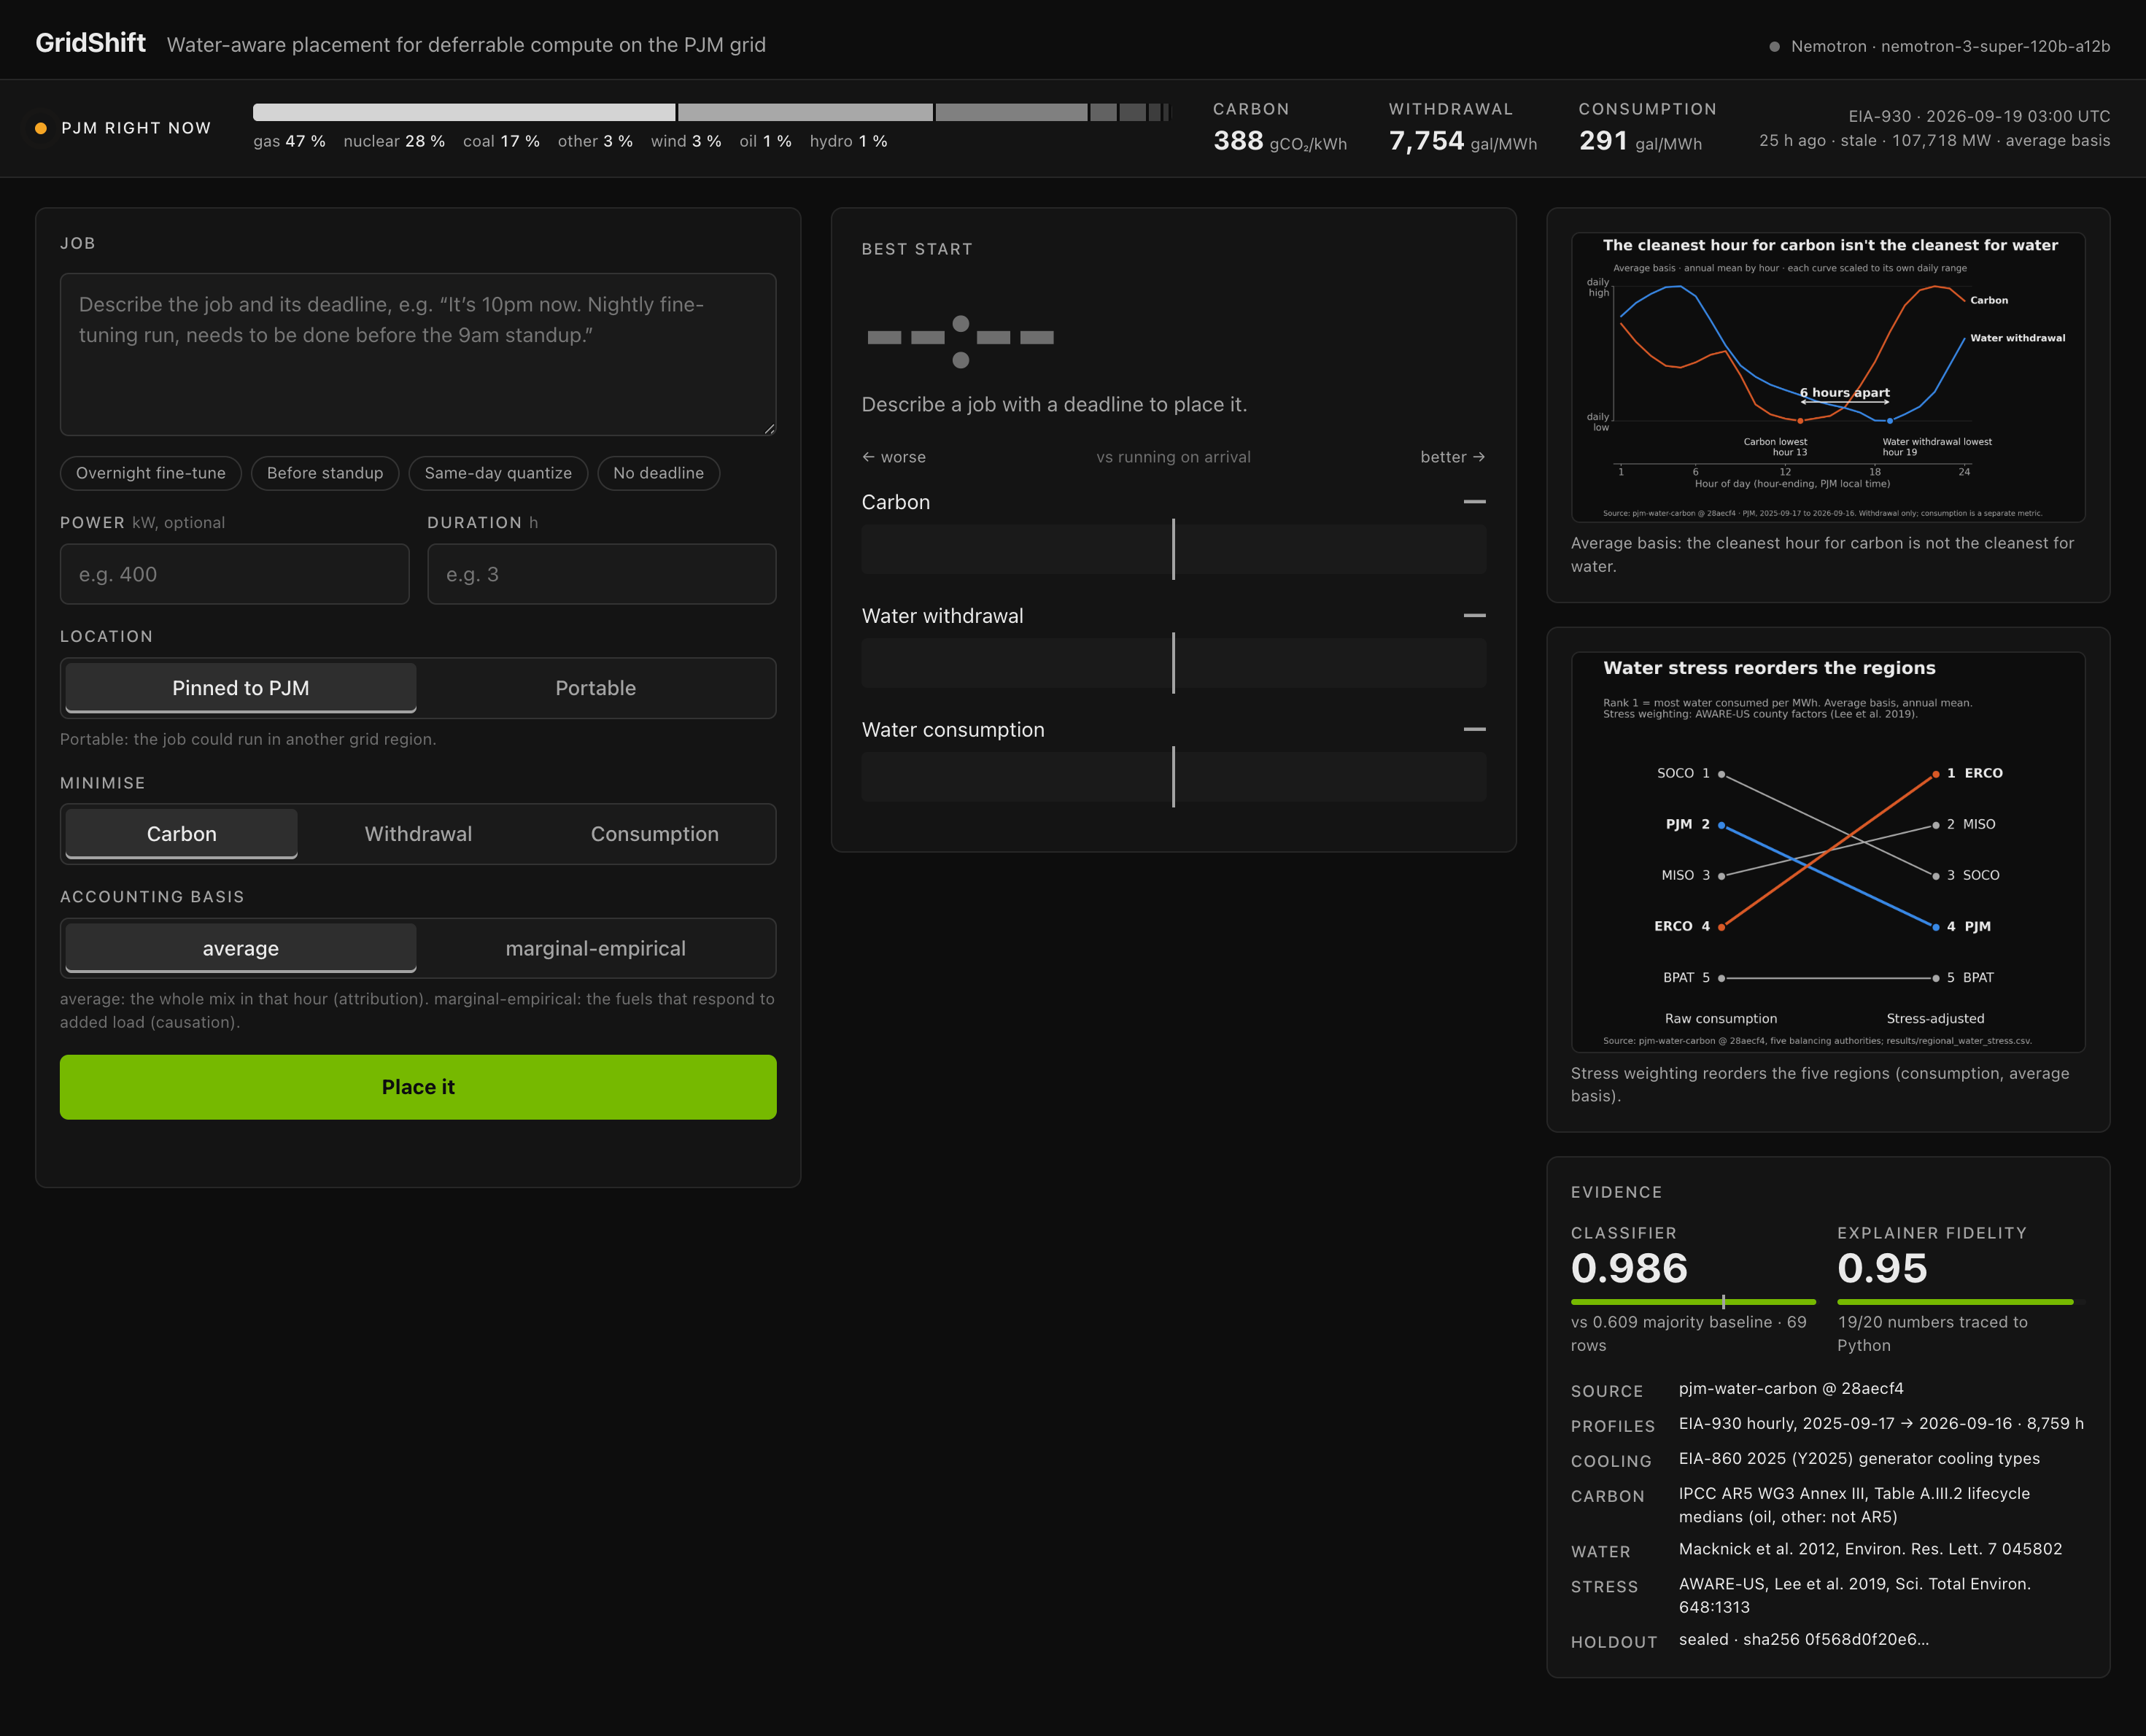
This is what you see before you type anything. Describe a job on the left, get the best hours on the right.
-
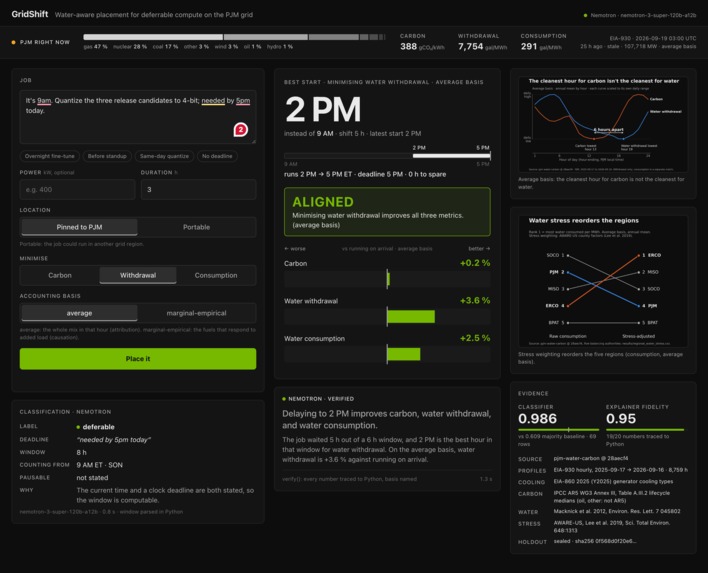
Nemotron writes the explanation, but every number is checked against what Python computed. Anything that fails gets replaced.
-
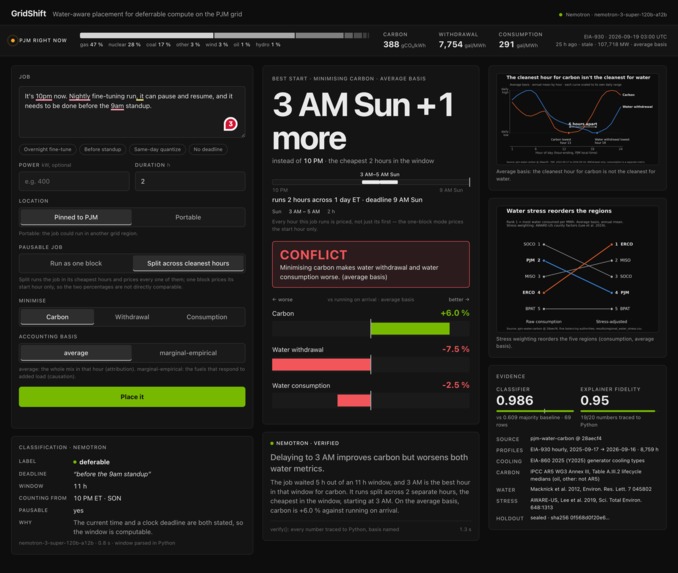
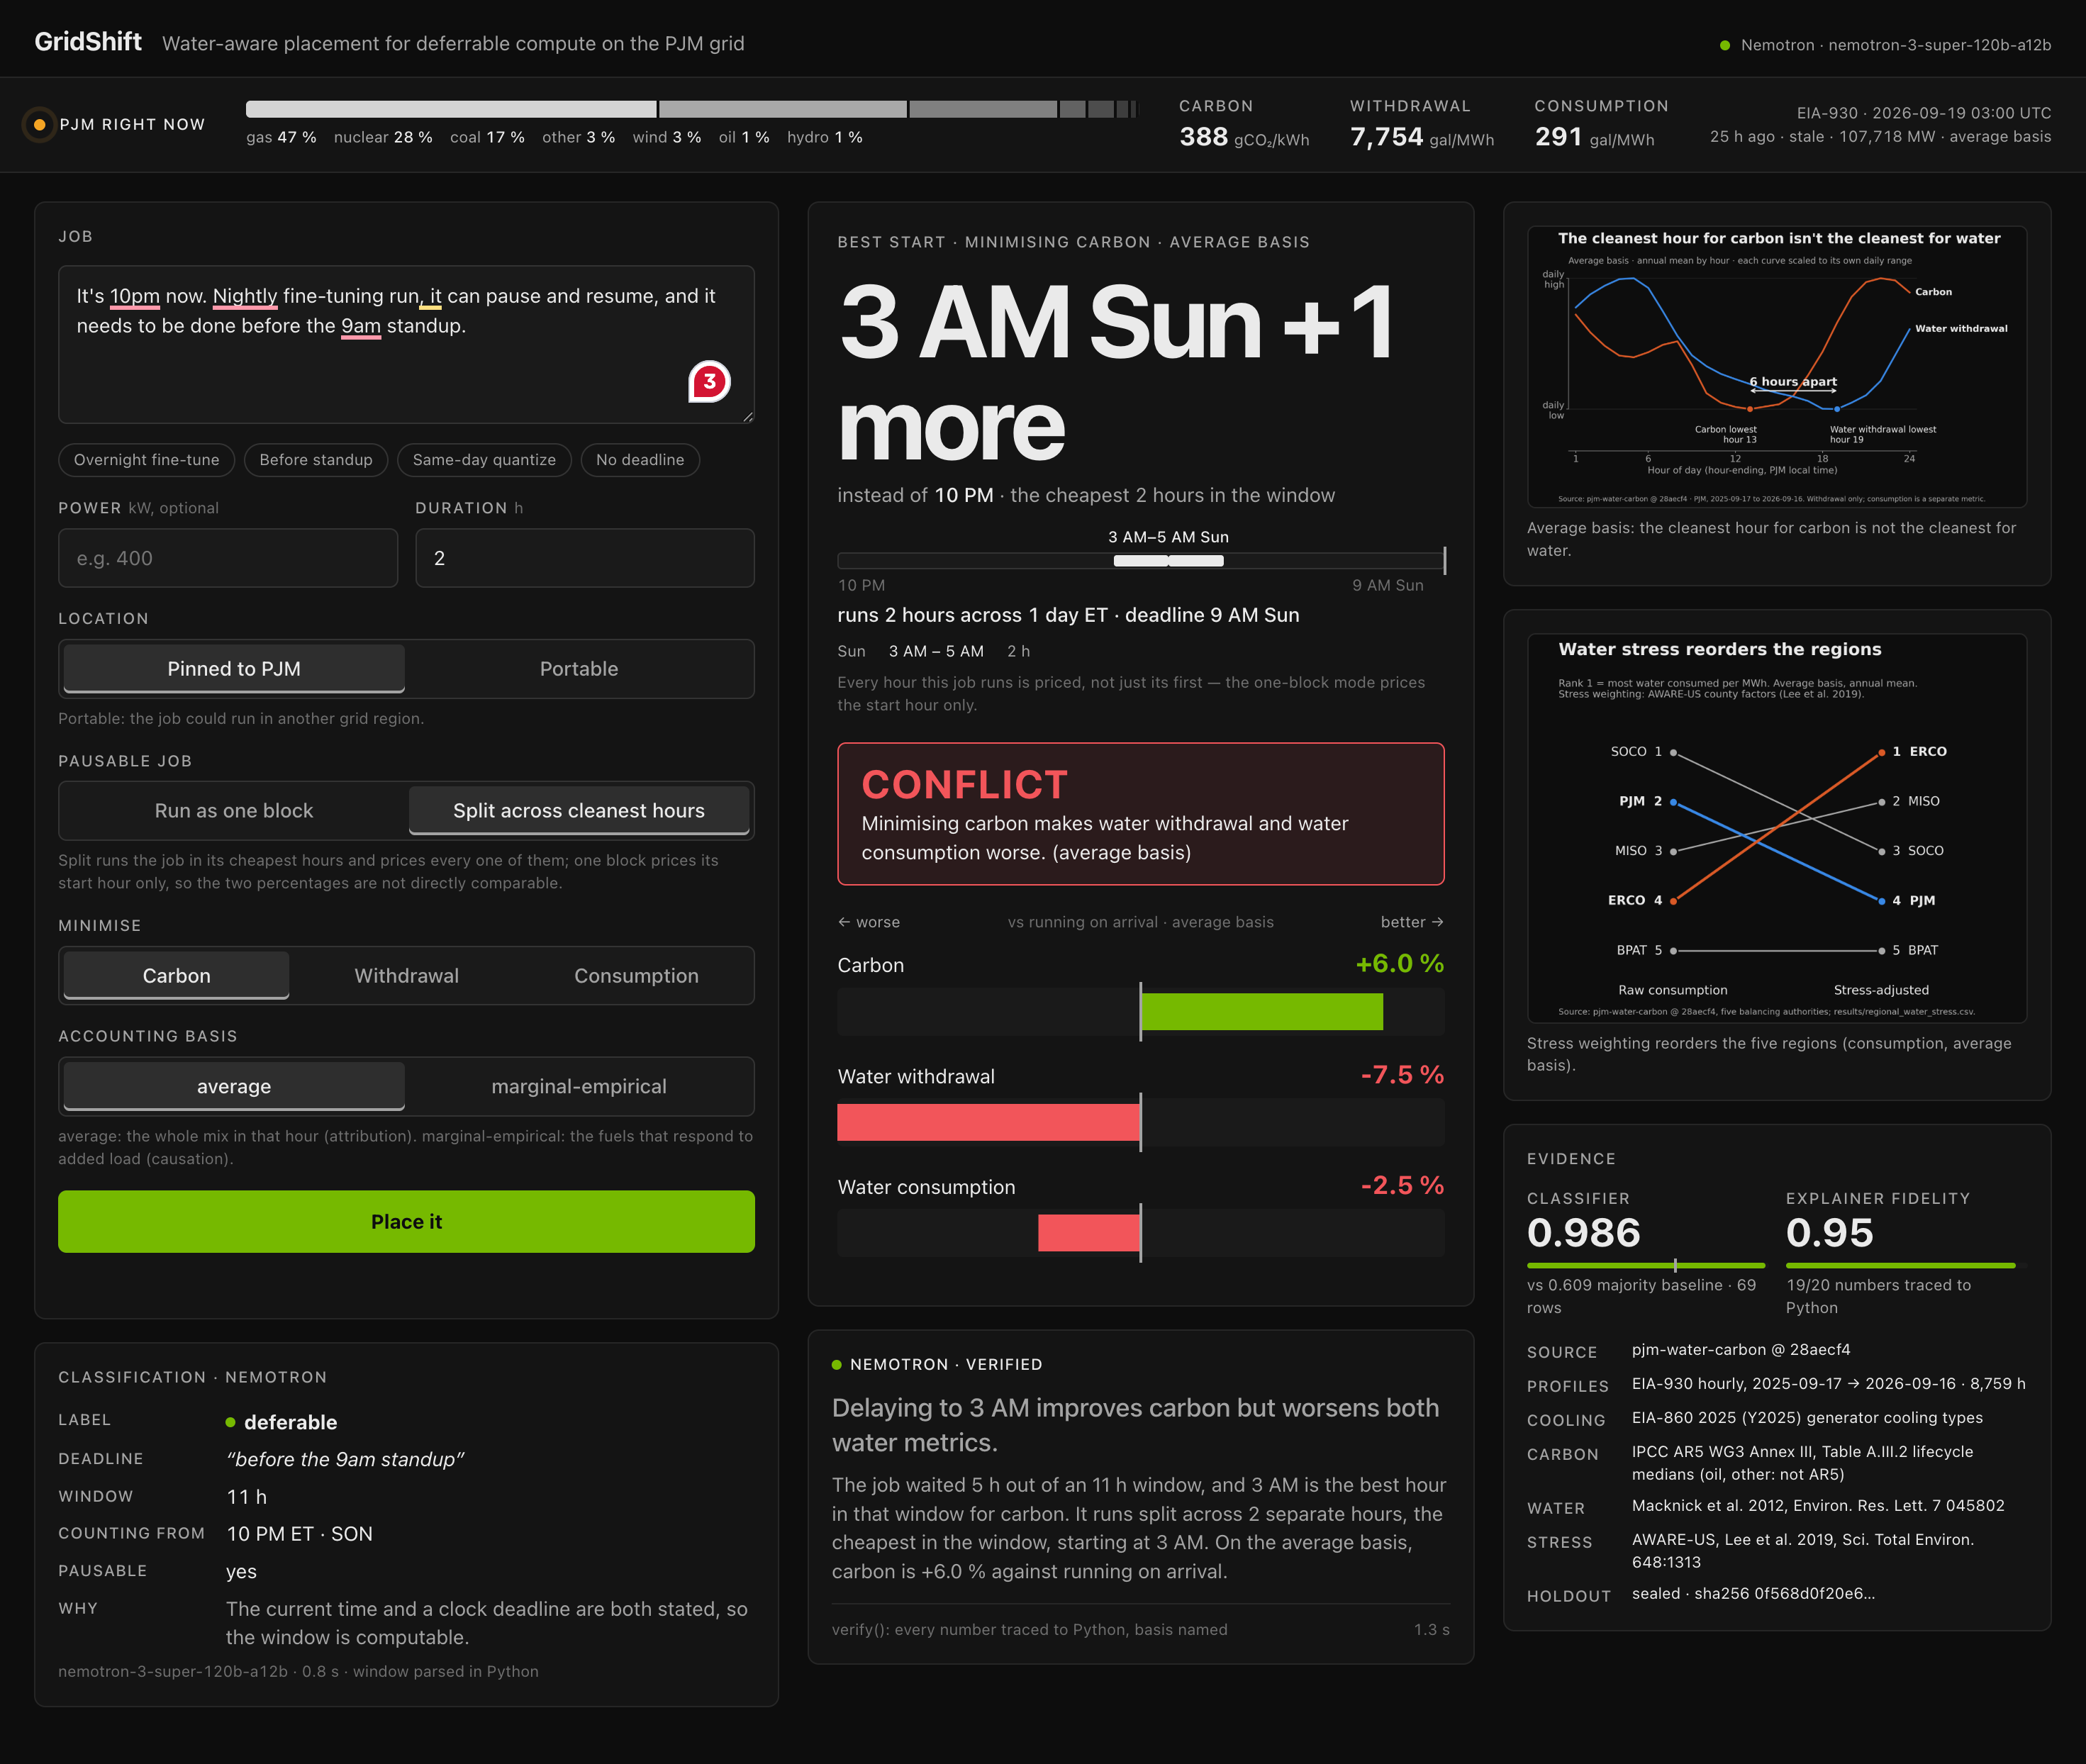
Although carbon is being saved at 3am, water is not. Minimizing carbon makes both water metrics worse.
-
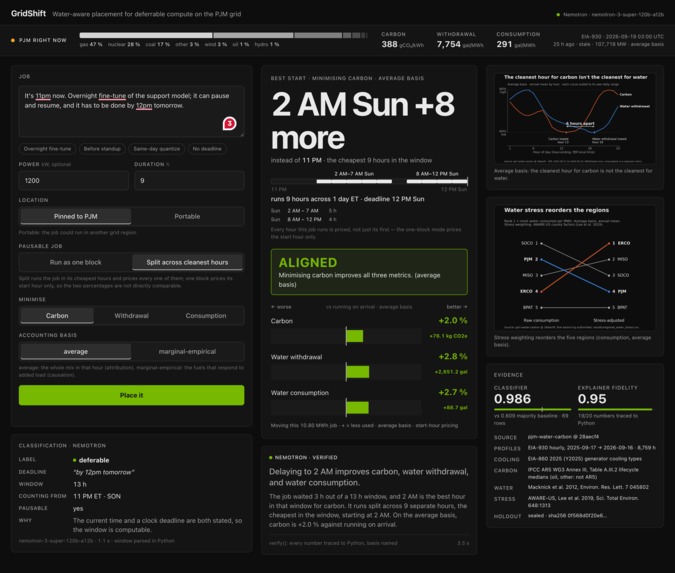
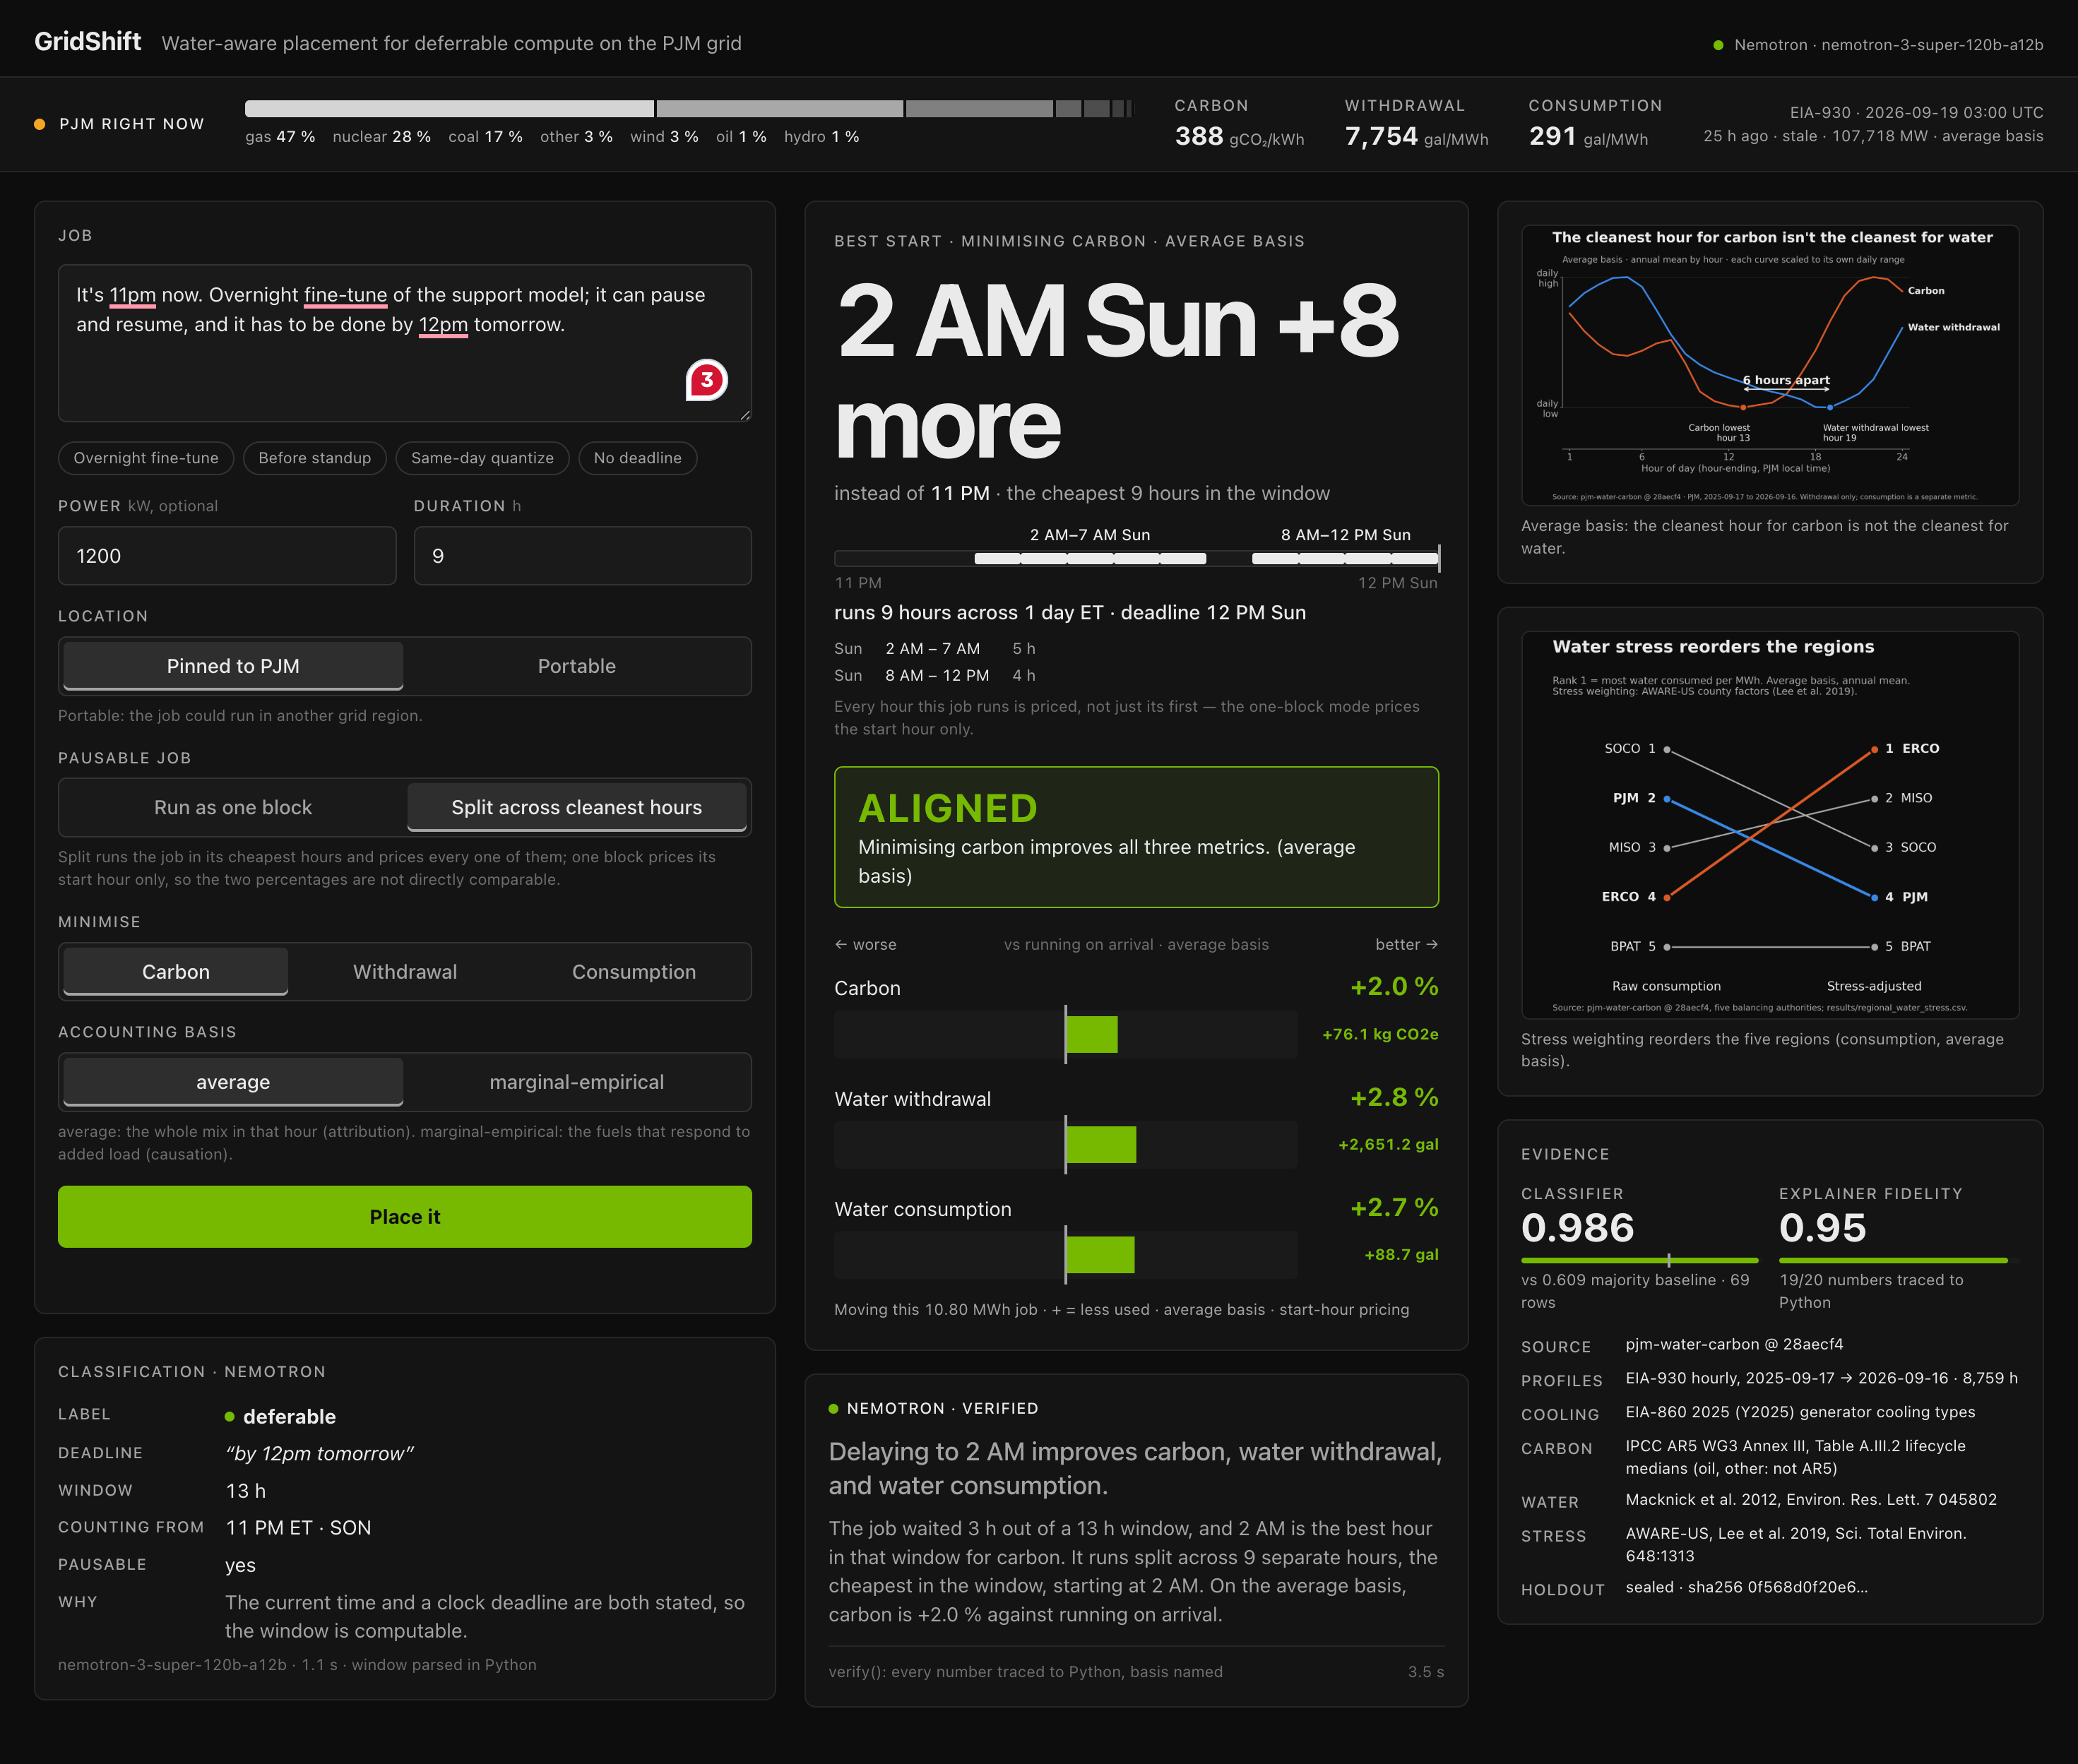
Because this job can pause and run at different times, it runs in the 9 cheapest hours instead of one block. All three metrics improve.
-
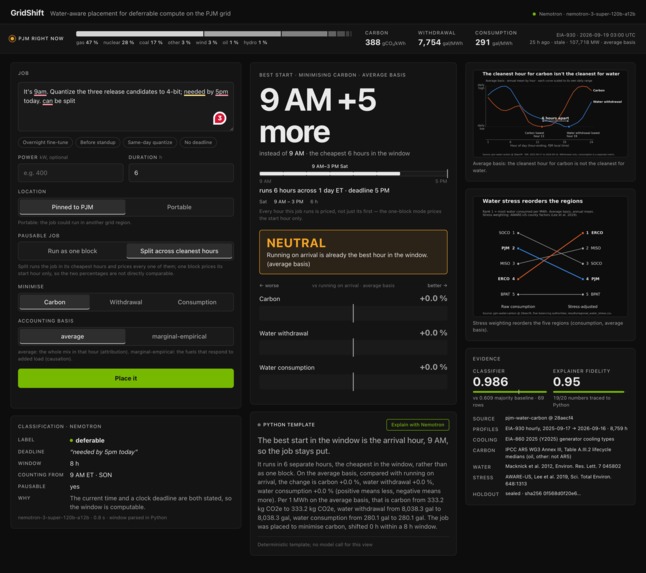
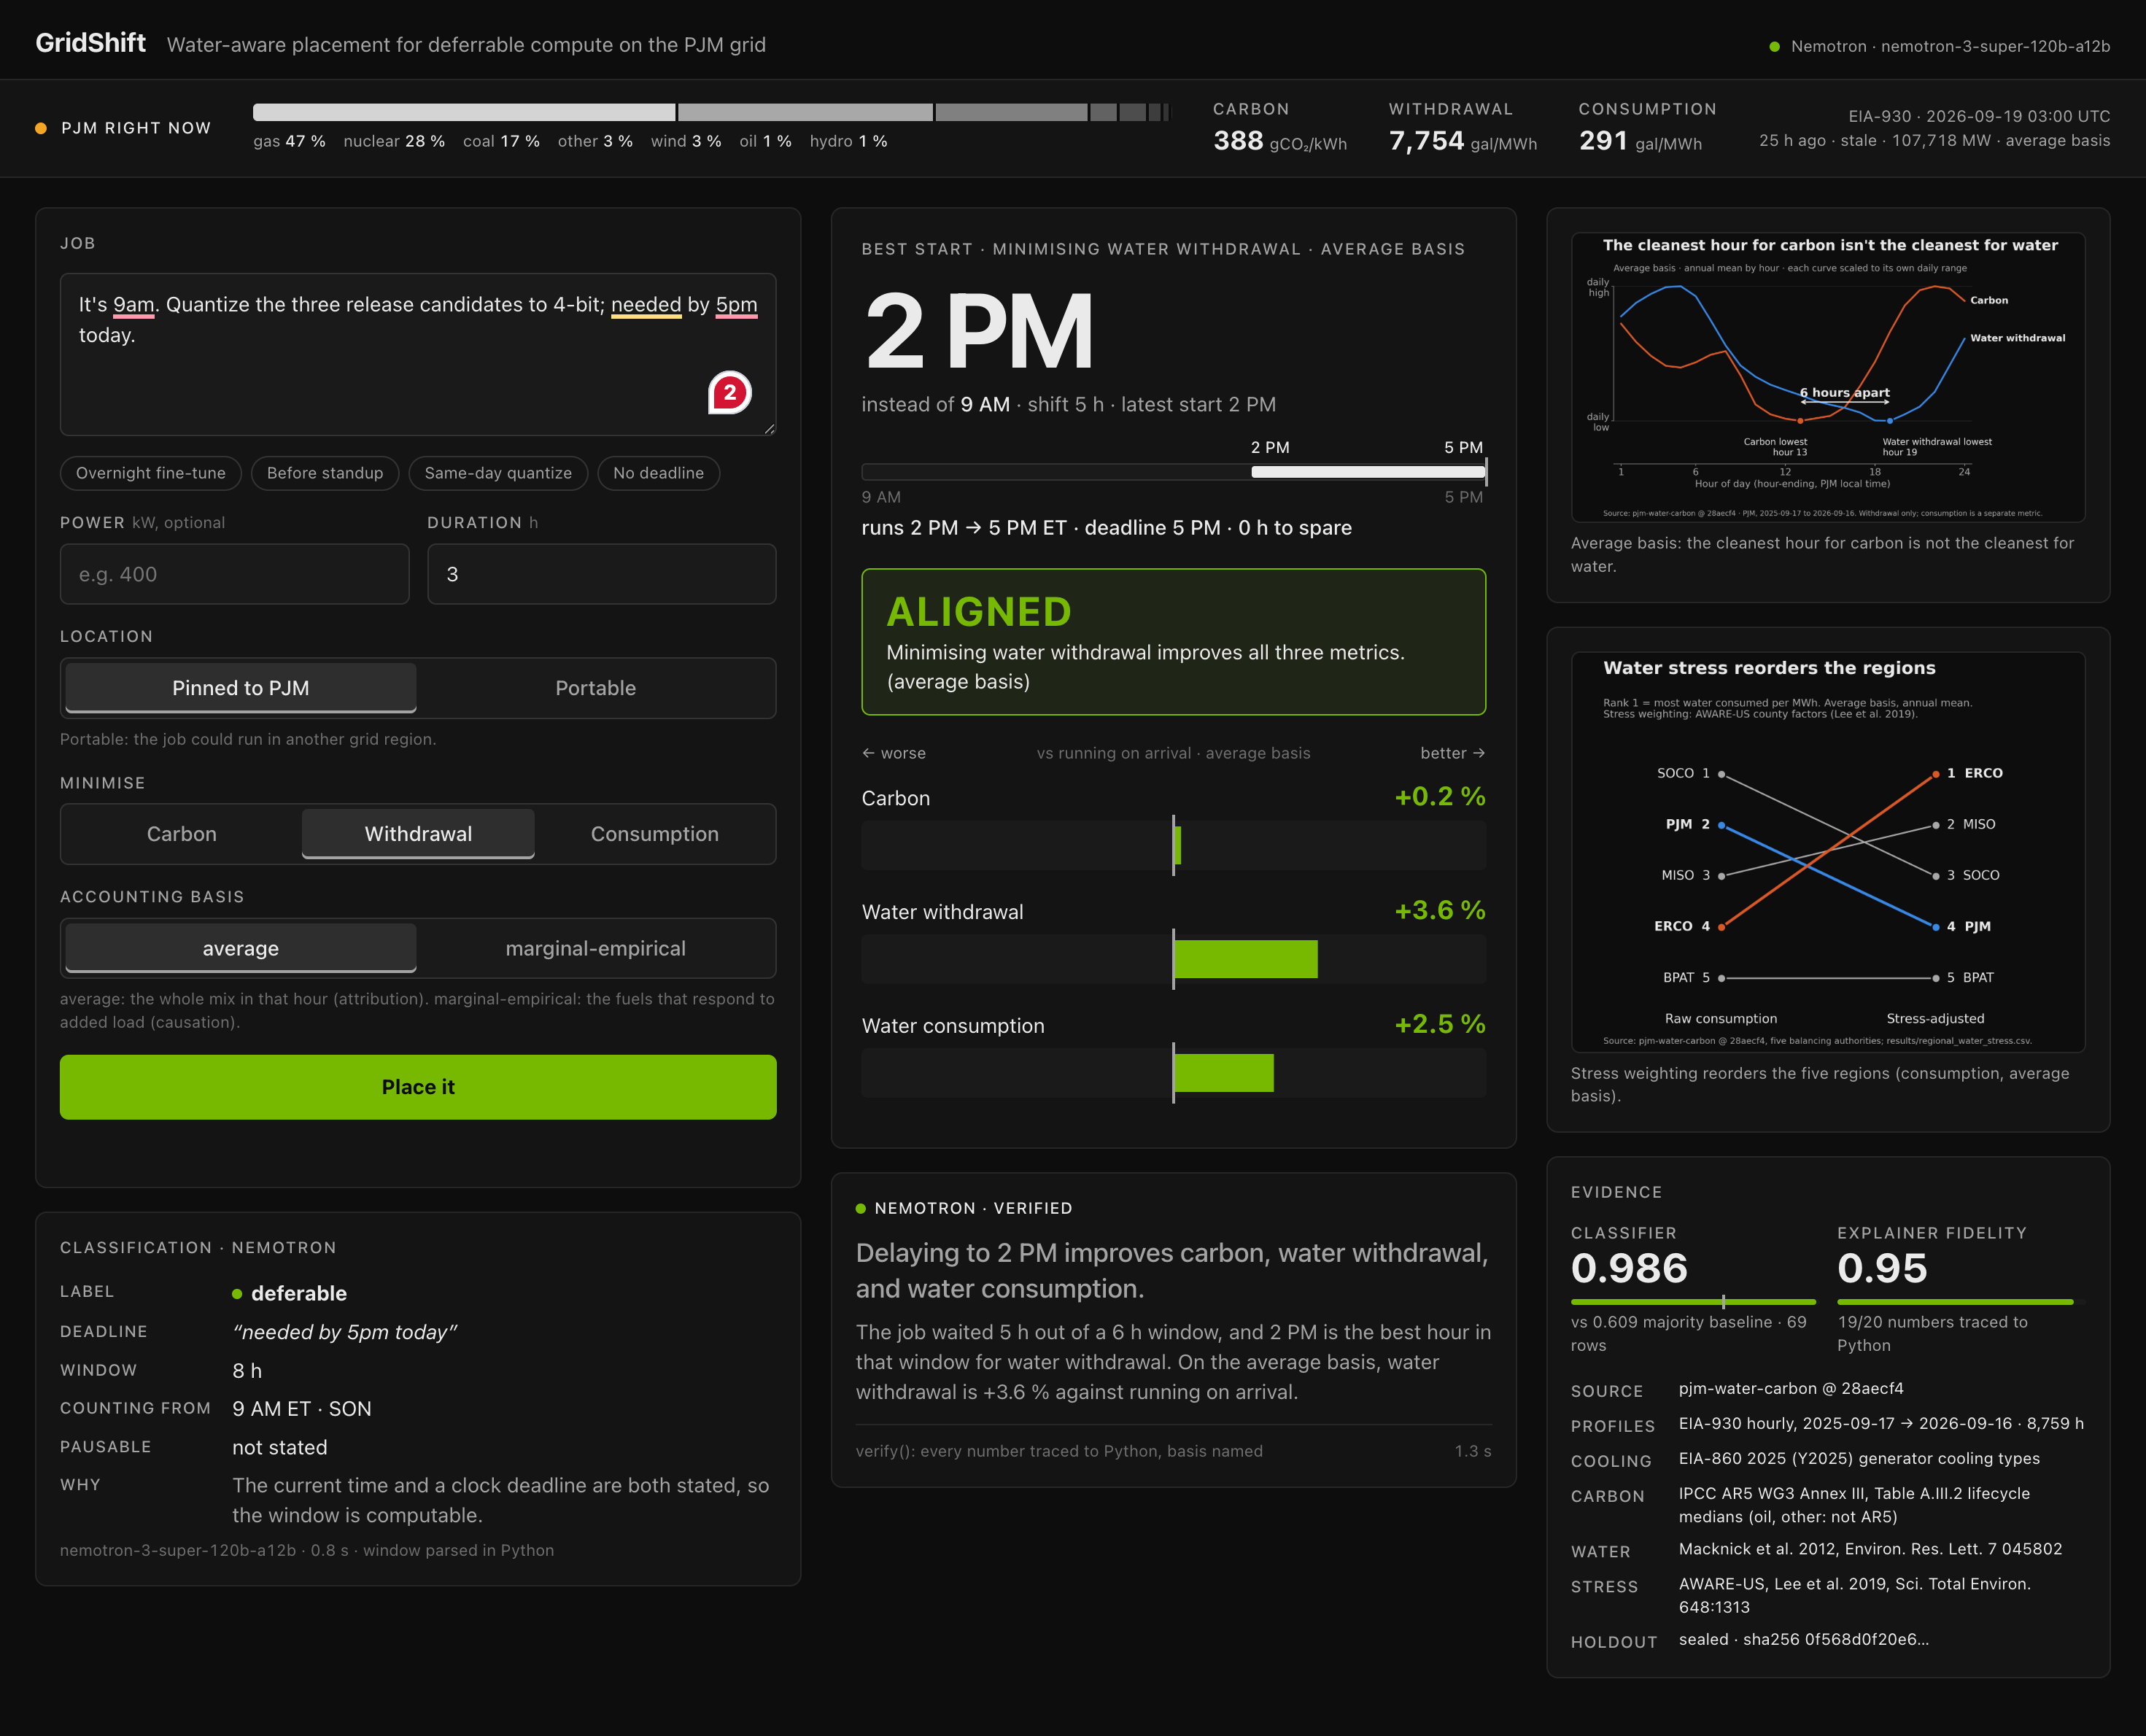
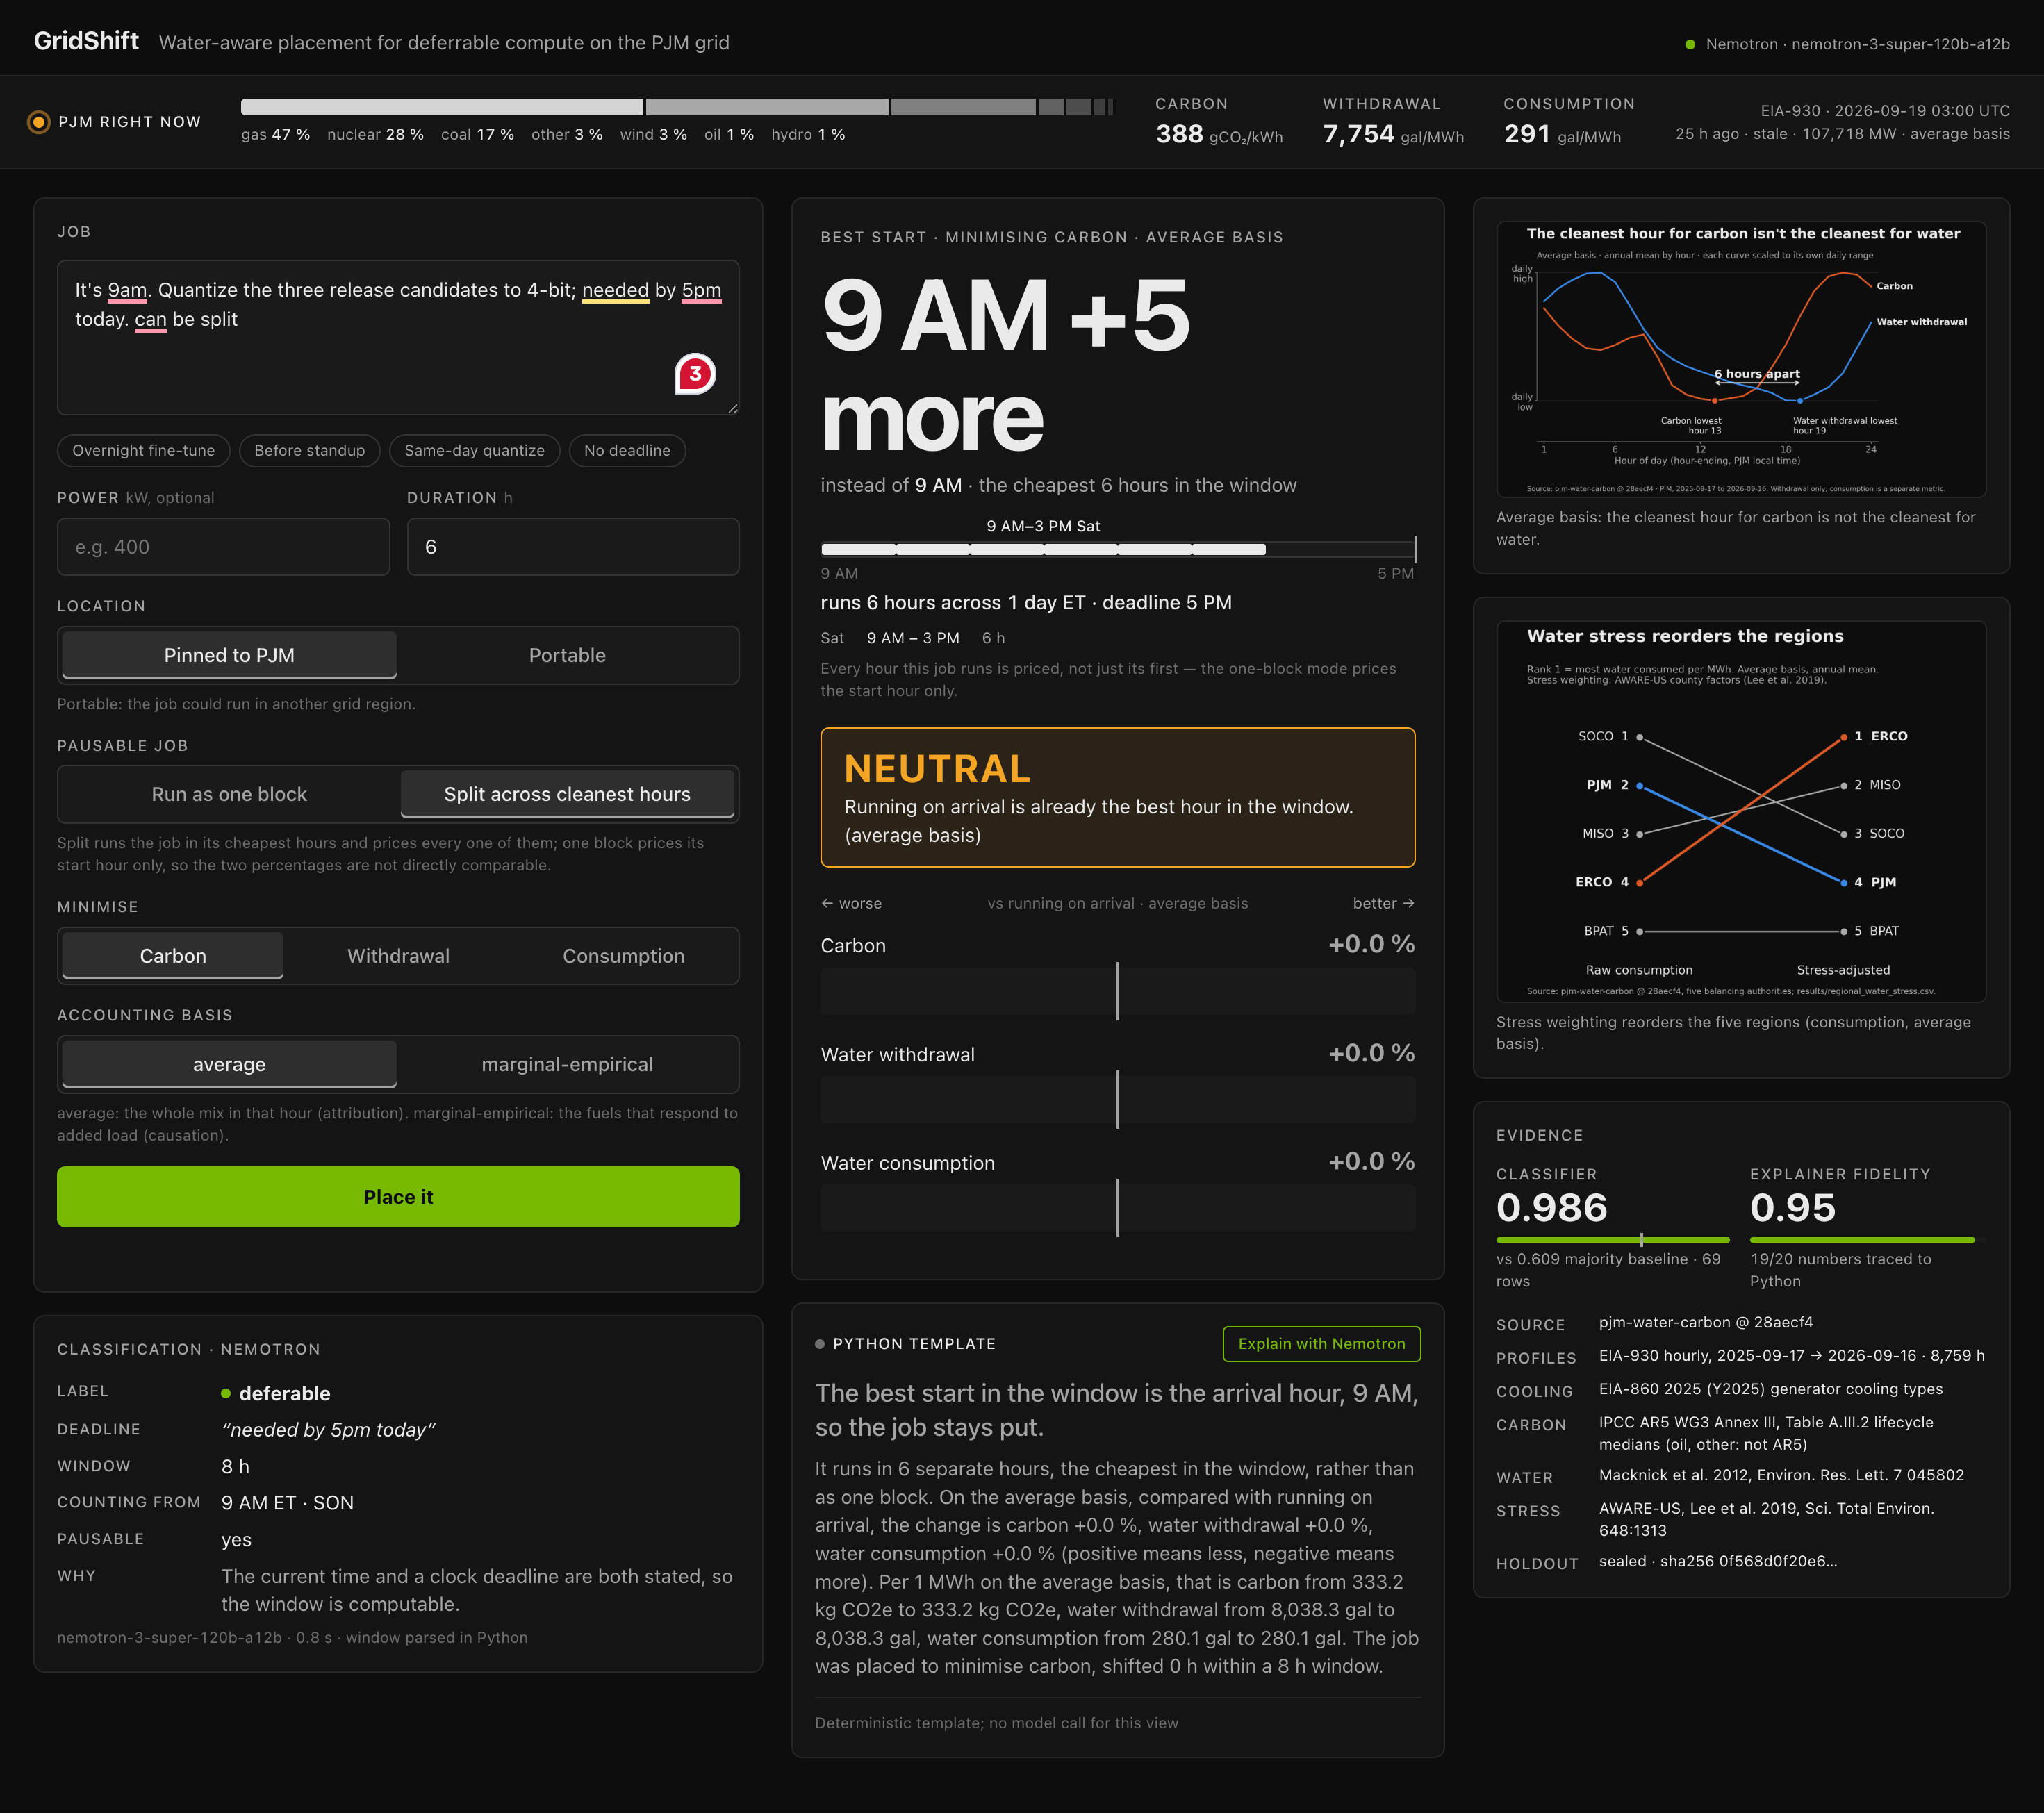
Here the arrival hour is already the best in the window, so the tool says so.
-
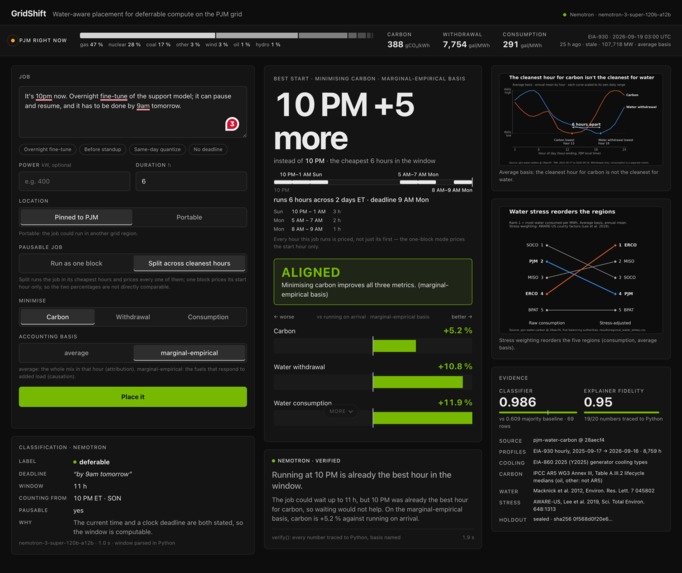
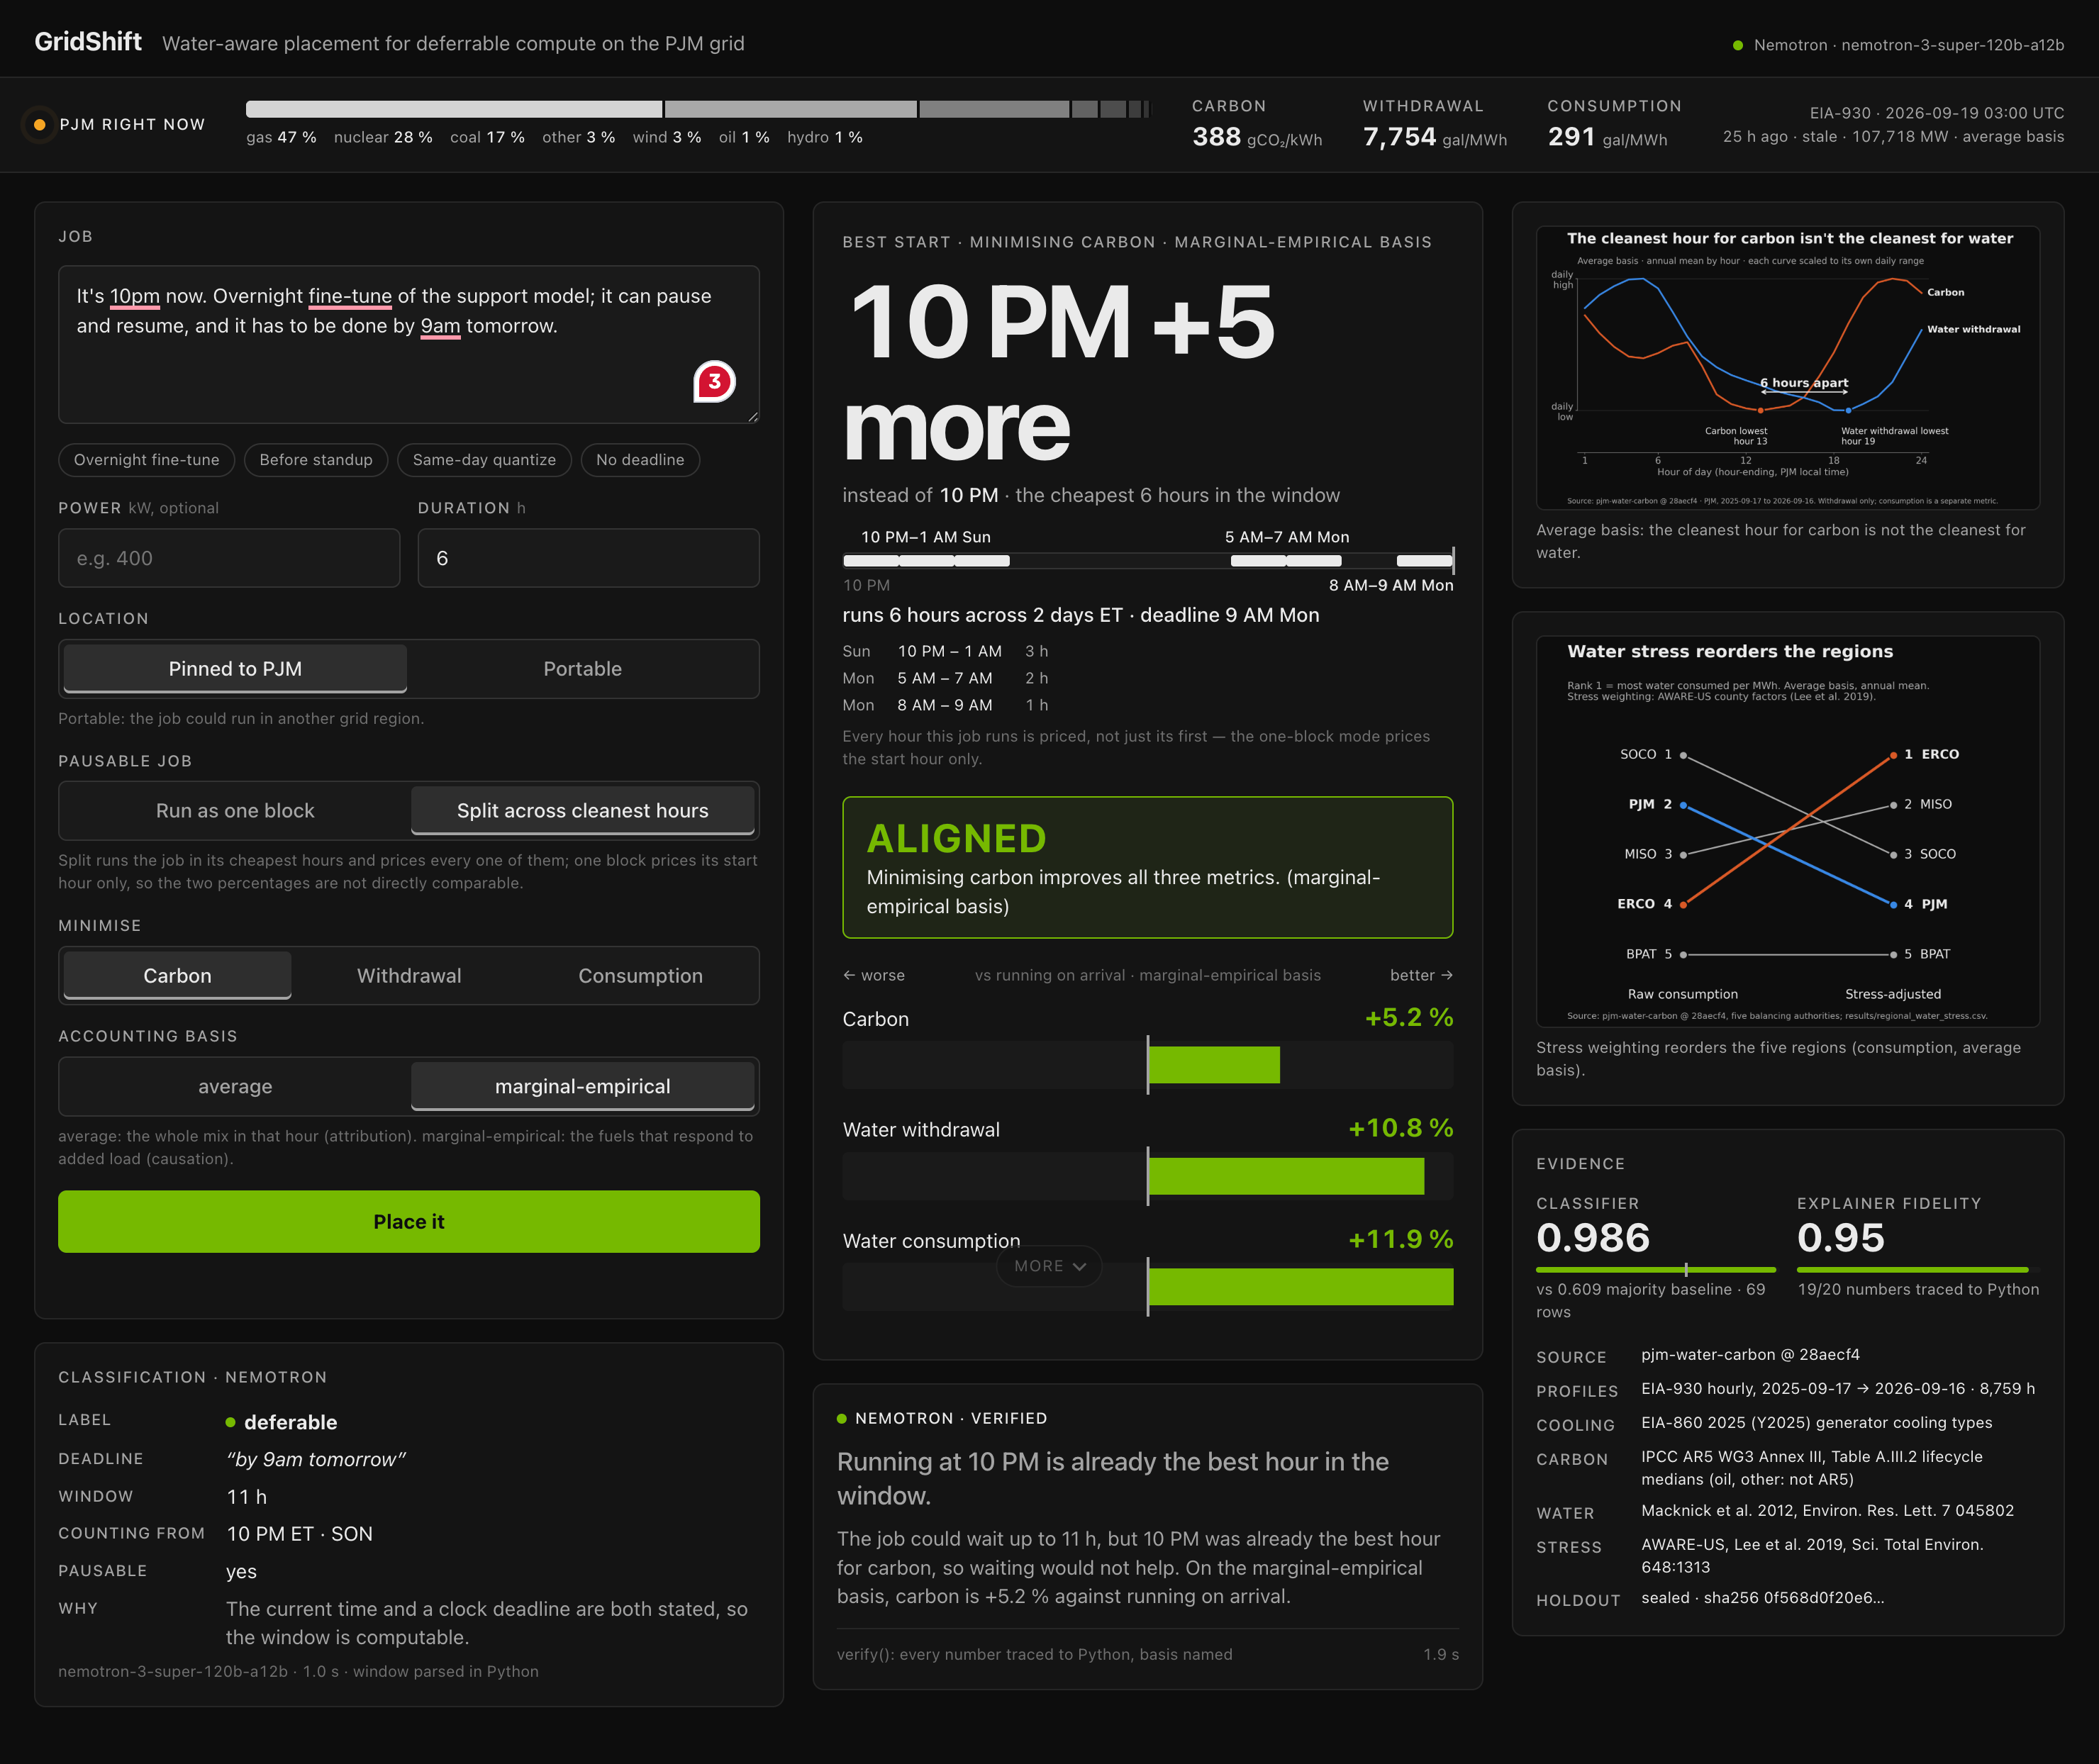
Same type of job, same hour. Switch how the electricity is counted and the recommendation changes.
-
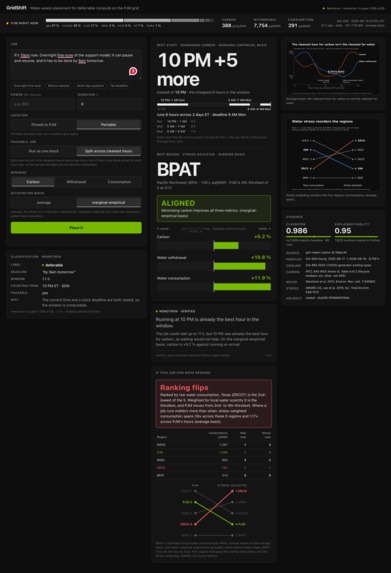
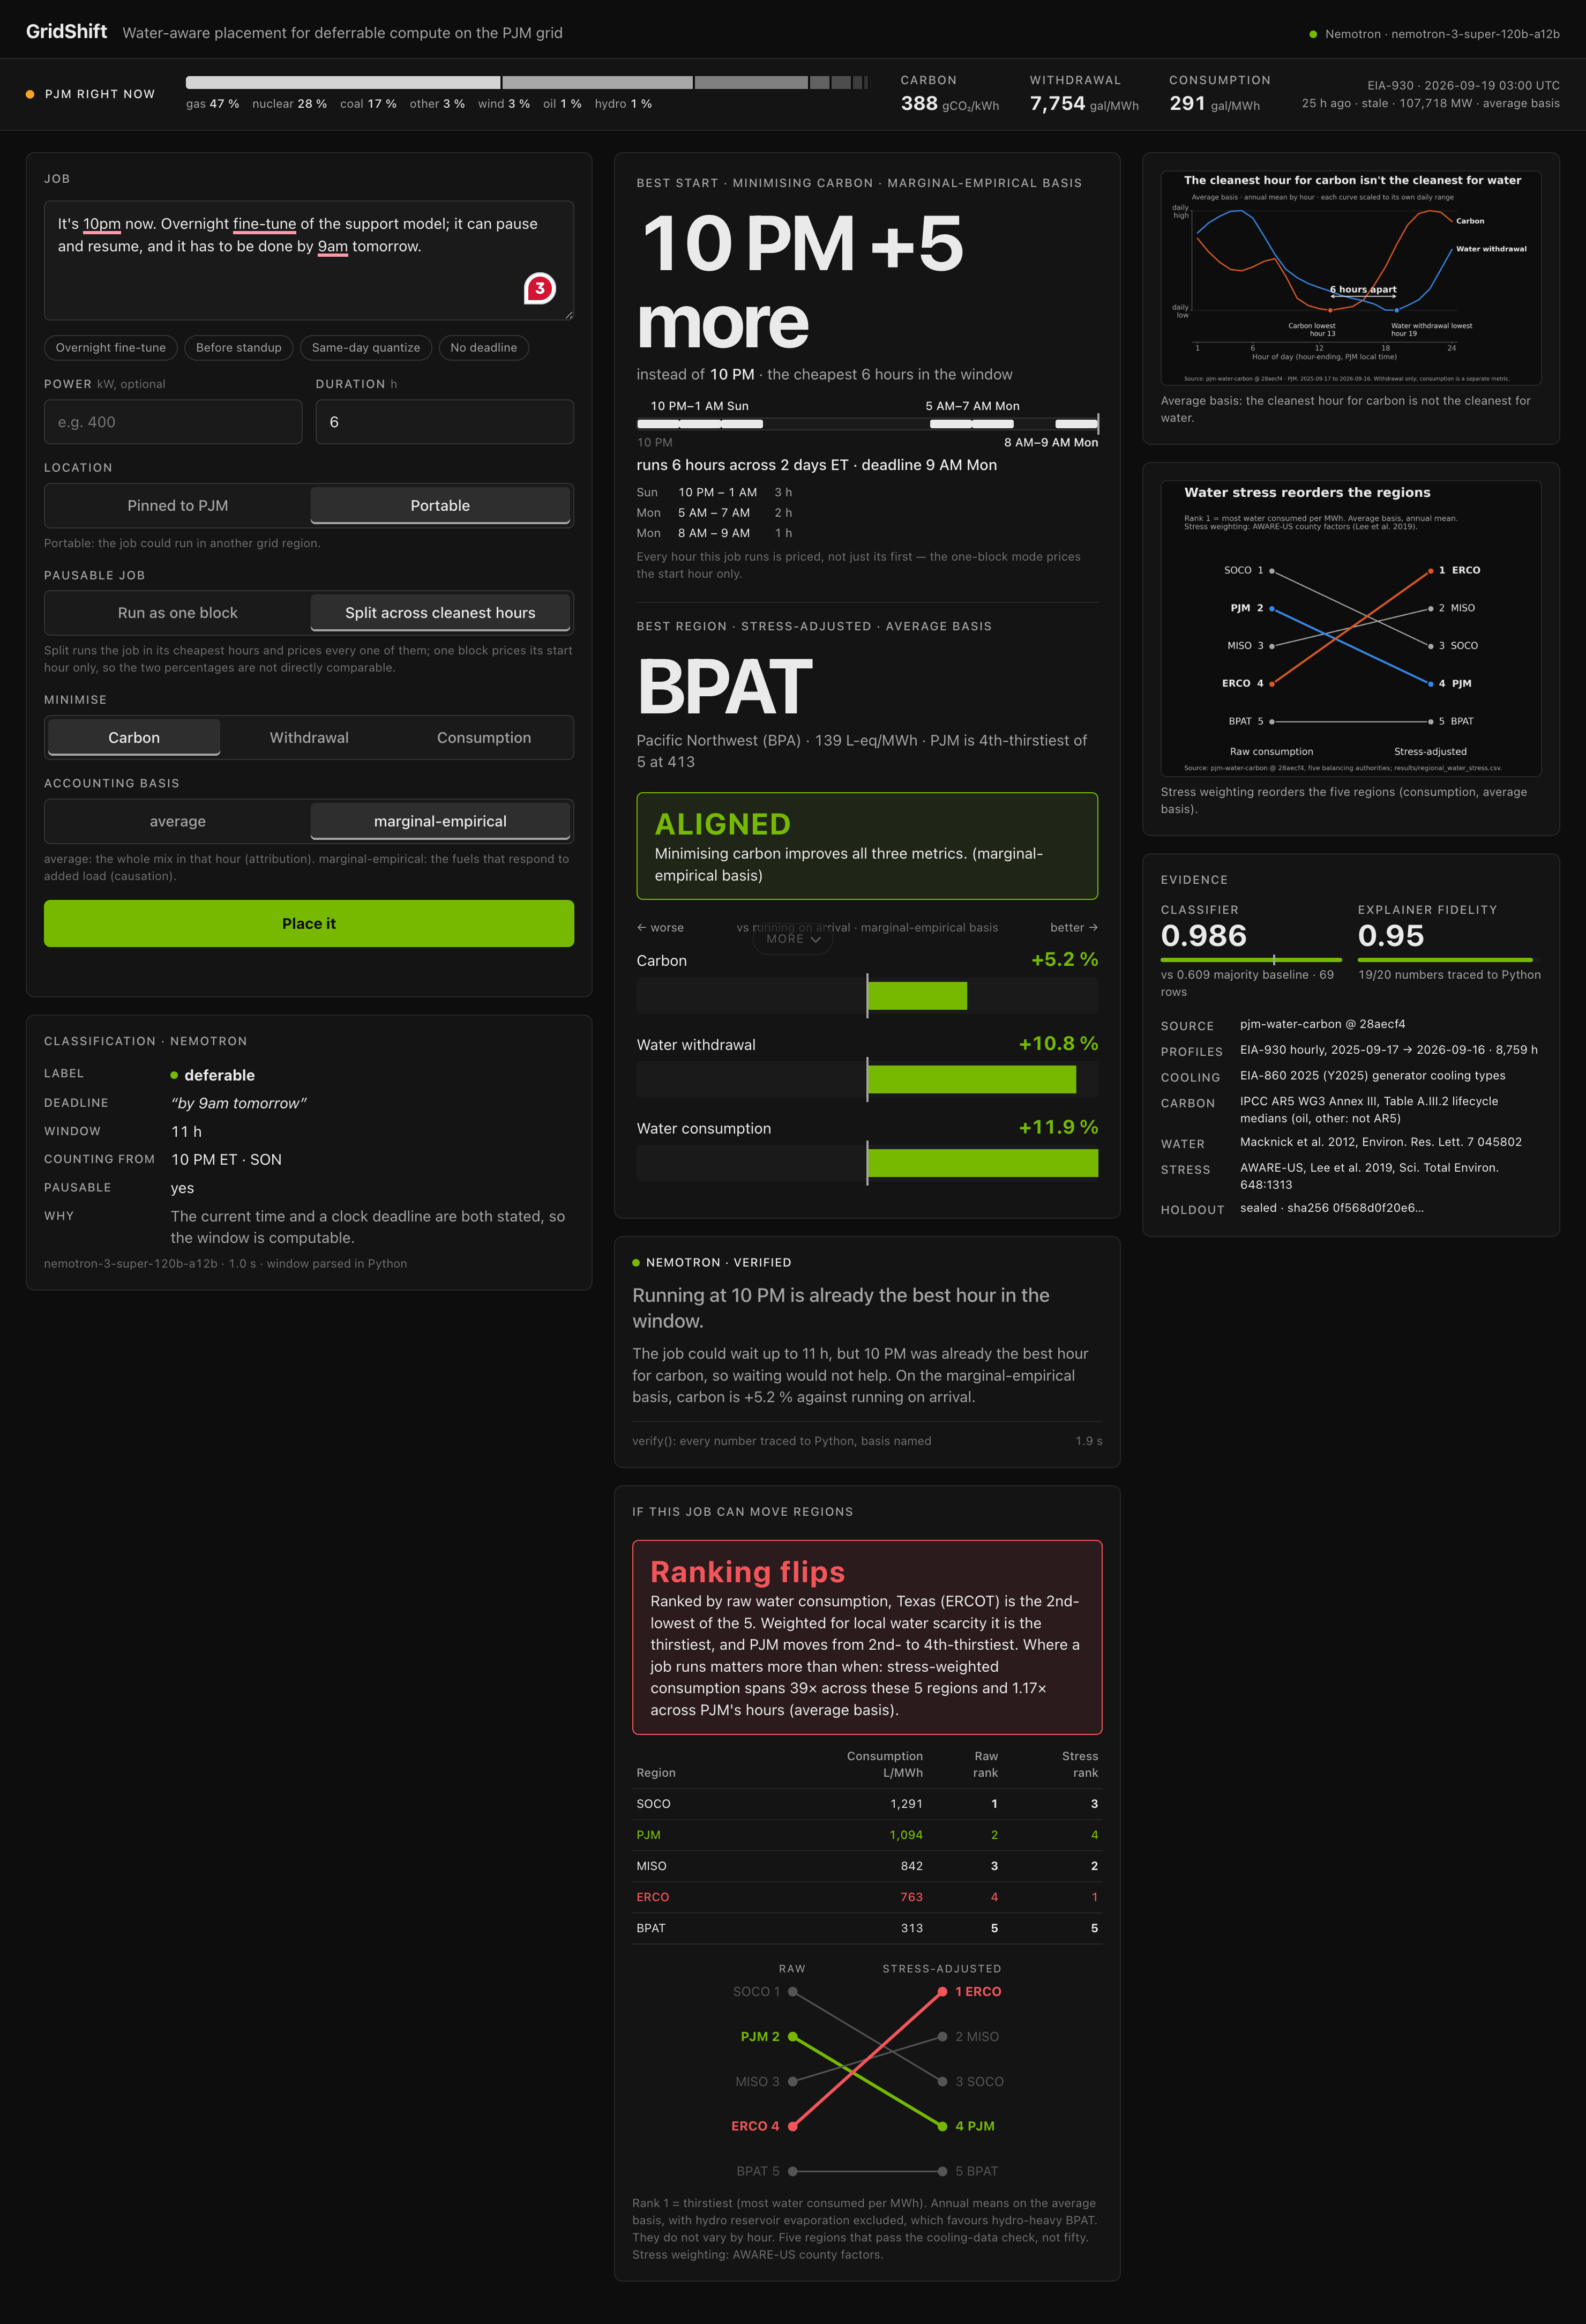
Some jobs can run in another part of the country. Picking by water use alone sends you to Texas, but is already in a drought.
-
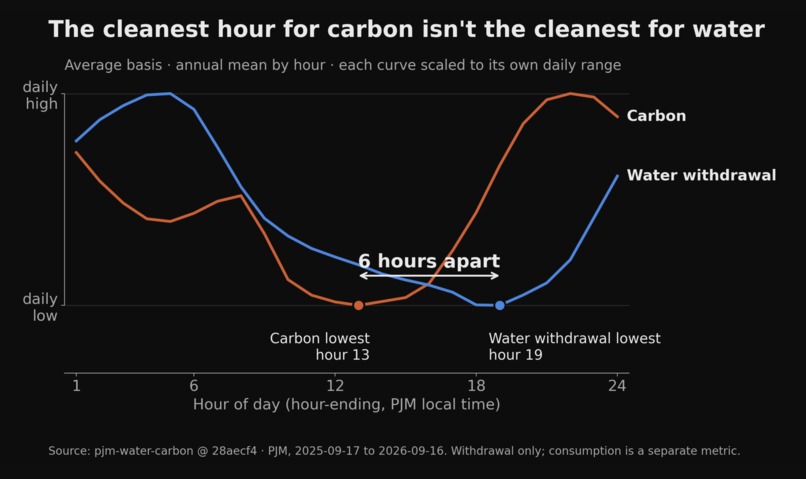
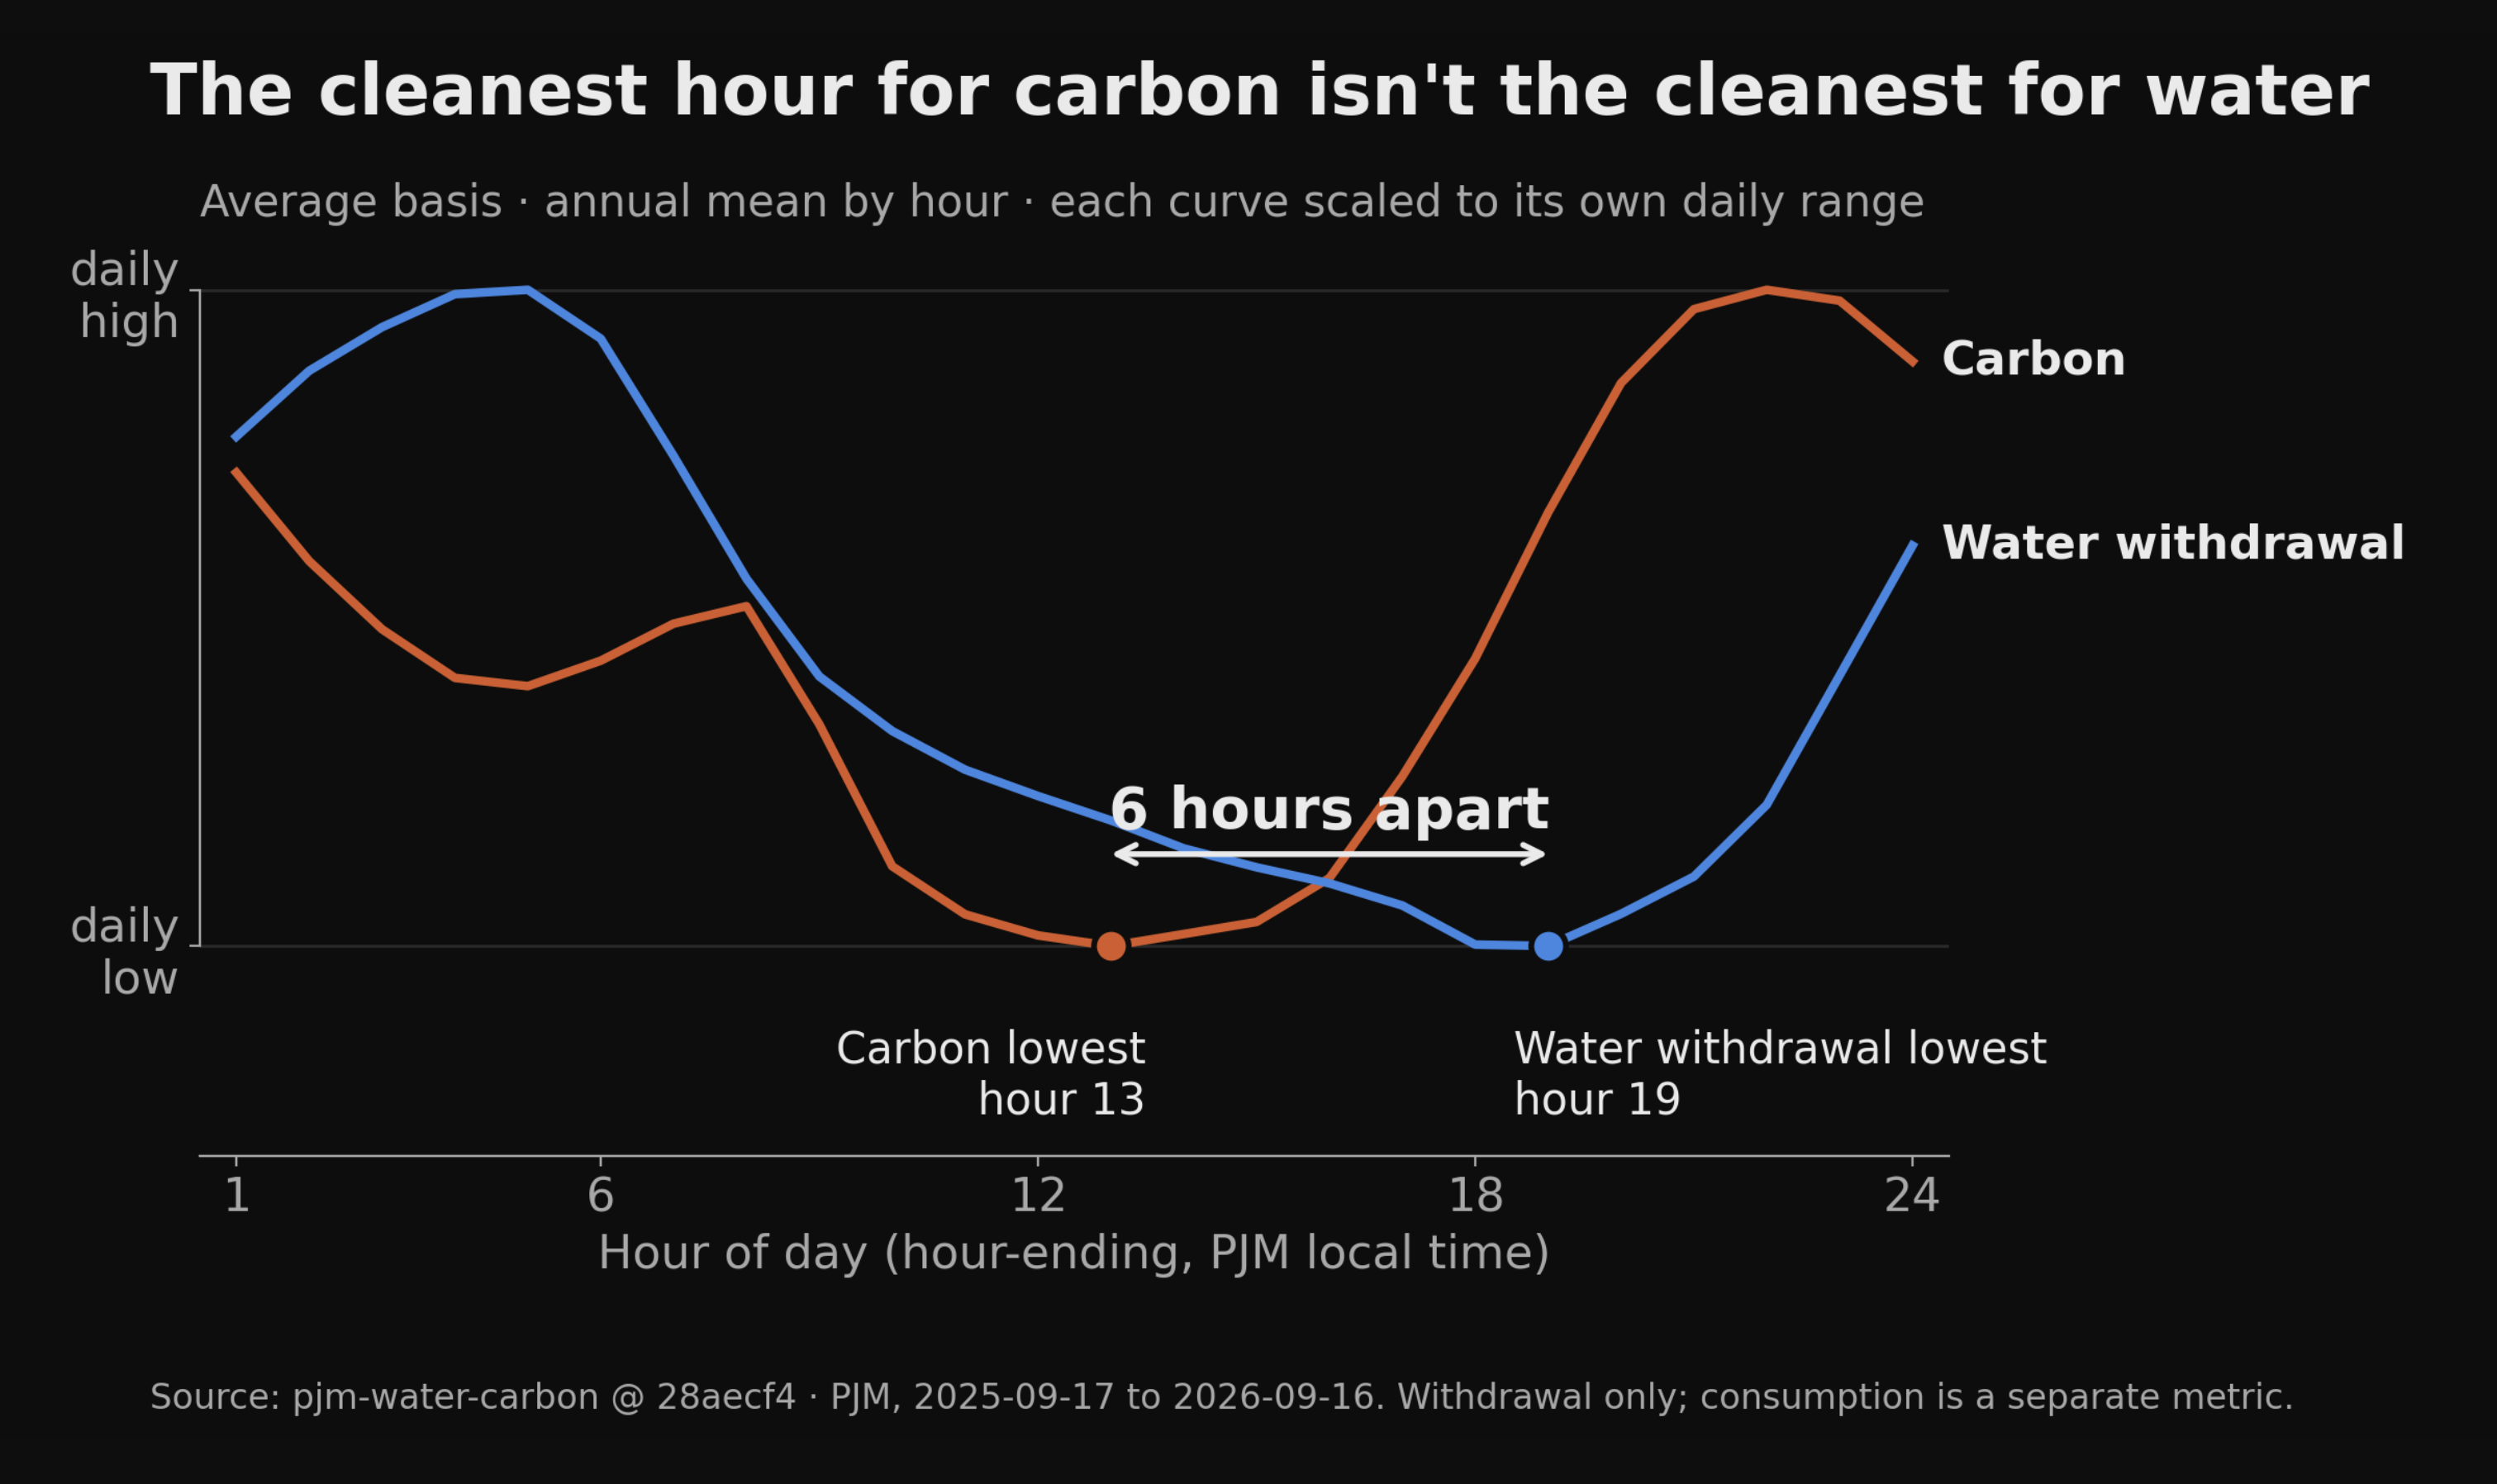
Carbon is lowest at 1pm. Water is lowest at 7pm. Six hours apart, nearly every day of the year.
-
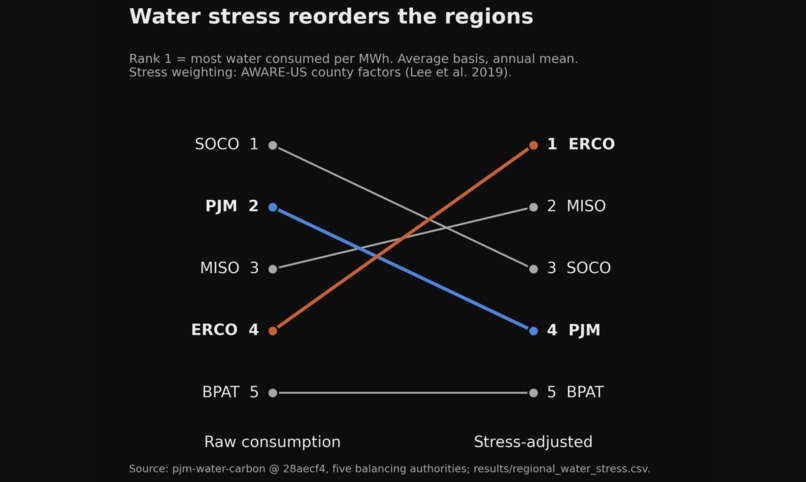
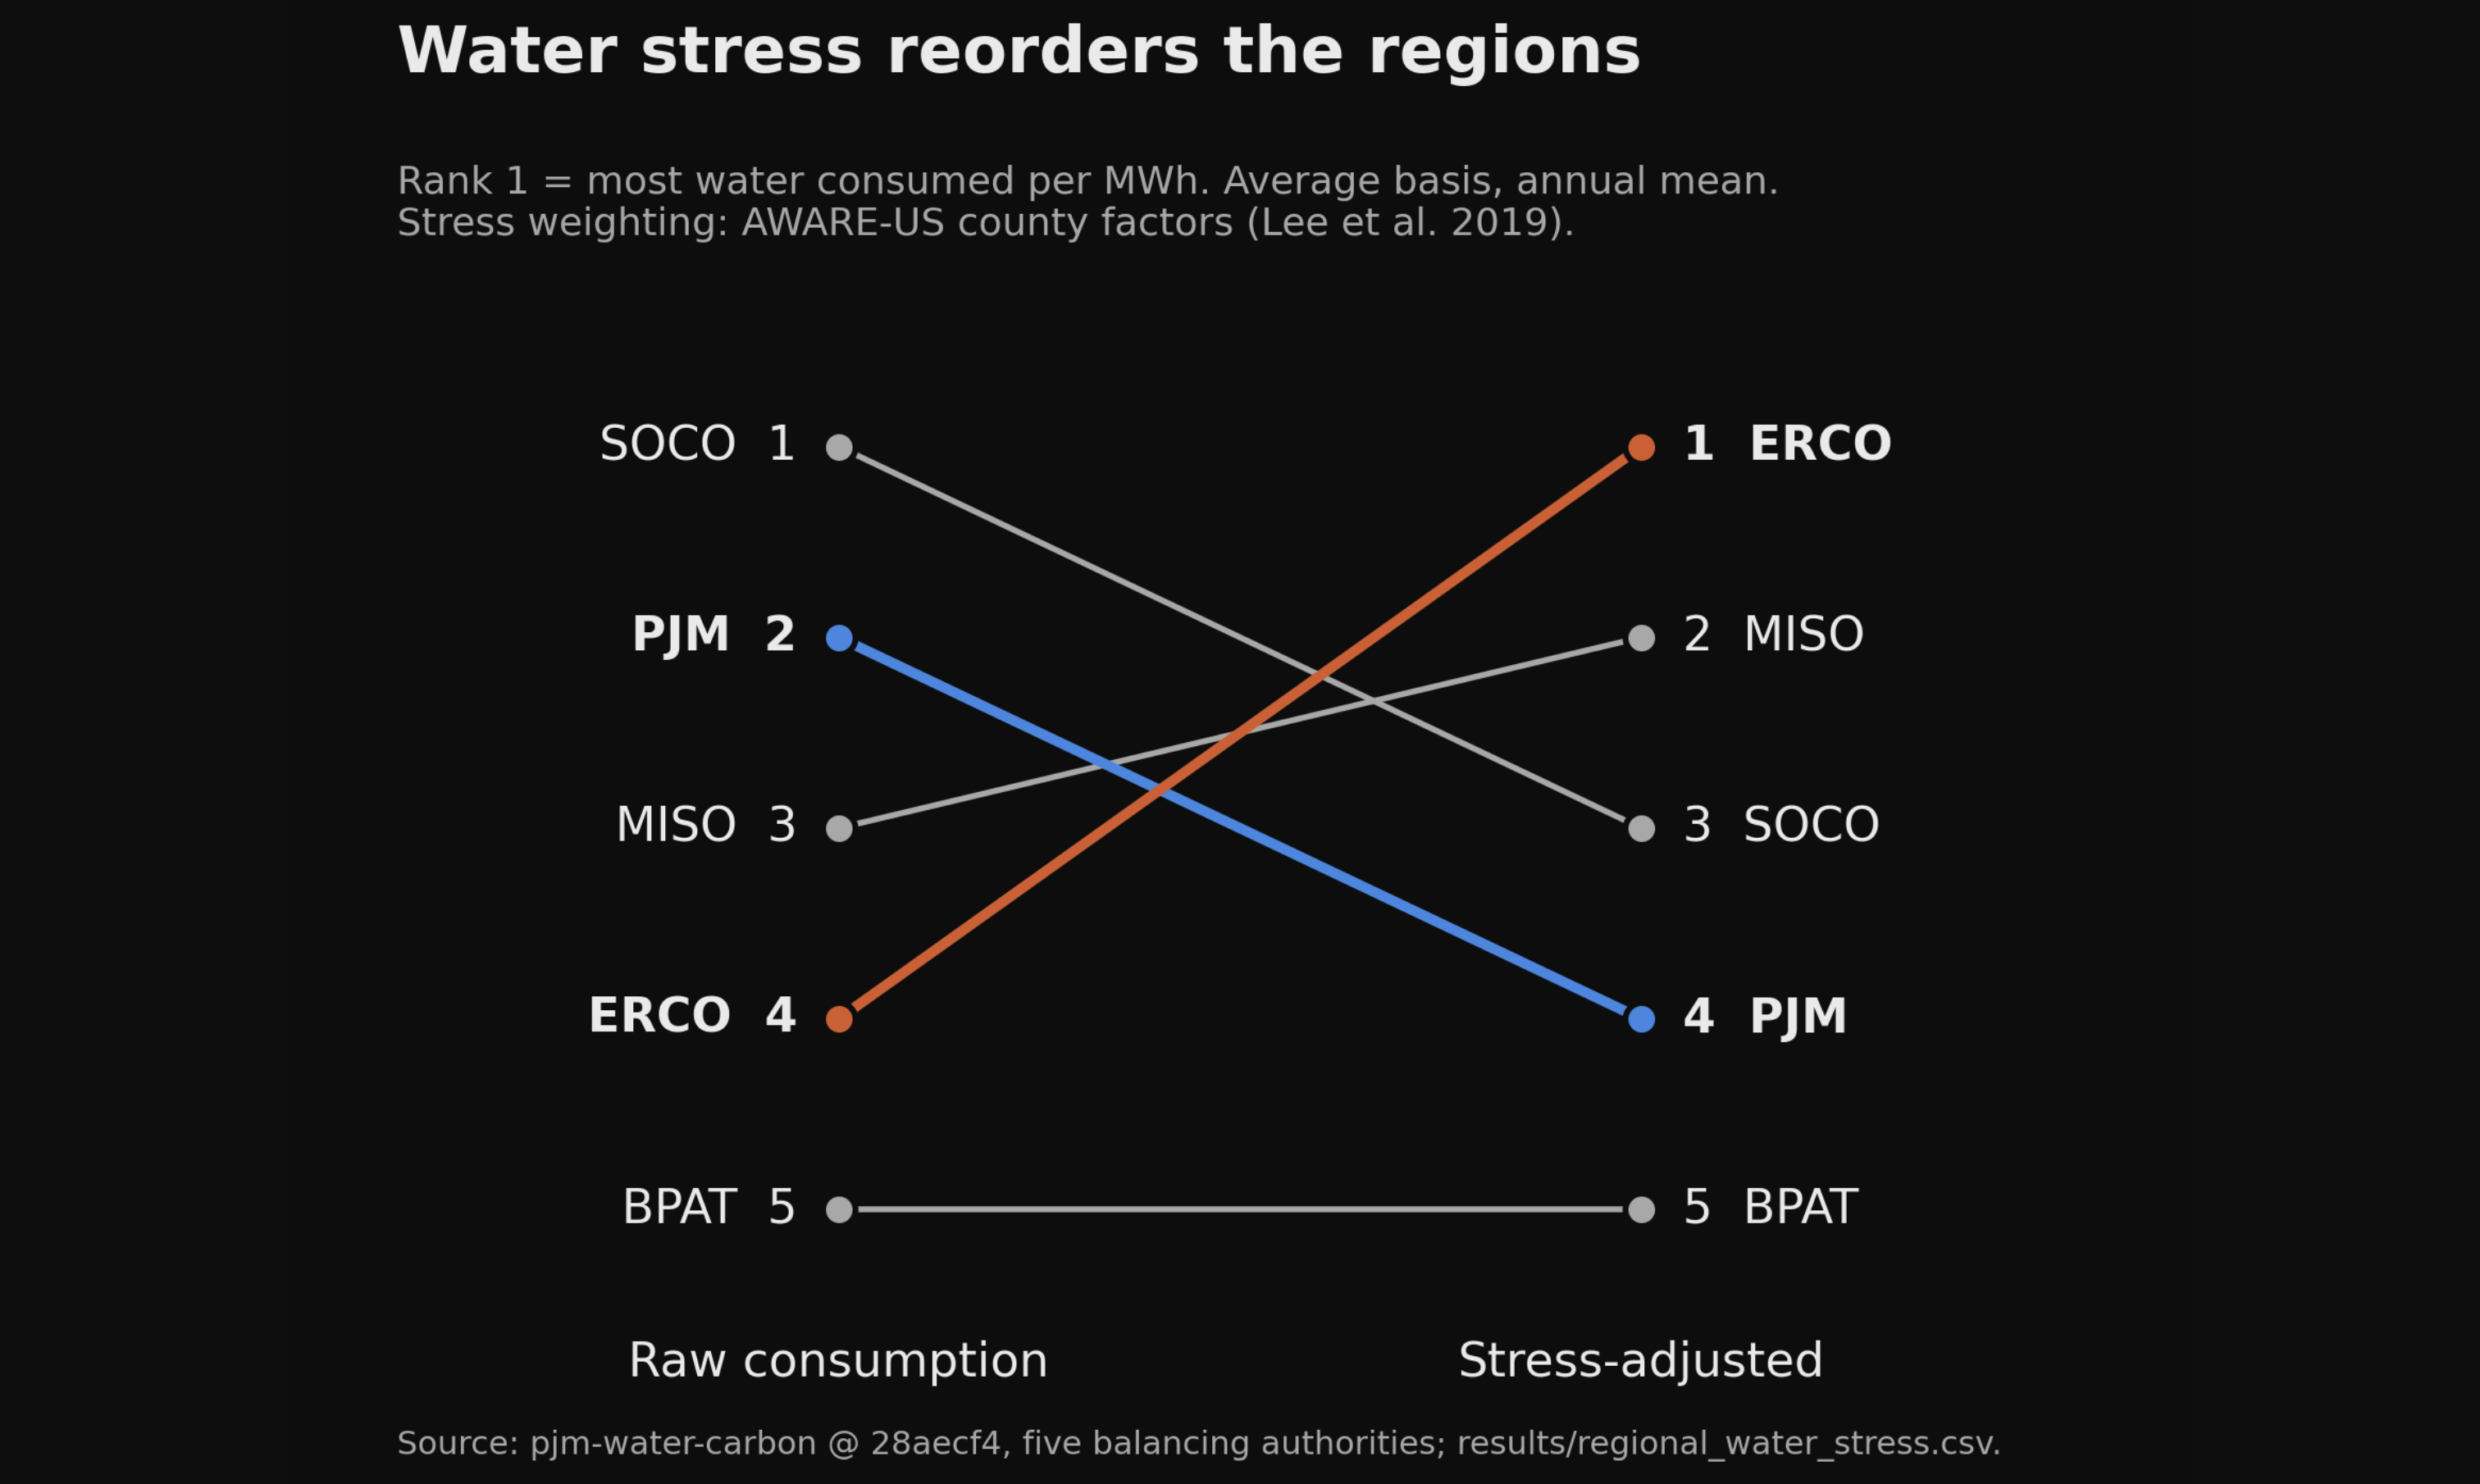
Ranked by raw amount of gallons, Texas looks fine. But, when accounting for local drought, it's the worst of the five.
Inspiration
Last summer I conducted research at Boston University, wondering how much carbon you can save by moving various energy-consuming tasks into cleaner grid hours. The answer was about 4%, and it was smaller during the winter, when there is no clean hour to move into. Timing relocates emissions more than it removes them.
So I went looking for what else these workloads cost. Water turned out to be the answer nobody was counting. Not the water in the cooling towers, but the water evaporated at the power plants making the electricity, which is far larger and rarely attributed to the workload that caused it.
What it does
You describe a job the way you'd message a coworker:
"It's 7pm now. Overnight fine-tune of the support model; it can pause and resume, and it has to be done by 7am Wednesday."
GridShift works out how long the job can wait, finds the best hours inside that window, and shows the savings or losses of carbon, water withdrawal and water consumption, each labelled with how it was counted. If the job can pause, it splits it across the cheapest hours over several days instead of running it in one block.
How Nemotron is used
Reads the plain typed-out English job and returns a verbatim quote of the words that set the deadline. It never returns several hours. Python checks the quote is real text from the input, then resolves it against anchors elsewhere in the sentence and does the arithmetic.
Narrates the tradeoff from a record Python built, using only pre-formatted strings from that record.
Python does everything else, ensuring that Nemotron never emits a number that Python never computed.
Challenges
Better prompts mattered more than better models. My accuracy jumped from 63.3% to 91.7% when I changed the question. Instead of asking if a job could wait, I asked what the text said. Before this change, the model never answered "unclear" regarding the given prompt since it was answering a different question.
The verifier missed word errors. It only checked numbers, but not the word's meaning. A bad example in my prompt accidentally taught the model to say the opposite of what happened, when carbon increased when it had improved. Every one of those passed verification. I fixed it by having Python work out the correct direction and hand it to the model as a fact.
Tests passed offline while the live app was broken twice. This happened because the testing tool filled in data before the user interface even loaded. While this worked in the test, it skipped the exact step-by-step order that caused the real browser to crash.
What I learned
Evals measure your labels as much as your model. A score with no baseline beside it isn't a score. And a guard that checks numbers can't see meaning.
What's next
Make the two modes comparable. Right now you can't compare the two job types directly. A split job counts every hour it runs, while a one-block job only counts the hour it starts. That means a split job can show a smaller saving on the page even when it's the better schedule. Counting the one-block job across its whole run would fix it.
Use a forecast. Right now it uses last year's averages for this season and hour, but not a prediction of tomorrow. Earlier work of mine measured that this costs about 12%, so it holds up, but a real forecast would be better.
More regions. I only included five regional grids. Three were left out because their power plants didn't have enough cooling-system data to be trusted.
Built With
- aware-us
- conformal-prediction
- css
- duckdb
- eia-860
- eia-930
- fastapi
- html
- javascript
- matplotlib
- nemotron-3-super-120b
- nvidia-nemotron
- openai-sdk
- pandas
- playwright
- pytest
- python
- streamlit
- uvicorn

Log in or sign up for Devpost to join the conversation.