-
-
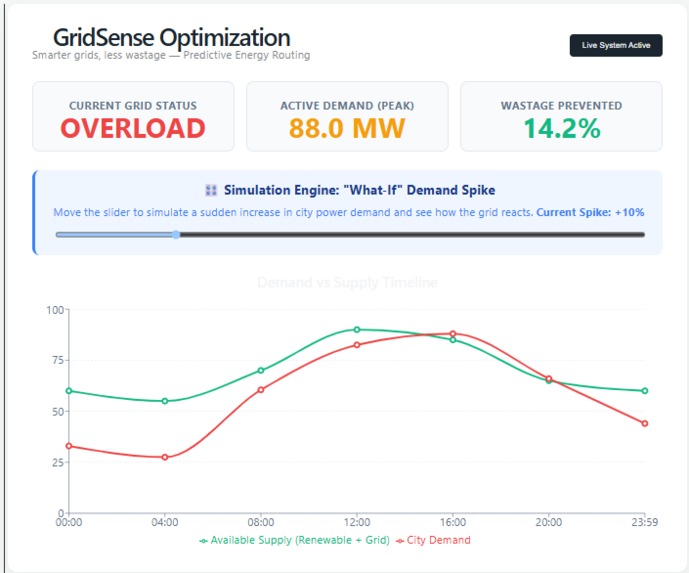
image2
-
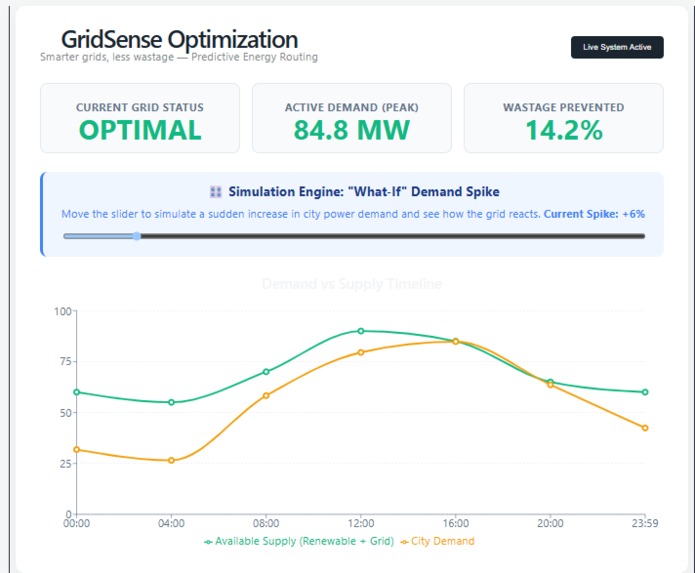
image3
-
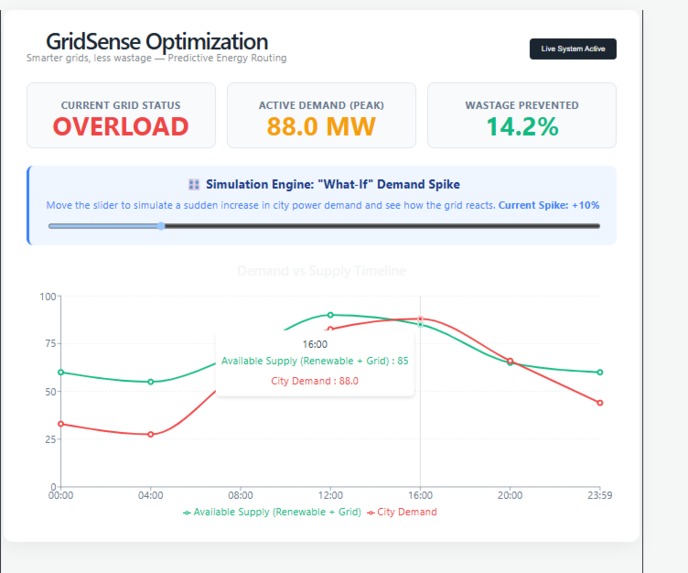
image1
Inspiration
Witnessing the stark contrast between renewable energy potential and actual grid inefficiency sparked this idea. Many developing regions suffer from severe blackouts during peak hours while simultaneously wasting solar and wind energy during off-peak times because their grids are reactive rather than predictive. The drive was to create an automated, cost-effective industrial solution that bridges this gap, transforming how municipalities manage their power distribution.
What it does
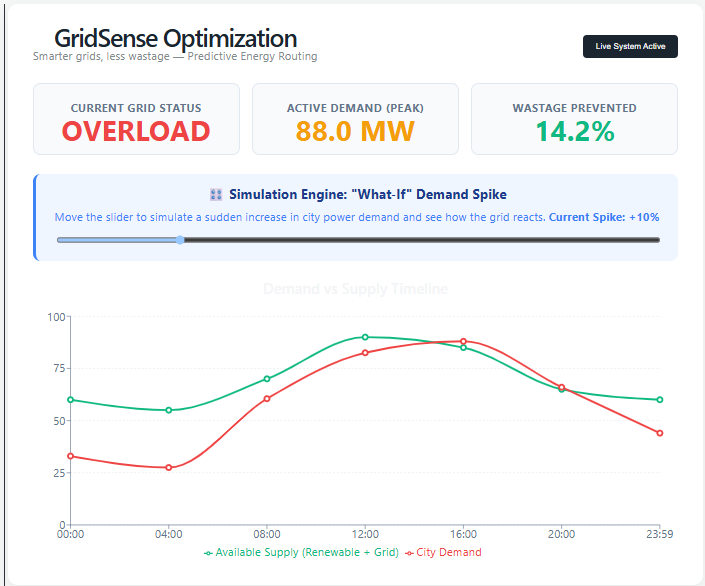
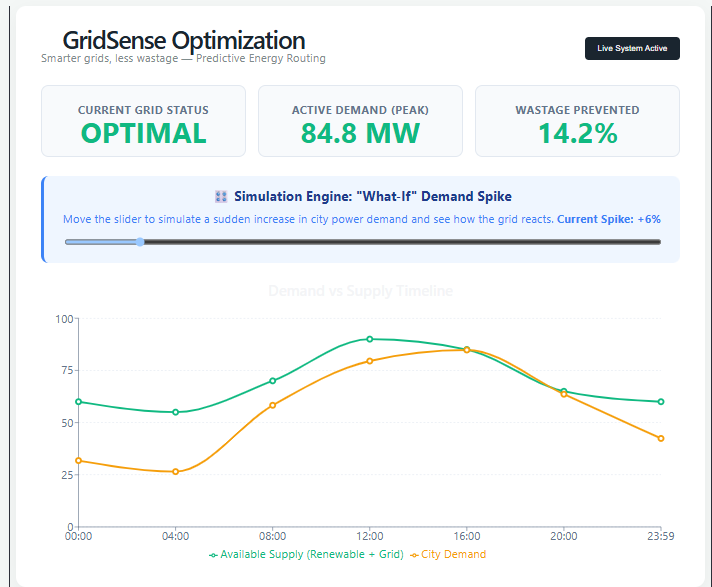
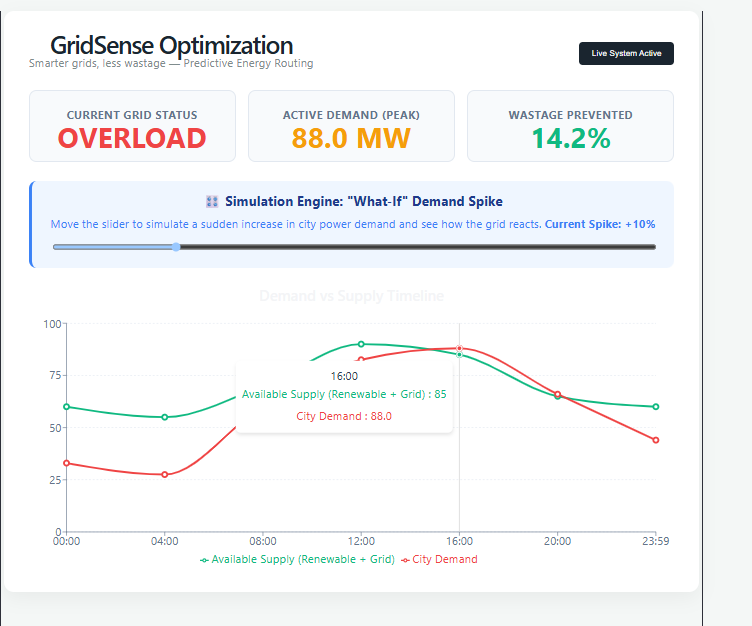
GridSense is a web-based, predictive energy routing dashboard operating on a B2B SaaS model. It monitors simulated real-time energy data and uses a priority-based allocation engine to distribute renewable energy efficiently. Its standout feature is the "Simulation Engine"—an interactive "What-If" slider that allows users to manually introduce sudden demand spikes to the system. This actively demonstrates how the grid automatically reroutes power to prevent overloads and minimize energy wastage, providing utility companies with a clear, actionable visualization of potential crises before they happen.
How we built it
The frontend architecture was rapidly prototyped utilizing React and Vite for fast execution. For the data visualization layer, Recharts was implemented to handle dynamic, state-driven timeline updates. The user interface was intentionally designed with a clean, minimalist tech aesthetic. By prioritizing ample negative space, straightforward typography, and flat-vector inspired color coding (Safe/Warning/Danger), the dashboard ensures that complex grid analytics remain highly intuitive and accessible for utility operators.
Challenges we ran into
The primary constraint was time. Building a functional, interactive prototype with dynamic state updates within a few hours required strict prioritization. Another significant challenge was balancing the UI; we had to ensure the data visualization was comprehensive enough to show real impact (like active demand vs. grid supply) without cluttering the minimalist interface. Creating the logic for the slider to dynamically update the timeline array on the fly also required careful state management.
Accomplishments that we're proud of
Successfully executing a working, interactive prototype under extreme time pressure is a massive win. We are particularly proud of the "What-If" simulation slider. Instead of presenting a static, boring B2B dashboard, we introduced a gamified, interactive element that allows users to actively break and fix the grid, making the problem-solution fit instantly understandable.
What we learned
This rapid development cycle reinforced the power of efficient component-based architecture in React. Furthermore, designing the business model highlighted how crucial user experience and clear data visualization are when pitching Software-as-a-Service (SaaS) solutions to traditional sectors like municipal energy boards.
What's next for GridSense
The immediate next step is to expand this prototype into a comprehensive, industry-based final year project. This expansion will involve replacing the simulation engine with live IoT sensor data integrations from local hardware. Additionally, we plan to implement a robust machine learning backend (using Python) to transition from simple rule-based allocations to advanced predictive modeling, ultimately scaling the software for cross-border municipal licensing.
Built With
- css
- html
- html5
- javascript
- react
- recharts
- vite

Log in or sign up for Devpost to join the conversation.