-
-
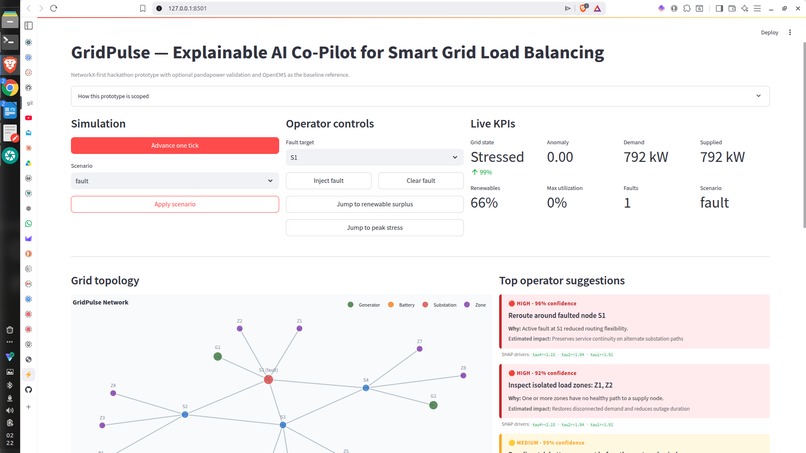
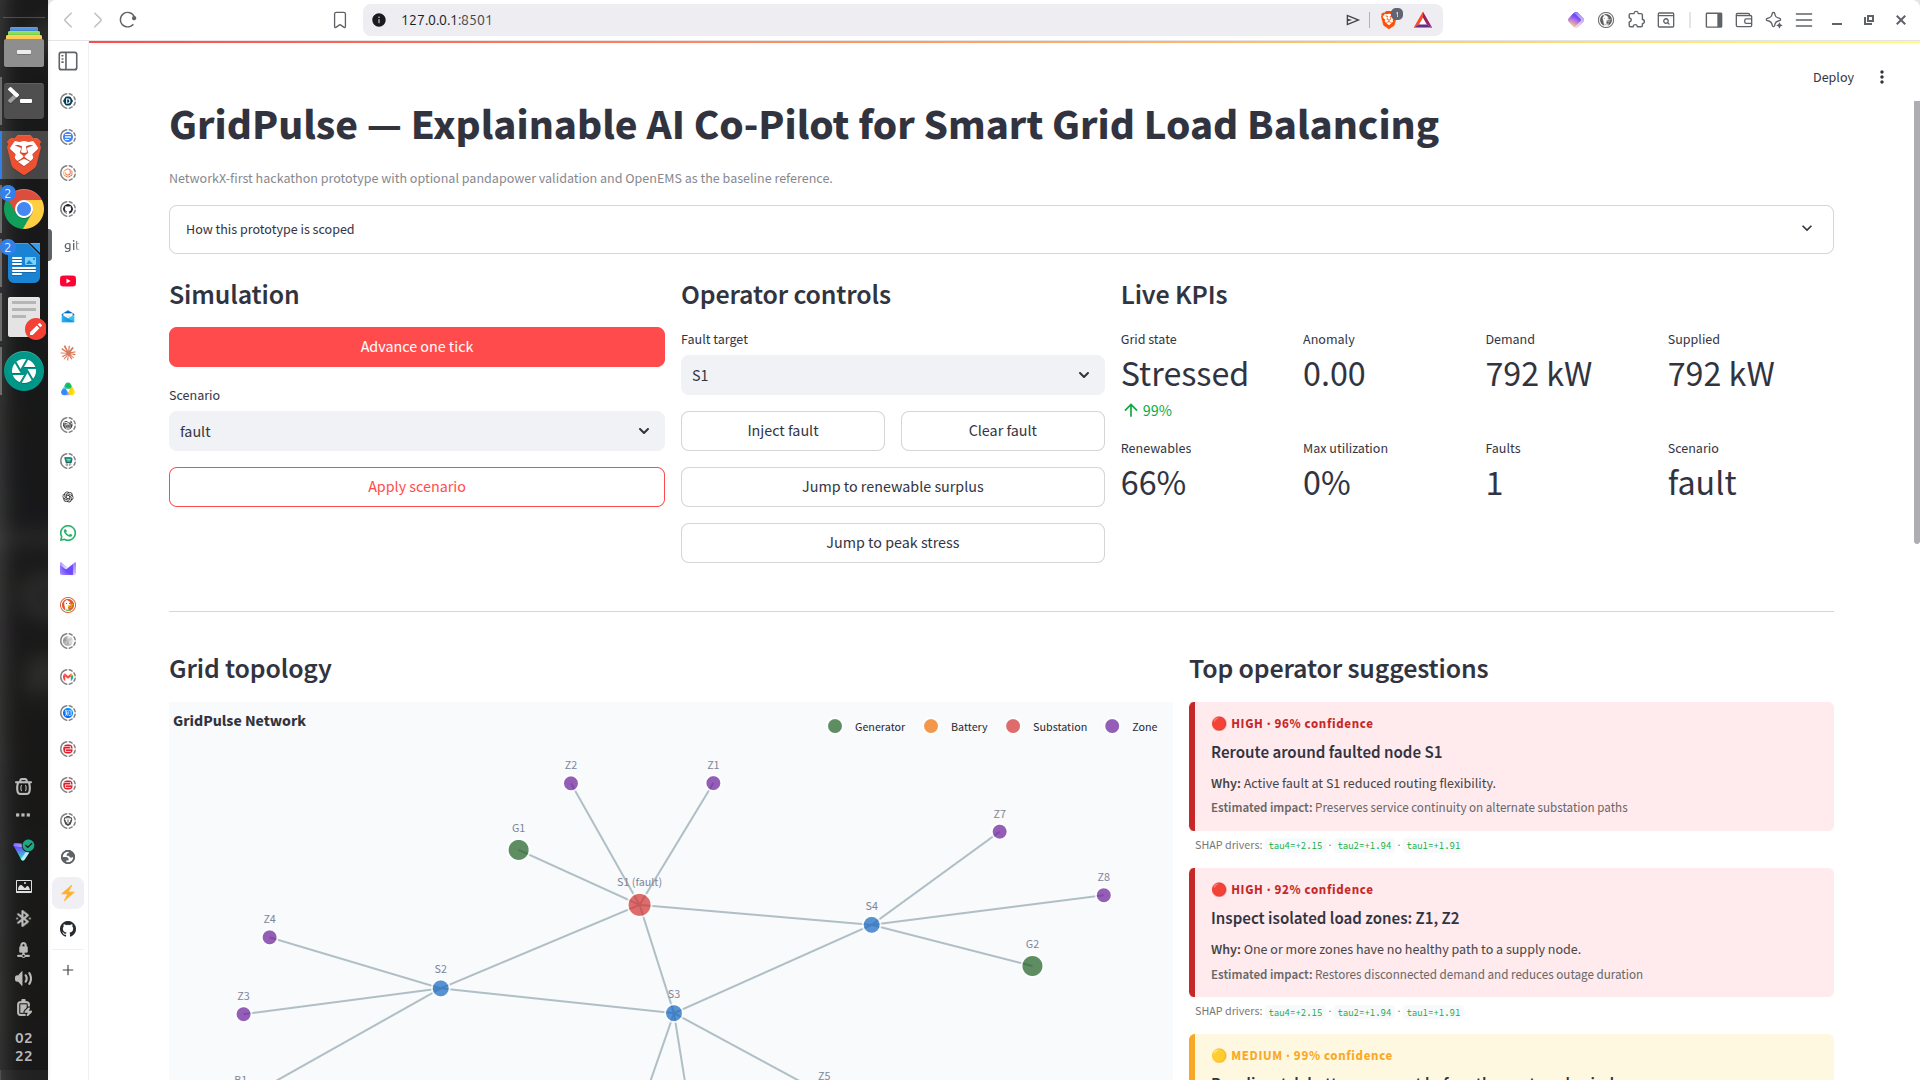
Home Prototype
-
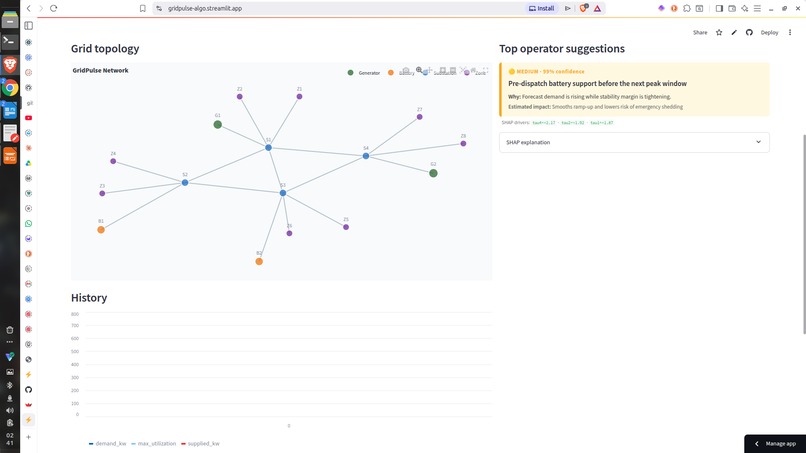
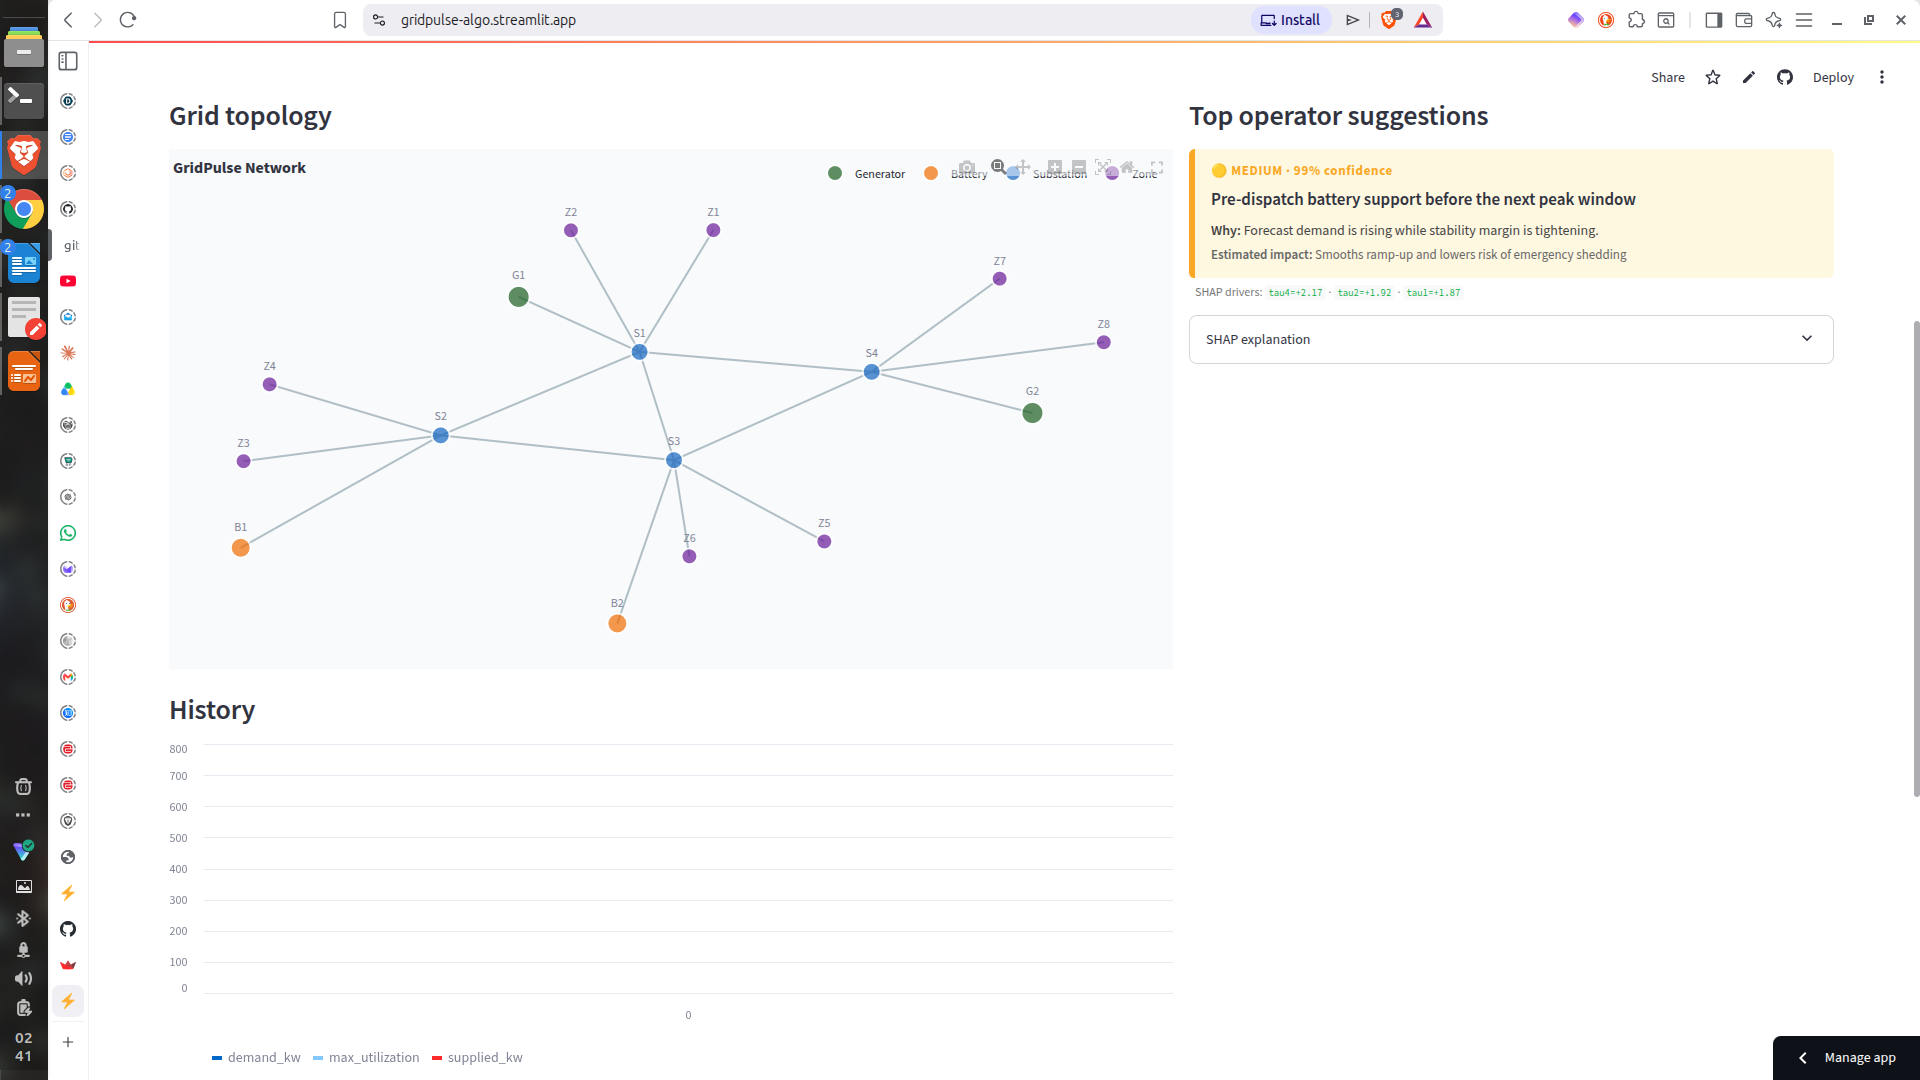
Topology & History
-
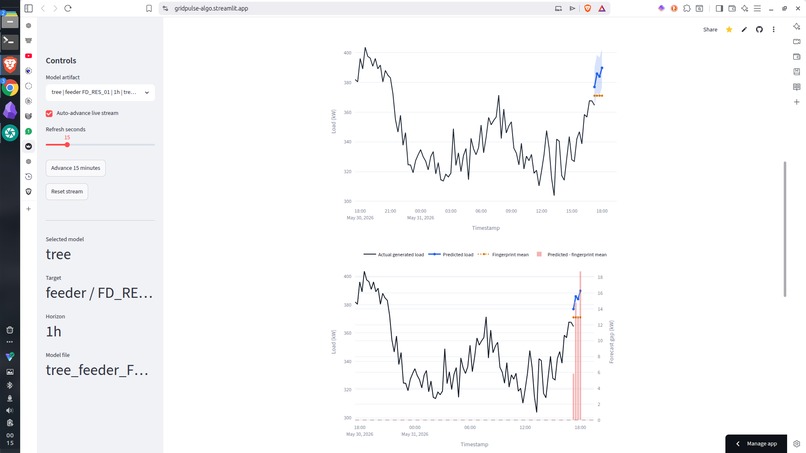
Grid Predictive Graph
-
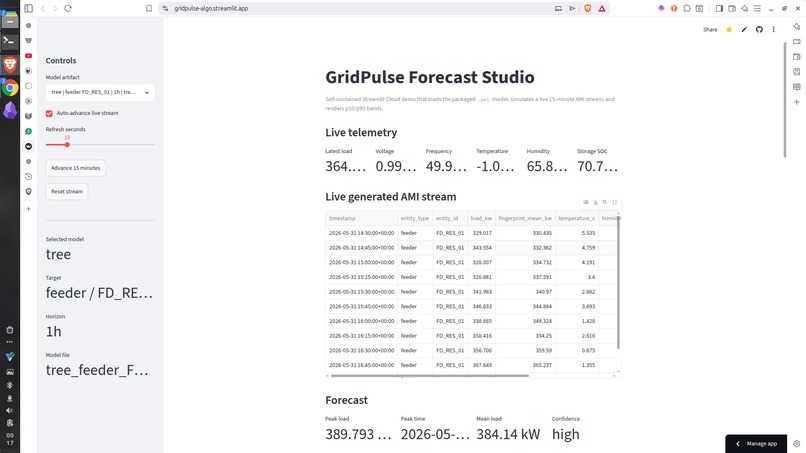
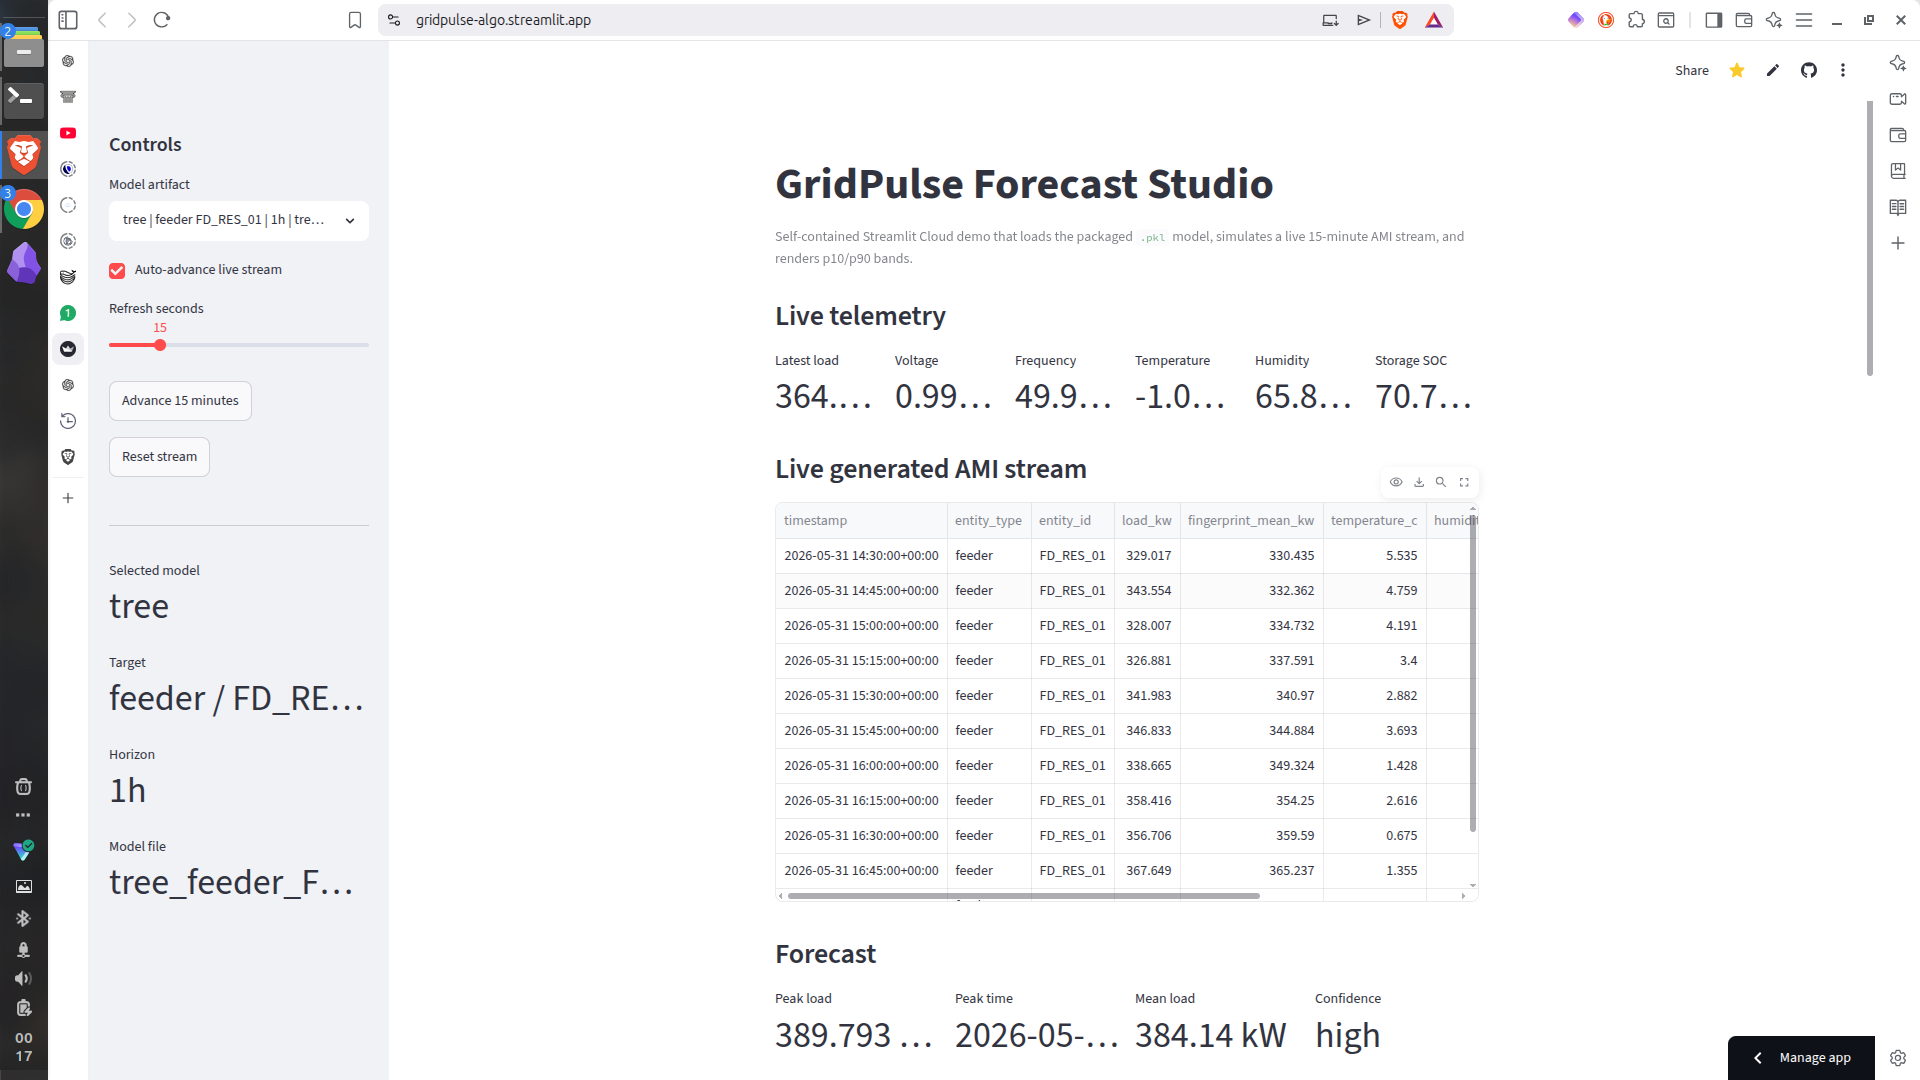
Demo Generation of the Live Data
⚡ GridPulse: Explainable Forecasting for Smarter Distribution Grids
About the Project
GridPulse is an offline, explainable smart-grid forecasting prototype built for secondary-substation and feeder-level decision support. It tackles a very practical problem in electricity distribution: operators need to know when demand will rise, where the rise is happening, and why the model believes a peak is coming.
The current MVP uses canonical 15-minute AMI/SMU-style data to forecast load at the secondary-substation and feeder level. It brings together synthetic grid-physics data generation, fingerprint baselines, tree-based forecasting, and explainable AI in a self-contained dashboard that runs offline or on Streamlit Cloud.
The larger GridPulse vision is a complete smart-grid decision-support framework spanning forecasting, routing, anomaly detection, OPF validation, and operator recommendations. For this phase, the working implementation is intentionally focused on forecasting and explanation.
Why This Matters
Traditional distribution systems often rely on delayed measurements, manual inspection, fixed operating rules, and reactive response. That creates waste in three ways:
- Electricity is lost in inefficient transmission and distribution networks.
- Demand peaks are handled late, forcing overuse of expensive backup capacity.
- Outages and voltage instability reduce productivity for homes, businesses, and industries.
This is not only a technical issue. The IEA estimates that, without improved security of electricity supply enabled by digital technologies, unreliable power systems in emerging and developing economies could create nearly USD 1.3 trillion in losses through 2030, with some countries facing GDP losses of up to 6%. Grid losses also mean extra electricity must be generated just to satisfy the same useful demand.
Nepal makes the problem personally meaningful. During the 2006–2017 power crisis, World Bank analysis found that avoiding load shedding would have required increasing average annual investment by 48%, while the crisis reduced exports by 2.8% and imports by 5.4%. More recently, World Bank analysis notes that over one-third of firms in Nepal reported losses exceeding 10% of annual sales due to power cuts in 2022.
GridPulse was built around a simple idea: if a distribution operator can see the next peak before it arrives, compare it with historical feeder fingerprints, and understand the model's reasoning, the grid can shift from reactive failure handling toward predictive operation.
Global and U.S. Context
The problem GridPulse addresses is global. The International Energy Agency describes electricity grids as a potential bottleneck for clean-energy transitions, because electrification, renewable generation, heat pumps, electric vehicles, and storage all depend on a grid that can predict, route, and balance power more intelligently.
The waste is visible in both developing and advanced grids:
- Globally, technical losses in grids are associated with roughly 1 gigaton of CO₂ emissions annually, according to IEA analysis — inefficient delivery doesn't just waste electricity, it forces extra generation and emissions.
- The IEA estimates that digital grid technologies could save USD 1.8 trillion in grid investment globally through 2050 by extending asset life, integrating renewables, and reducing interruptions.
- In the United States, the EIA estimates that transmission and distribution losses averaged about 5% of electricity transmitted and distributed from 2018 through 2022.
- Berkeley Lab estimates that sustained power interruptions cost U.S. electricity customers about USD 44 billion per year, with most of the direct cost borne by commercial and industrial customers.
- The U.S. Department of Energy's 2023 National Transmission Needs Study states that nearly all U.S. regions would gain reliability and resilience benefits from additional transmission investment, and that congestion and capacity constraints can increase consumer costs.
These numbers reinforce the core GridPulse idea: forecasting is not just a chart. It's an operational layer that can reduce late decisions, avoid unnecessary backup generation, improve feeder planning, and make future optimization and routing decisions more trustworthy.
Inspiration
Growing up in Nepal, power cuts were not rare events. They interrupted study, work, communication, and daily life. Even when electricity was technically available, weak distribution infrastructure, overloaded feeders, and delayed decision-making often made the supply unstable.
That led to the central question behind GridPulse:
Can power systems think ahead instead of failing behind?
The goal isn't to replace grid operators. It's to give them a clearer view of what is likely to happen next, why the system is making that forecast, and where attention should go first.
What It Does
The current GridPulse MVP provides:
- Synthetic 15-minute AMI/SMU history generation using grid-physics-inspired load patterns
- Feeder and substation fingerprint profiles built from historical time-slot behavior
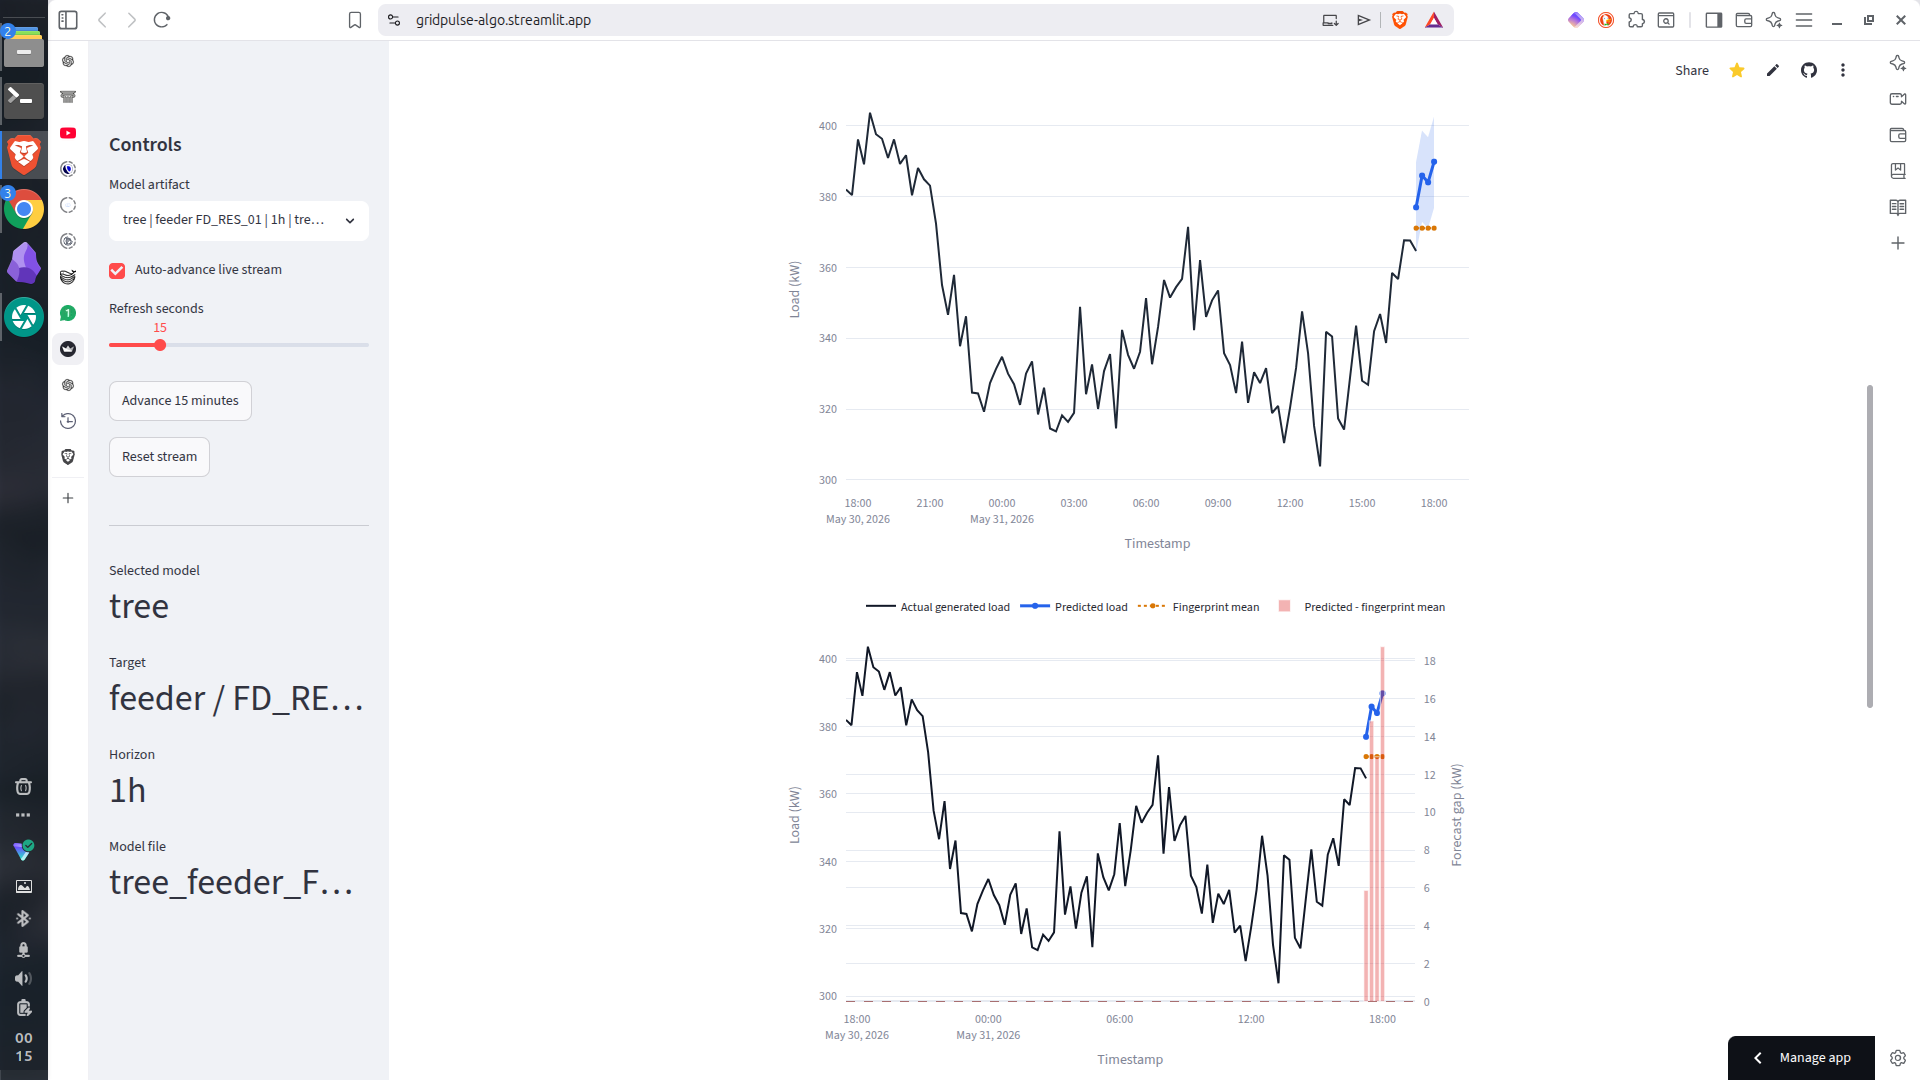
- Short-term load forecasting for a selected feeder
- p10/p90 confidence bands for forecast uncertainty
- Actual-versus-predicted visualization
- Live 15-minute synthetic data updates in the Streamlit dashboard
- Plain-language explanation of each forecast
- A packaged
.pklmodel artifact for Streamlit Cloud deployment
The dashboard shows the latest generated AMI stream, current load, voltage, frequency, temperature, storage state of charge, forecasted load, p10/p90 bands, the fingerprint baseline, and the predicted difference from the expected baseline.
Current MVP Scope
Implemented now:
- 15-minute canonical AMI forecasting pipeline
- Real-time dashboard
- Packaged RandomForest tree forecast model
- Fingerprint baseline comparison
- p10/p90 confidence visualization
- Real-time synthetic data generation in-session
- Research-backed project documentation
Paused for future phases:
- Anomaly detection
- Alerting
- GNN topology risk
- pandapower OPF validation
- Dynamic allocation
- Routing and control actions
- Recommendation engine
These modules may exist as earlier scaffolding in the repository, but they are not part of the active execution path for this phase.
How We Built It
GridPulse is built as a modular forecasting pipeline.
The canonical dataset uses 15-minute interval records with fields such as:
- Timestamp
- Secondary-substation ID
- Feeder ID
- Entity type and entity ID
- Load (kW)
- Interval energy (kWh)
- Temperature and humidity
- Season and time-slot features
- Fingerprint mean, p10, and p90
The model uses leakage-safe lag and rolling features, including recent load, daily patterns, weekly time-slot behavior, weather variables, and feeder fingerprints. The forecast output stays at 15-minute resolution, because that's the useful operating granularity for feeder-level planning.
For the demo, the packaged model is a tree-based RandomForest forecaster trained on synthetic AMI history. This choice keeps the system offline, explainable, and easy to deploy on Streamlit Cloud.
Research Foundation
GridPulse is grounded in research on smart-grid forecasting, explainable AI, and digital grid reliability:
- The IEA highlights smart grids and digitalisation as key tools for reliability, demand forecasting, flexibility, and improved distribution operations.
- Smart-meter-based load-forecasting reviews show that local-level AMI data enables more practical demand-response and distribution planning than conventional meter data.
- Short-term load forecasting literature identifies weather, calendar variables, historical demand, and time-of-day patterns as important inputs for operational forecasting.
- SHAP research provides a principled way to assign feature importance to model predictions — essential when forecasts influence critical-infrastructure decisions.
- Explainable energy-forecasting research argues that operators and users need interpretable forecasts, not just numerical predictions.
Challenges We Ran Into
Balancing vision and buildability
The full GridPulse vision includes routing, anomaly detection, OPF, and operator recommendations. For this phase, we narrowed the working system to forecasting and explanation so the demo could be reliable and easy to understand. Because real distribution-grid datasets weren't available to us, we synthesized the data using Monte Carlo methods constrained by grid-physics rules.
Making synthetic data realistic enough
Real distribution-grid data is hard to access because of privacy, infrastructure, and security constraints. We built synthetic AMI data with daily load curves, evening peaks, weather variation, seasonal effects, and feeder fingerprints so the model could be trained and demonstrated without live grid access.
Avoiding black-box forecasting
A forecast number alone isn't enough for grid operations — operators need to understand why a peak is expected. The MVP therefore includes fingerprint comparison, p10/p90 bands, actual-versus-predicted graphs, and plain-language explanation.
Deployment constraints
The system had to run under tight constraints. We packaged the trained model inside the repository and made the Streamlit app self-contained, removing the need for a backend server during the live demo.
Accomplishments
- Built a working, self-contained Streamlit Cloud dashboard
- Integrated a trained
.pklforecasting model into the demo - Added live synthetic 15-minute data generation
- Visualized actual load, predicted load, fingerprint baseline, and p10/p90 uncertainty bands
- Created a forecasting pipeline that runs fully offline
- Grounded the project in Nepal's real infrastructure-reliability context
- Kept future smart-grid modules cleanly separated from the active MVP
What We Learned
Grid reliability isn't only about generating more electricity. It's also about using data to understand where demand is moving, how feeders behave, and when small instabilities could grow into operational problems.
We also learned that explainability matters early. In critical infrastructure, accuracy alone isn't enough — a model must be able to show the evidence behind a forecast so a human operator can judge whether the recommendation is credible.
What's Next
The next engineering steps are to:
- Train additional models for substation and enterprise dedicated-line targets
- Add SHAP explanations directly into the Streamlit demo
- Improve the synthetic generator with more feeder classes and industrial production schedules
- Benchmark tree models against TCN and N-HiTS models
- Connect the forecasting output to OPF and routing modules in a later phase
- Test the system against real AMI or utility feeder data when available
Closing Thought
GridPulse started from a simple observation: power cuts aren't only moments of darkness — they're signals that the grid lacked enough visibility, prediction, or adaptive response.
This MVP is a first step toward a smart-grid assistant that can look at the next hour of feeder demand, explain what it sees, and help operators act before instability becomes failure.
Dataset and Model
GridPulse uses a synthetic 15-minute AMI/SMU dataset generated under grid-physics-inspired constraints. The data models feeder and secondary-substation behavior with daily demand curves, peak-hour growth, weather sensitivity, seasonal patterns, interval-energy conversion, feeder fingerprints, and the unavoidable technical/mechanical losses present in distribution infrastructure.
- Training dataset: https://www.kaggle.com/datasets/susankyasha/gridpulse-forecasting-inputs
- Trained model artifact: https://www.kaggle.com/code/susankyasha/pulsegrid/output?select=tree_feeder_FD_RES_01_1h.pkl
The current MVP focuses on forecasting load downstream of the secondary substation. By forecasting feeder usage at 15-minute resolution, GridPulse helps identify feeders with lower available margin, rising demand, or repeated peak behavior before overload becomes a power-cut event. This supports better secondary-substation planning, more balanced feeder utilization, fewer avoidable outages, and improved operational visibility.
The system does not claim to eliminate all losses. Mechanical and technical losses in transformers, conductors, joints, and grid equipment are physically unavoidable. Instead, GridPulse aims to reduce avoidable operational waste: late decisions, poor peak visibility, inefficient feeder loading, unnecessary backup usage, and preventable overload conditions.
References
- International Energy Agency, "Unlocking Smart Grid Opportunities in Emerging Markets and Developing Economies": https://www.iea.org/reports/unlocking-smart-grid-opportunities-in-emerging-markets-and-developing-economies/executive-summary
- International Energy Agency, "Smart Grids": https://www.iea.org/reports/smart-grids
- International Energy Agency, "Sustainable Recovery: Electricity": https://www.iea.org/reports/sustainable-recovery/electricity
- International Energy Agency, "Electricity Grids and Secure Energy Transitions": https://www.iea.org/reports/electricity-grids-and-secure-energy-transitions
- International Energy Agency, "Power system digitalisation is crucial for clean energy transitions and security in developing markets, but investment is lagging": https://www.iea.org/news/power-system-digitalisation-is-crucial-for-clean-energy-transitions-and-security-in-developing-markets-but-investment-is-lagging
- U.S. Energy Information Administration, "How much electricity is lost in electricity transmission and distribution in the United States?": https://www.eia.gov/tools/faqs/faq.php?id=105&t=11
- Lawrence Berkeley National Laboratory,** "Berkeley Lab estimates sustained electric power interruptions cost the U.S. approximately $44 billion annually"**: https://emp.lbl.gov/news/berkeley-lab-estimates-sustained
- U.S. Department of Energy, "National Transmission Needs Study": https://www.energy.gov/oe/national-transmission-needs-study
- World Bank, "Economics of unreliable power supply: lessons from the 2006–2017 Nepal power crisis": https://blogs.worldbank.org/en/developmenttalk/economics-unreliable-power-supply-lessons-2006-2017-nepal-power-crisis
- World Bank, Nepal Country Economic Memorandum 2025: https://documents1.worldbank.org/curated/en/099032125103030263/pdf/P179761-430153ad-672c-4418-89c5-ef3740c6511.pdf
- Lundberg and Lee, "A Unified Approach to Interpreting Model Predictions": https://arxiv.org/abs/1705.07874
- "Load Forecasting Models in Smart Grid Using Smart Meter Information: A Review": https://www.mdpi.com/1996-1073/16/3/1404/htm
- "ForecastExplainer: Explainable household energy demand forecasting": https://www.sciencedirect.com/science/article/pii/S0040162524003846
- "A Four-Dimensional Analysis of Explainable AI in Energy Forecasting": https://www.mdpi.com/2504-4990/7/4/153
Built With
- fastapi
- github
- lightgbm
- matplotlib
- networkx
- numpy
- pandapower
- pandas
- python
- scikit-learn
- shap
- streamlit
- uv
- uvicorn

Log in or sign up for Devpost to join the conversation.