Inspiration -> Power outages rarely happen without warning signs — but grid operators are often watching hundreds of nodes manually, and by the time a human notices a problem, it's already becoming an outage. We wanted to see if AI could catch instability early enough to act before failure, not just alert after it. GridMind started as a question: what would it look like if a grid operator had an AI co-pilot instead of just a dashboard full of numbers?
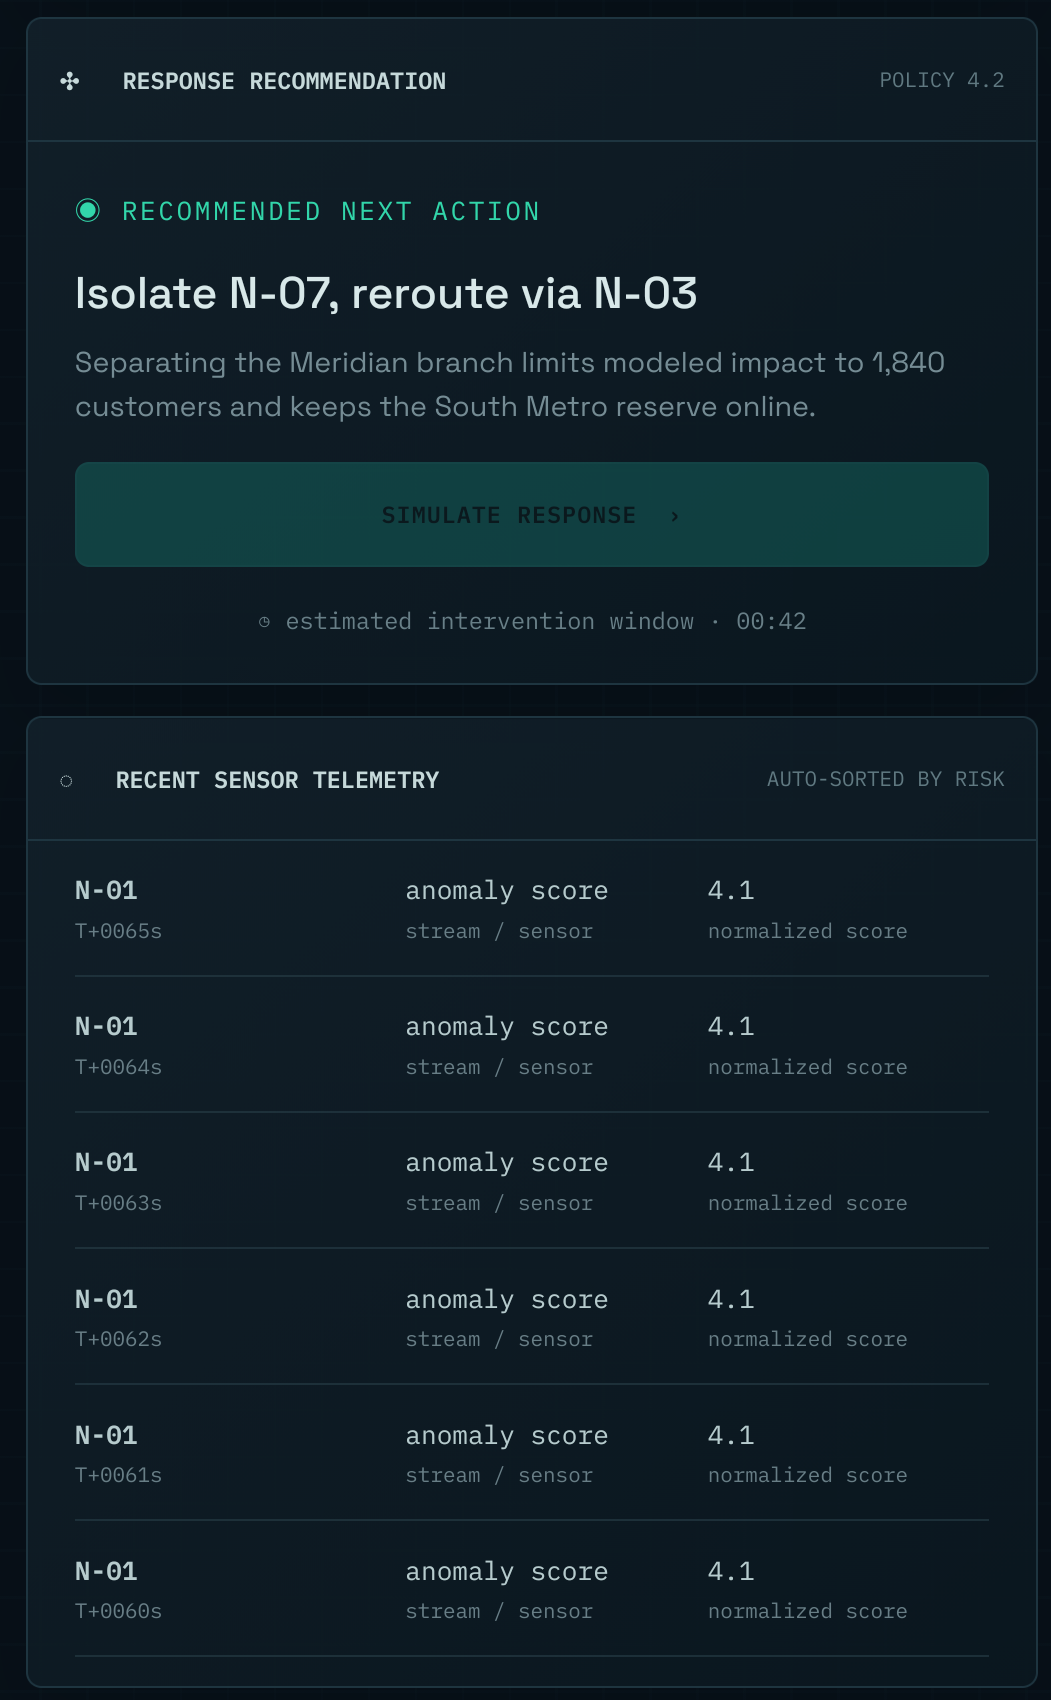
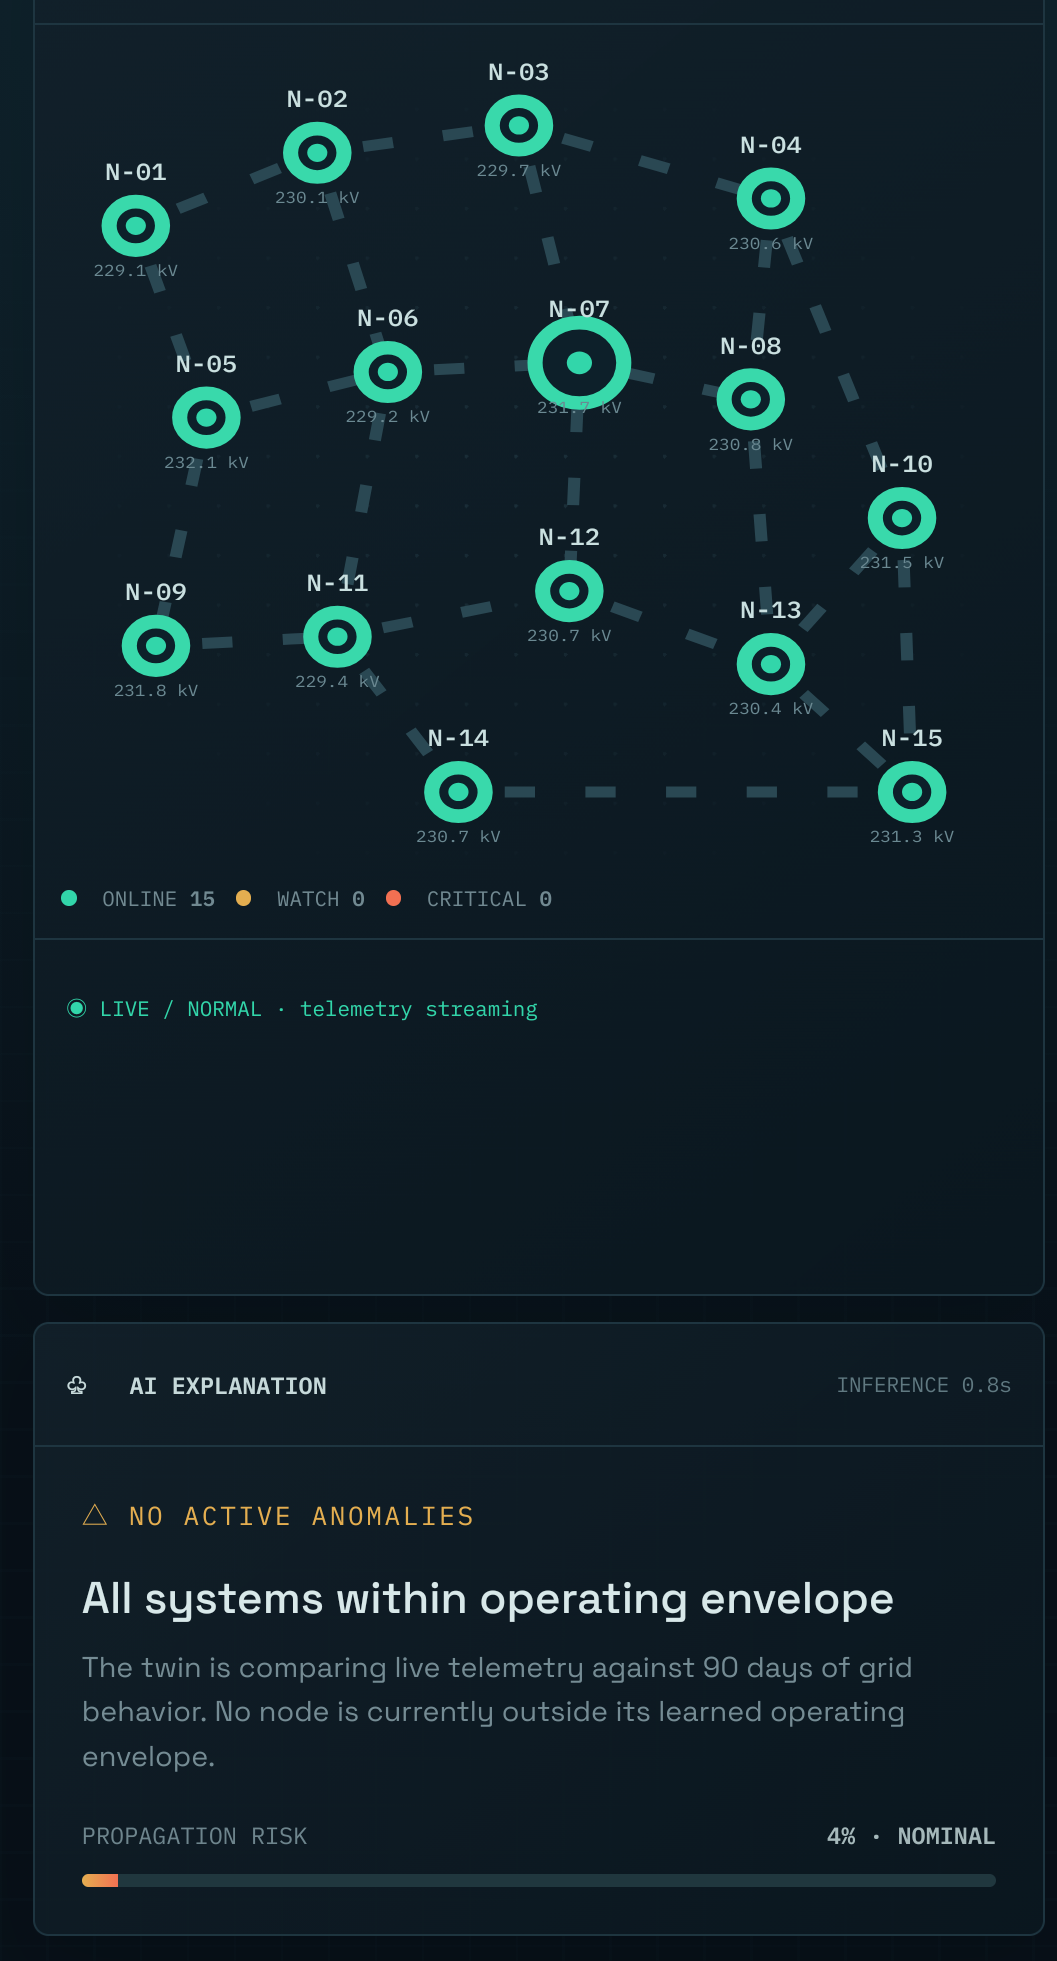
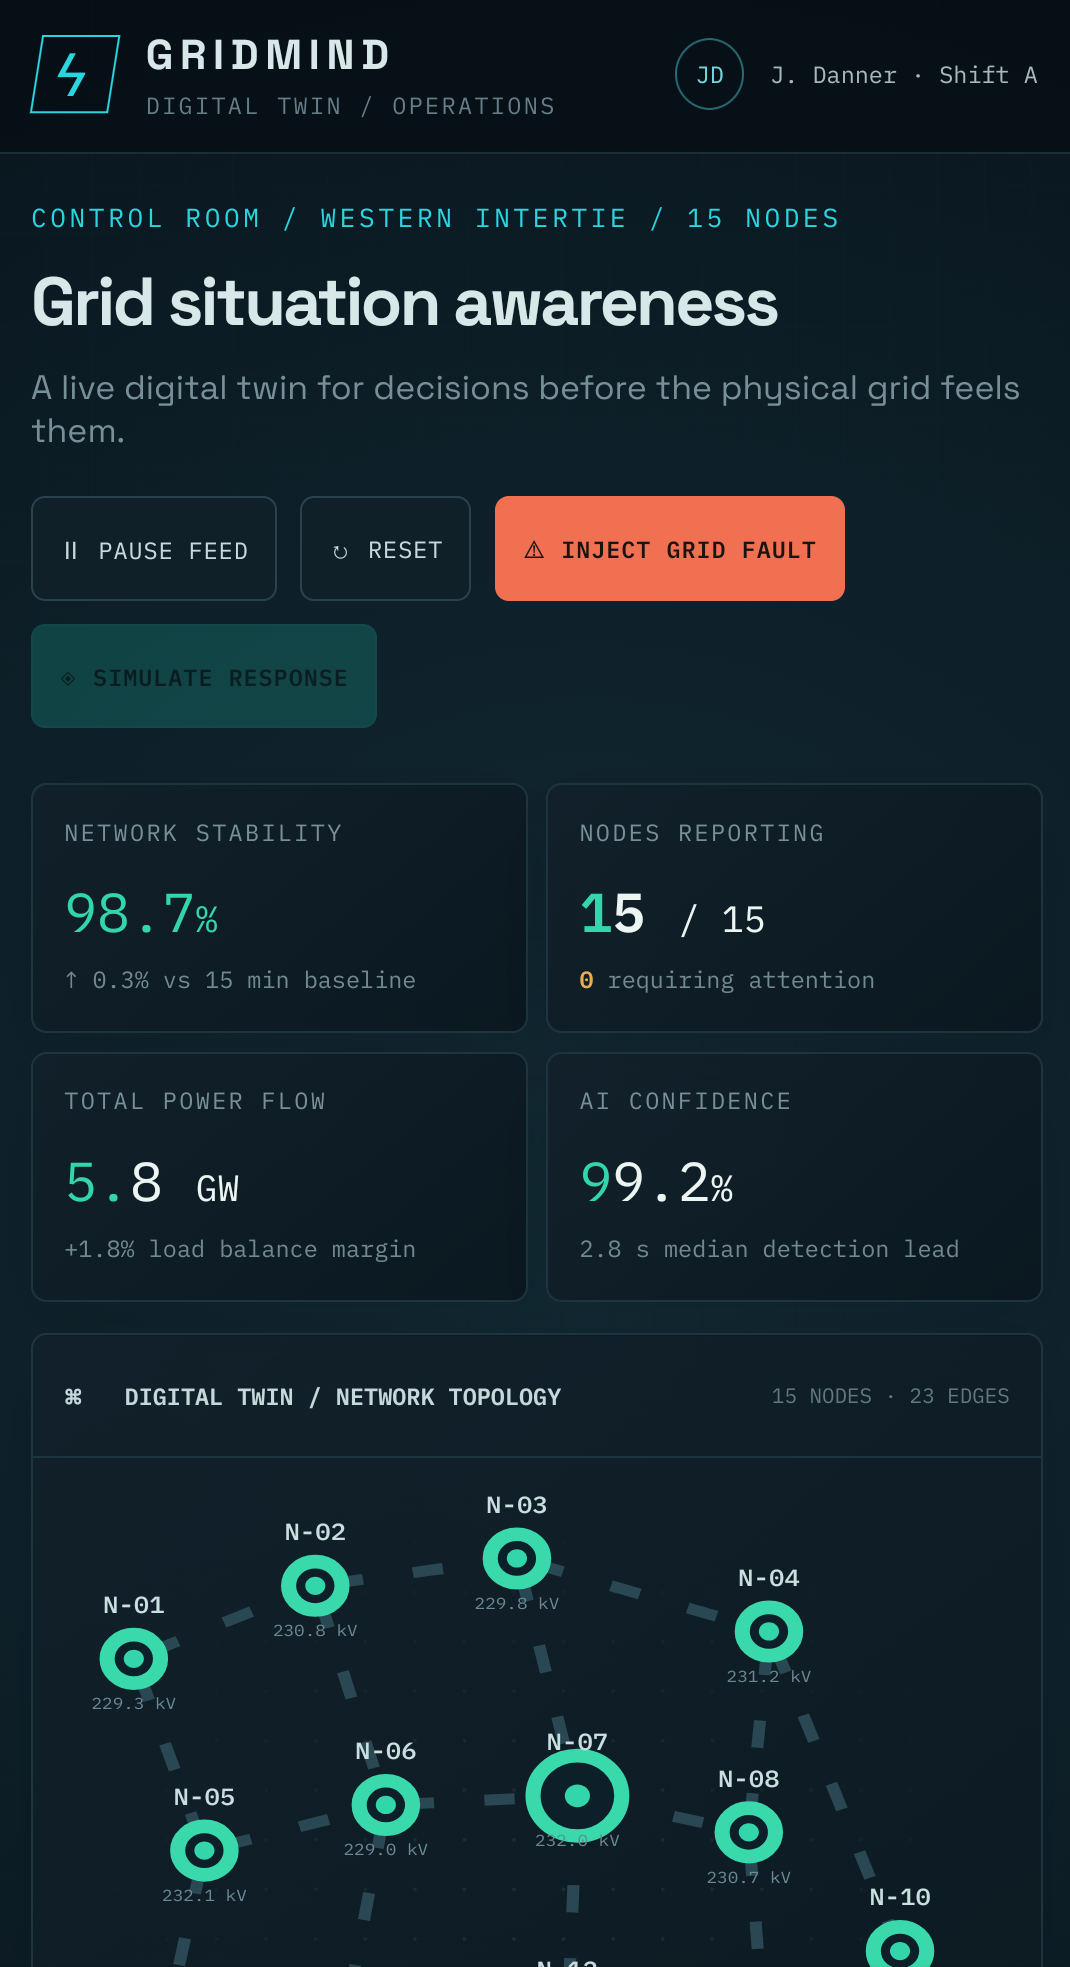
What it does -> GridMind is a live digital twin of an electrical grid. It simulates 15 interconnected nodes streaming real-time sensor telemetry (voltage, current, temperature, stability), analyzes that data for anomalies, and — when something goes wrong — explains why it's happening, estimates how far the problem could spread through the network, and recommends a specific operator response (like isolating a node and rerouting power). Operators can inject a live fault to watch detection happen in real time, then simulate the recommended response and watch the grid recover.
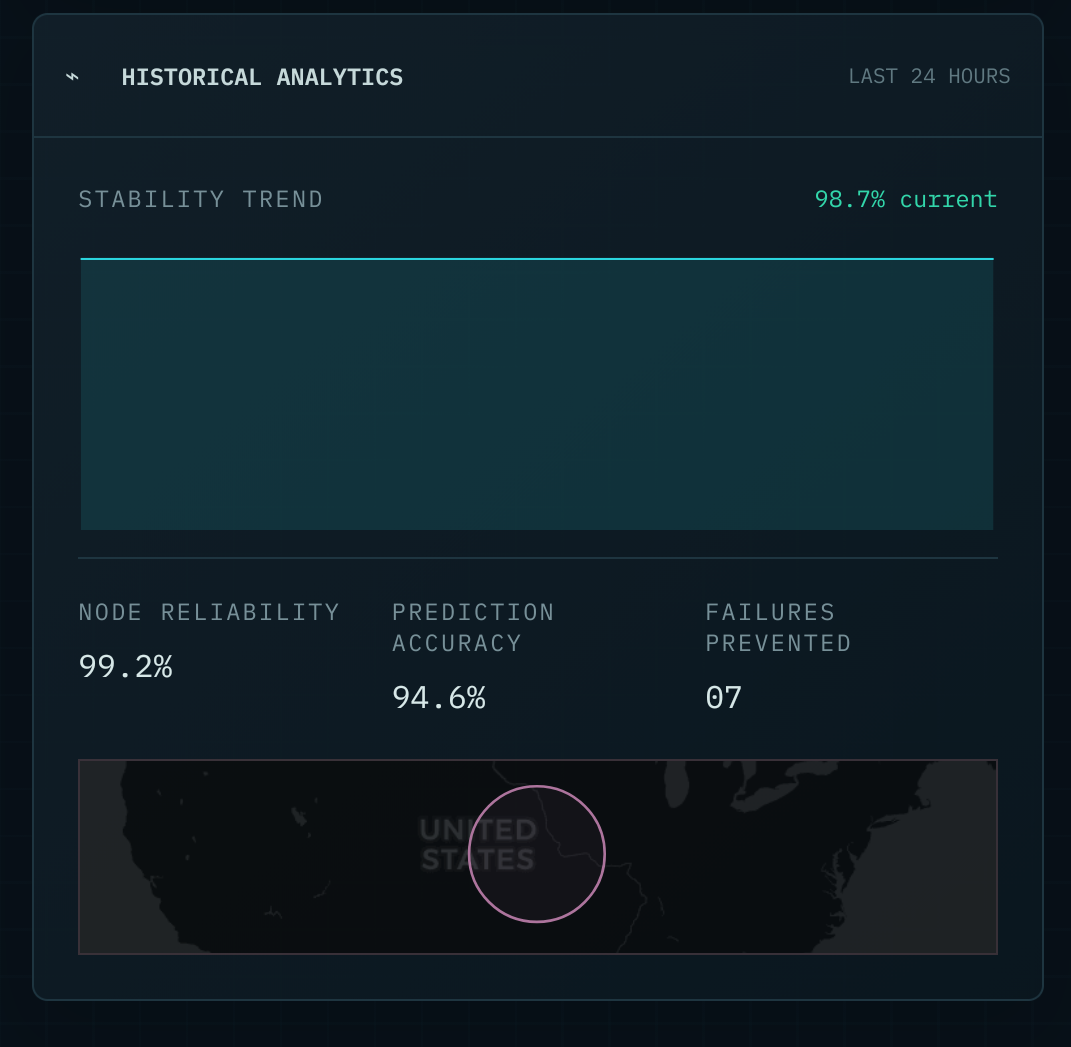
How i built it -> The backend runs on Flask with Flask-SocketIO, streaming simulated telemetry to the browser every two seconds so the interface updates live without polling or refreshing. NumPy generates realistic sensor noise so readings drift naturally instead of staying static. Pandas structures that data into features (voltage delta, current, temperature, stability), which feed a scikit-learn Isolation Forest model trained to flag readings that deviate from learned normal behavior. The frontend is vanilla JavaScript with an SVG-based network map, Chart.js for the stability trend, and Leaflet.js for the geographic reference view — all styled to feel like a real utility operations console.
Challenges i ran into -> Getting the fault-propagation logic to feel meaningful rather than just cosmetic was hard — i wanted neighboring nodes to be flagged based on actual graph relationships, not just a fixed list. We also had to make sure UI controls (like Pause) actually controlled the backend stream state rather than just changing a label, which took a pass of cleanup once we noticed the mismatch during testing.
Accomplishments that I'm proud of -> Building an interface that feels like a real operations tool rather than a typical hackathon dashboard, and getting the full detection → explanation → recommendation → recovery loop working end-to-end in a live demo.
What i learned -> hum first of all what I learned was how much of "AI trustworthiness" comes down to explainability, not just accuracy — an anomaly score alone means nothing to an operator without context on why it fired and what to do next.
What's next for GridMind -> Connecting the same architecture to real data sources — smart meter feeds, SCADA systems, or public utility datasets — and validating the anomaly model against real historical outage data instead of synthetic baselines.

Log in or sign up for Devpost to join the conversation.