Inspiration
Electricity demand changes throughout the day, and unusual consumption patterns can be difficult to identify by looking at raw readings alone. As an Electrical and Electronics Engineering student interested in smart grids and artificial intelligence, I wanted to build a simple tool that connects electrical engineering with data analytics.
What it does
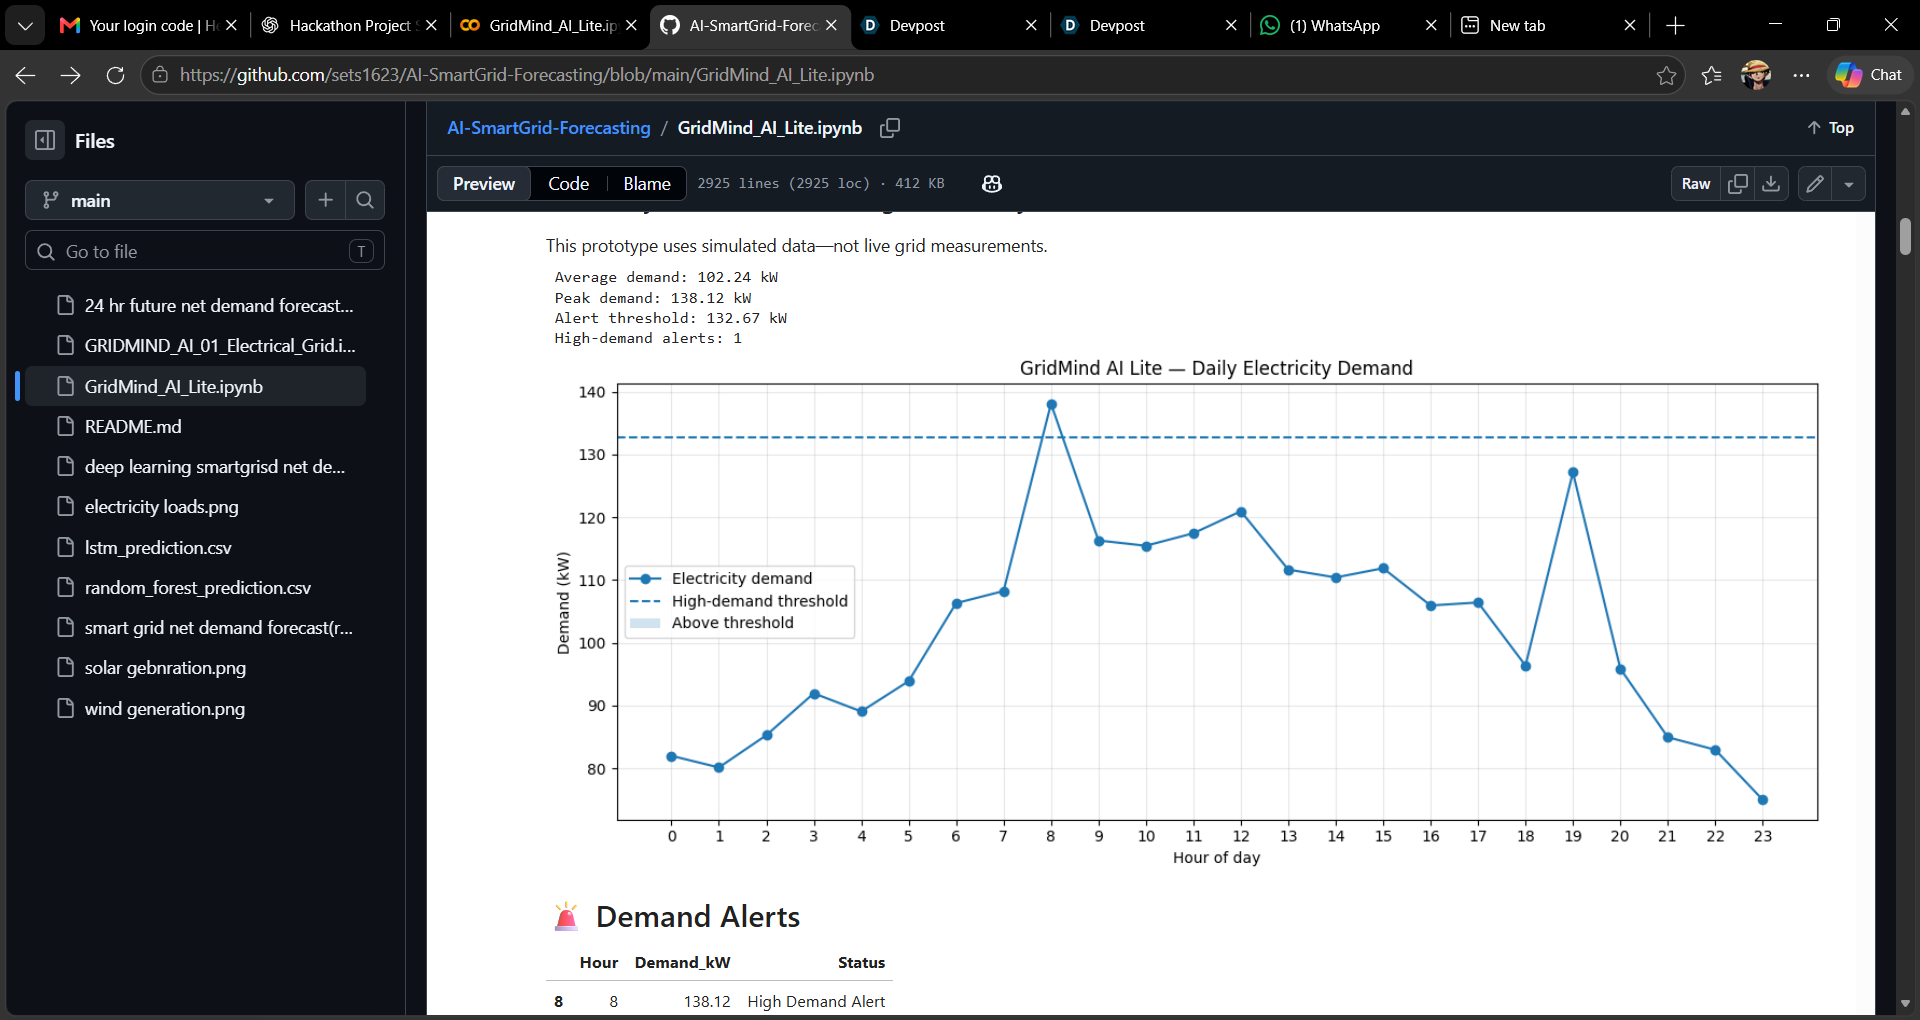
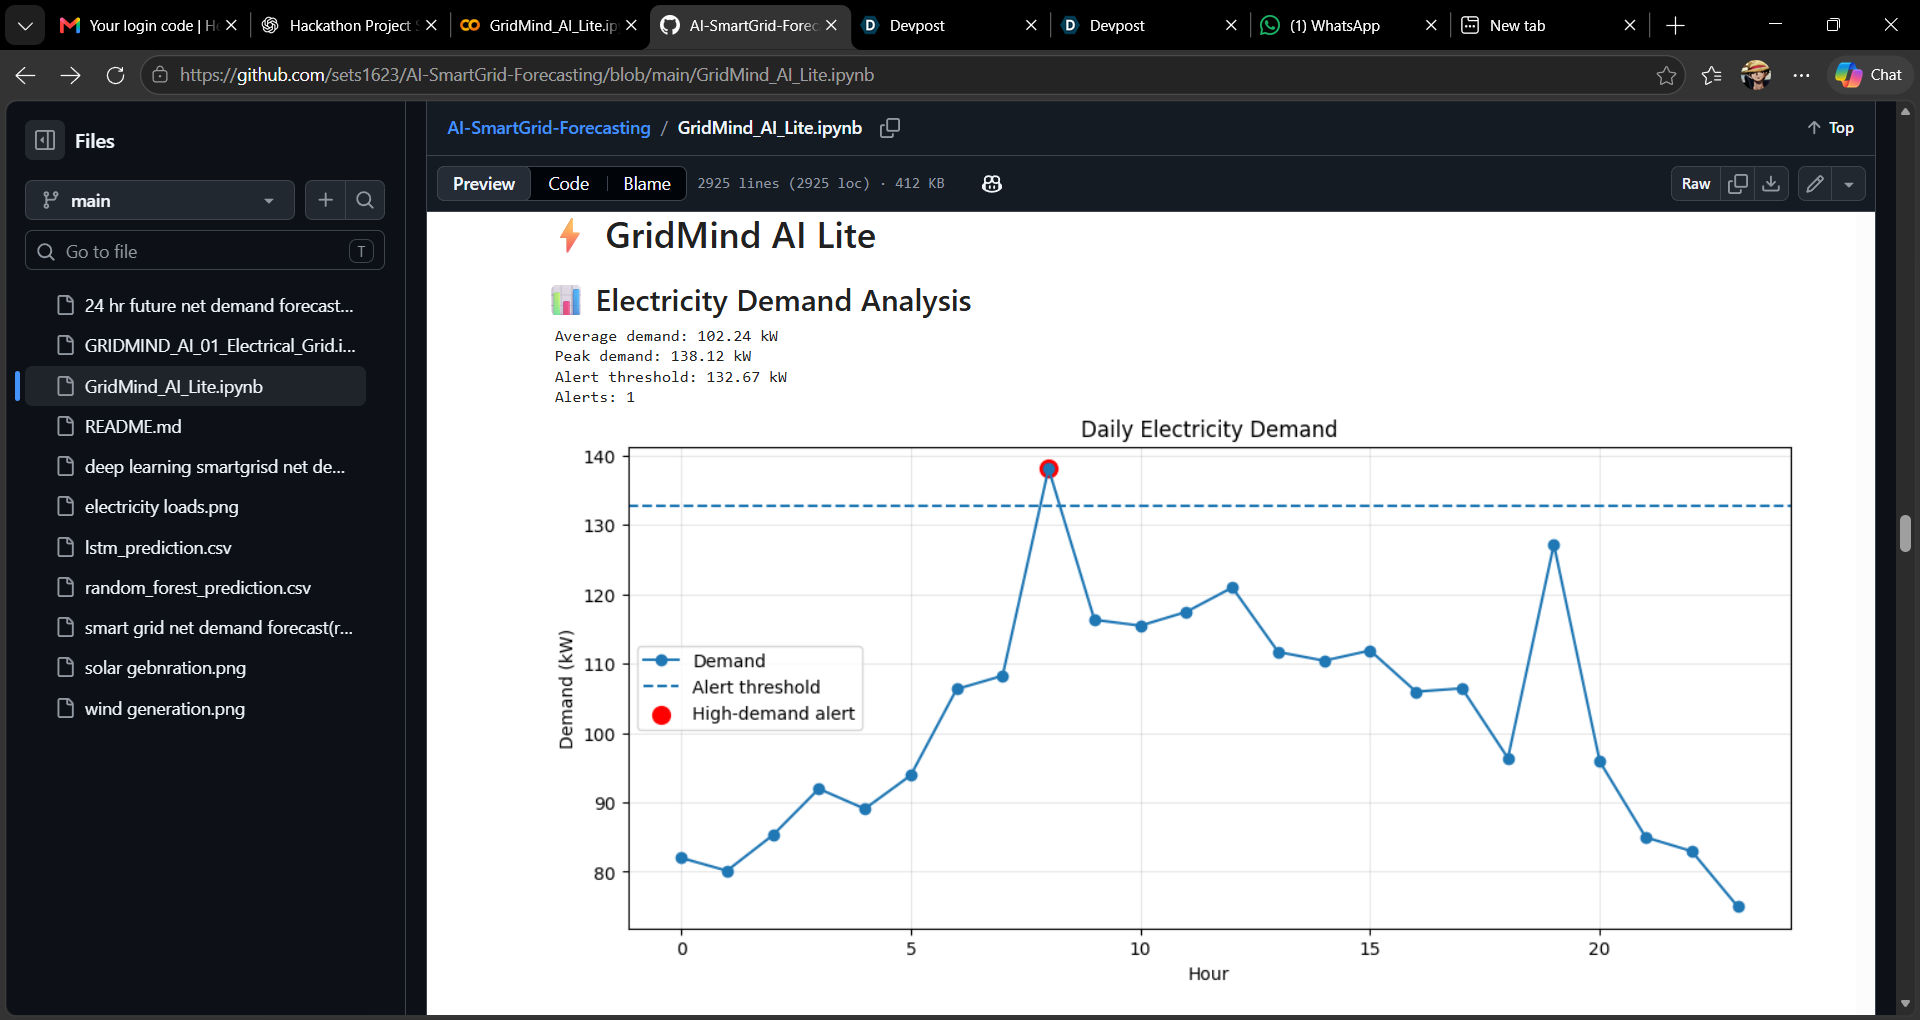
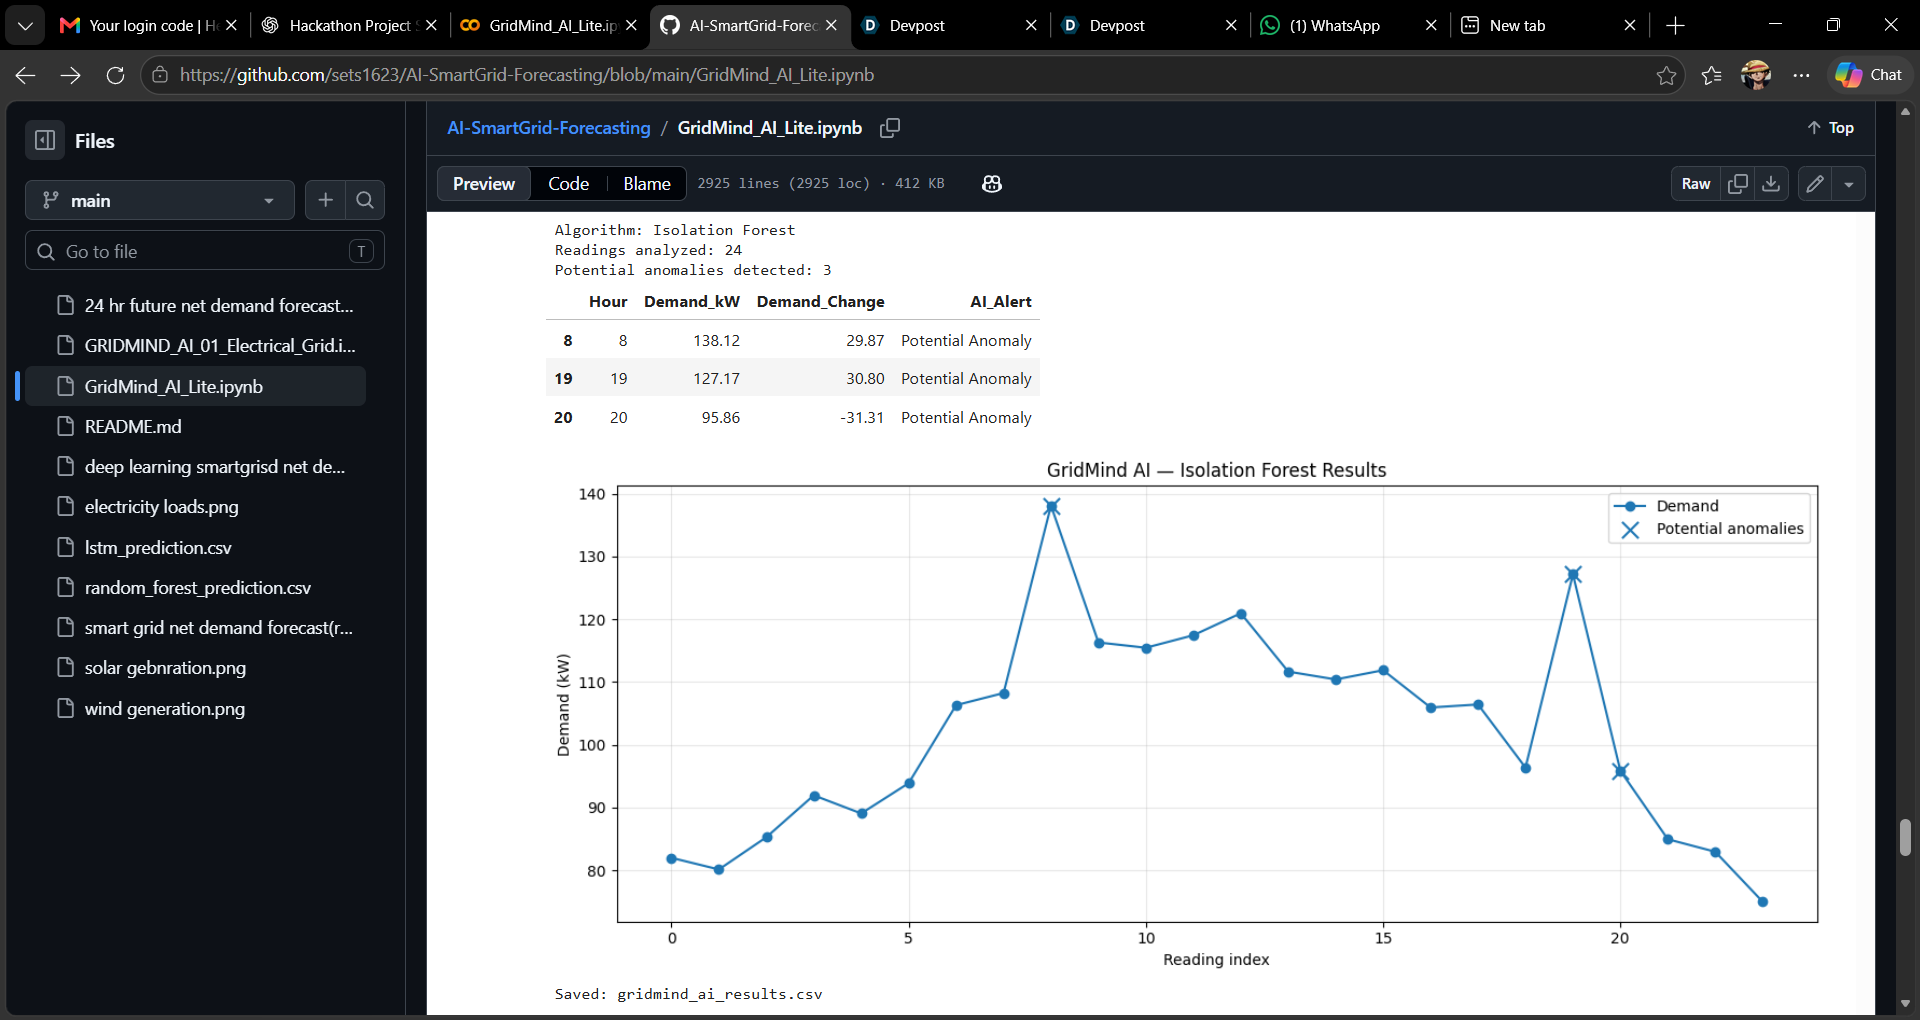
GridMind AI Lite is an educational electricity-demand monitoring prototype built in Python and Google Colab. It visualizes demand readings, calculates average and peak demand, flags readings above a configurable threshold, and experiments with machine-learning-based anomaly detection using Isolation Forest.
How we built it
The prototype uses Python, pandas, NumPy, Matplotlib, and scikit-learn. A sample dataset helps demonstrate the workflow, and users can analyze compatible CSV files containing electricity-demand readings. The project generates charts, highlights potential anomalies, and exports analysis results to CSV.
Challenges and learning
One challenge was combining data preparation, visualization, threshold-based alerts, and unsupervised machine learning into a single workflow. This project helped me understand how data quality, model configuration, and clear visualizations affect anomaly analysis.
What's next
Future improvements include testing with real electricity-demand datasets, validating anomaly detection against known events, developing a more polished web interface, and exploring forecasting methods.
Current limitations: The included sample data is simulated. The model's alerts indicate potentially unusual readings, not confirmed electrical faults. This prototype is not connected to a live grid and is not intended for operational protection or control.
Built With
- analysis
- anomaly
- colab
- demand
- detection
- electricity
- learning
- machine
- matplotlib
- numpy
- pandas
- python
- scikit-learn

Log in or sign up for Devpost to join the conversation.