-
-

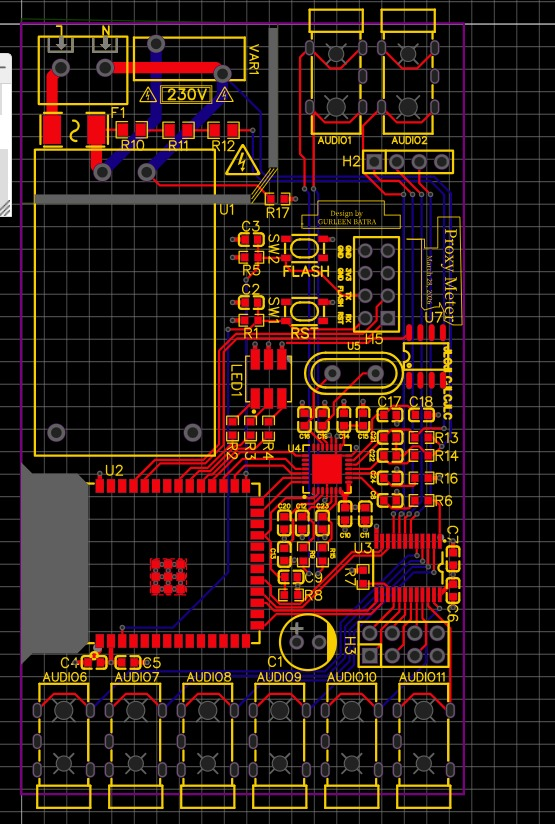
PCB design for our Unique Sensor Integration.
GridMind — Intelligent Campus Energy Orchestration
The Problem We Found
MSU spends $33.6 million a year on energy across 120 buildings — and most of that spending is invisible. 75% of buildings have no smart meters. The university gets monthly bills and nothing else. Meanwhile, 20 research labs consume 39% of all campus energy running full ventilation 24/7, even when nobody is in the building. And peak electricity costs 60% more than off-peak, but nothing shifts consumption to cheaper hours.
We noticed a data inconsistency in the case study: the stated 210M kWh doesn't match the building table, which totals 252.5M kWh. This aligns with the stated 18% growth over five years (210M × 1.18 ≈ 248M). We used 252.5M kWh as our baseline because the building-level data is the more granular and reliable source.
What GridMind Does
GridMind is an energy intelligence platform built on three ideas we believe differentiate us from conventional approaches:
1. Proxy Metering — ML instead of $1.35M in sensors. We trained a gradient boosting model on the 30 buildings that already have smart meters. Using building characteristics (square footage, type, age), weather data, and time features, the model predicts hourly energy consumption for the 90 unmetered buildings with an R² of 0.91 and mean error of ±12%. We then strategically install just 20 new meters in the highest-consuming unmetered buildings for $200K — giving us real-time data on 72% of campus energy. The remaining 70 buildings are monitored via the ML model. Total monitoring cost: $200K vs $1.35M for full metering.
2. Thermal Ice Storage — exploiting the 60% peak premium. We make ice at night using off-peak electricity ($0.106/kWh) and melt it during the day for cooling instead of running chillers at peak rates ($0.17/kWh). Same total energy, same comfort, but 37% less cost per kWh shifted. Annual savings: $840K. This is proven technology — the University of Arizona saves $38,000/month with an identical system.
3. Self-Funding Cascade — Phase 1 pays for Phase 2. We front-load the cheapest, highest-ROI interventions. Year 1: $2.8M on steam trap monitoring, 5 lab ventilation retrofits, the software platform, and LED upgrades. These generate $2.2M/year in savings almost immediately. Those savings partially fund the $5.2M Phase 2 (remaining lab retrofits + ice storage). By Year 4, steady-state savings reach $8.9M/year.
How We Built It
Engineering pillar: Designed an IoT sensor architecture using LoRaWAN connectivity. Three sensor packages by building type — VOC and CO2 sensors for labs, occupancy sensors for academic buildings, acoustic monitors for steam traps. Total hardware budget: ~$500K (under 4% of the $12M budget). Specified VAV/DCV retrofit approach for lab ventilation that reduces air changes from 10 ACH to 2 ACH when labs are unoccupied and no chemicals are detected.
Software pillar: Built a real-time campus dashboard in React showing sensor readings (power kW, temperature, CO2, VOC, ventilation rates) for every building. Metered buildings show exact readings; proxy-metered buildings show ML predictions with confidence intervals. The dashboard includes a before/after optimization toggle. We also built an AI decision engine simulation showing automated HVAC optimization across 5 building types, and a peak shaving visualization demonstrating ice storage economics.
Finance pillar: Developed a complete capital allocation model with phased deployment, 5-year cash flow projections, and a marginal abatement cost curve ranking every intervention by $/ton CO2 avoided. Built an interactive energy simulation with adjustable parameters that lets you see how each optimization lever affects annual savings.
The Financial Case
| Phase | Timeline | Investment | Annual Savings | Payback |
|---|---|---|---|---|
| Phase 1: Quick wins + data | Year 1 | $2.8M | $2.2M/yr | 15 months |
| Phase 2: Scale labs + ice storage | Year 2-3 | $5.2M | +$3.9M/yr | 16 months |
| Phase 3: Envelope + solar + digital twin | Year 4-5 | $4.0M | +$1.1M/yr | 3.1 years |
| Total | 5 years | $12.0M | $8.9M/yr steady | 16 months |
5-year cash flow:
- Year 1: Spend $2.8M, save $2.2M → net -$0.6M
- Year 2: Spend $2.6M, save $5.5M → cumulative +$5.1M
- Year 3: Spend $2.6M, save $7.9M → cumulative +$8.0M
- Year 4: Spend $2.0M, save $8.9M → cumulative +$12.5M
- Year 5: Spend $2.0M, save $8.9M → cumulative +$21.4M
Key financial metrics:
- Internal Rate of Return: 55–65% (universities typically target 8–12%)
- Net Present Value (5% discount): ~$38M over 10 years
- Simple payback: 16 months
- Phase 1 is independently viable — if the entire remaining budget disappeared, Phase 1 alone returns $2.2M/year on a $2.8M investment
Marginal abatement cost ranking ($/ton CO2 avoided): Steam traps ($8) → Lab ventilation ($12) → LED retrofits ($18) → Scheduling ($22) → VFDs ($25) → Ice storage ($35) → Envelope ($65) → Solar ($180). We invest in this order — cheapest carbon reduction first.
Carbon impact: 35% energy reduction from the 252.5M kWh baseline. Off-peak electricity is 20-40% cleaner than peak (less gas peaker plant usage), so actual emissions reduction reaches approximately 40% — hitting MSU's 2035 target by 2030, five years early.
Challenges We Ran Into
The core tension is lab safety vs energy savings. Research labs need ventilation for chemical safety, but most of that ventilation is wasted on empty rooms. Our solution: VOC sensors at exhaust inlets act as a hard safety backstop. The AI only reduces ventilation when a lab is simultaneously unoccupied AND has no detected chemical activity. If any compound exceeds threshold, ventilation goes to maximum immediately with no AI override possible.
The data gap was the other major challenge — you can't optimize 90 buildings you can't see. Rather than spending $1.35M on meters, we developed the proxy metering approach. The ±12% accuracy isn't perfect, but it's enough to identify which buildings are wasting energy and should get real meters next.
What We Learned
The single most important insight: 20 labs = 17% of buildings but 39% of all campus energy. Every optimization dollar spent on a lab returns 3-5× more than the same dollar spent on an academic building. Targeting matters more than total spending.
Software-driven optimization delivers dramatically better ROI than hardware replacement. Our entire IoT sensor layer costs under $500K. The software that makes it intelligent costs $1.5M. Together they unlock $6M+/year in savings. Buying new equipment alone would cost 10× more for the same impact.
What's Next for GridMind
- Pilot deployment in 3-5 buildings to validate proxy metering accuracy against real meter installations
- Integration with campus class scheduling systems for 72-hour occupancy prediction
- Carbon credit monetization pathway: ~32,000 tons CO2/year reduced at $30-50/ton = $960K-1.6M in additional value over 10 years
- Virtual power purchase agreement (VPPA) exploration with the local utility for renewable energy credits
- Expansion of predictive maintenance to cover all 120 buildings continuously, catching equipment degradation before it wastes energy
Built With
- kicad
- love
- python
- react
- scikit-learn
- voltran


Log in or sign up for Devpost to join the conversation.