Inspiration
Neighboring utilities help power the same region, but they often plan construction independently. Projects just miles apart can miss opportunities to share crews, equipment, and resources.
We built GridLock around a simple question: what if utilities could see those connections before construction begins?
What it does
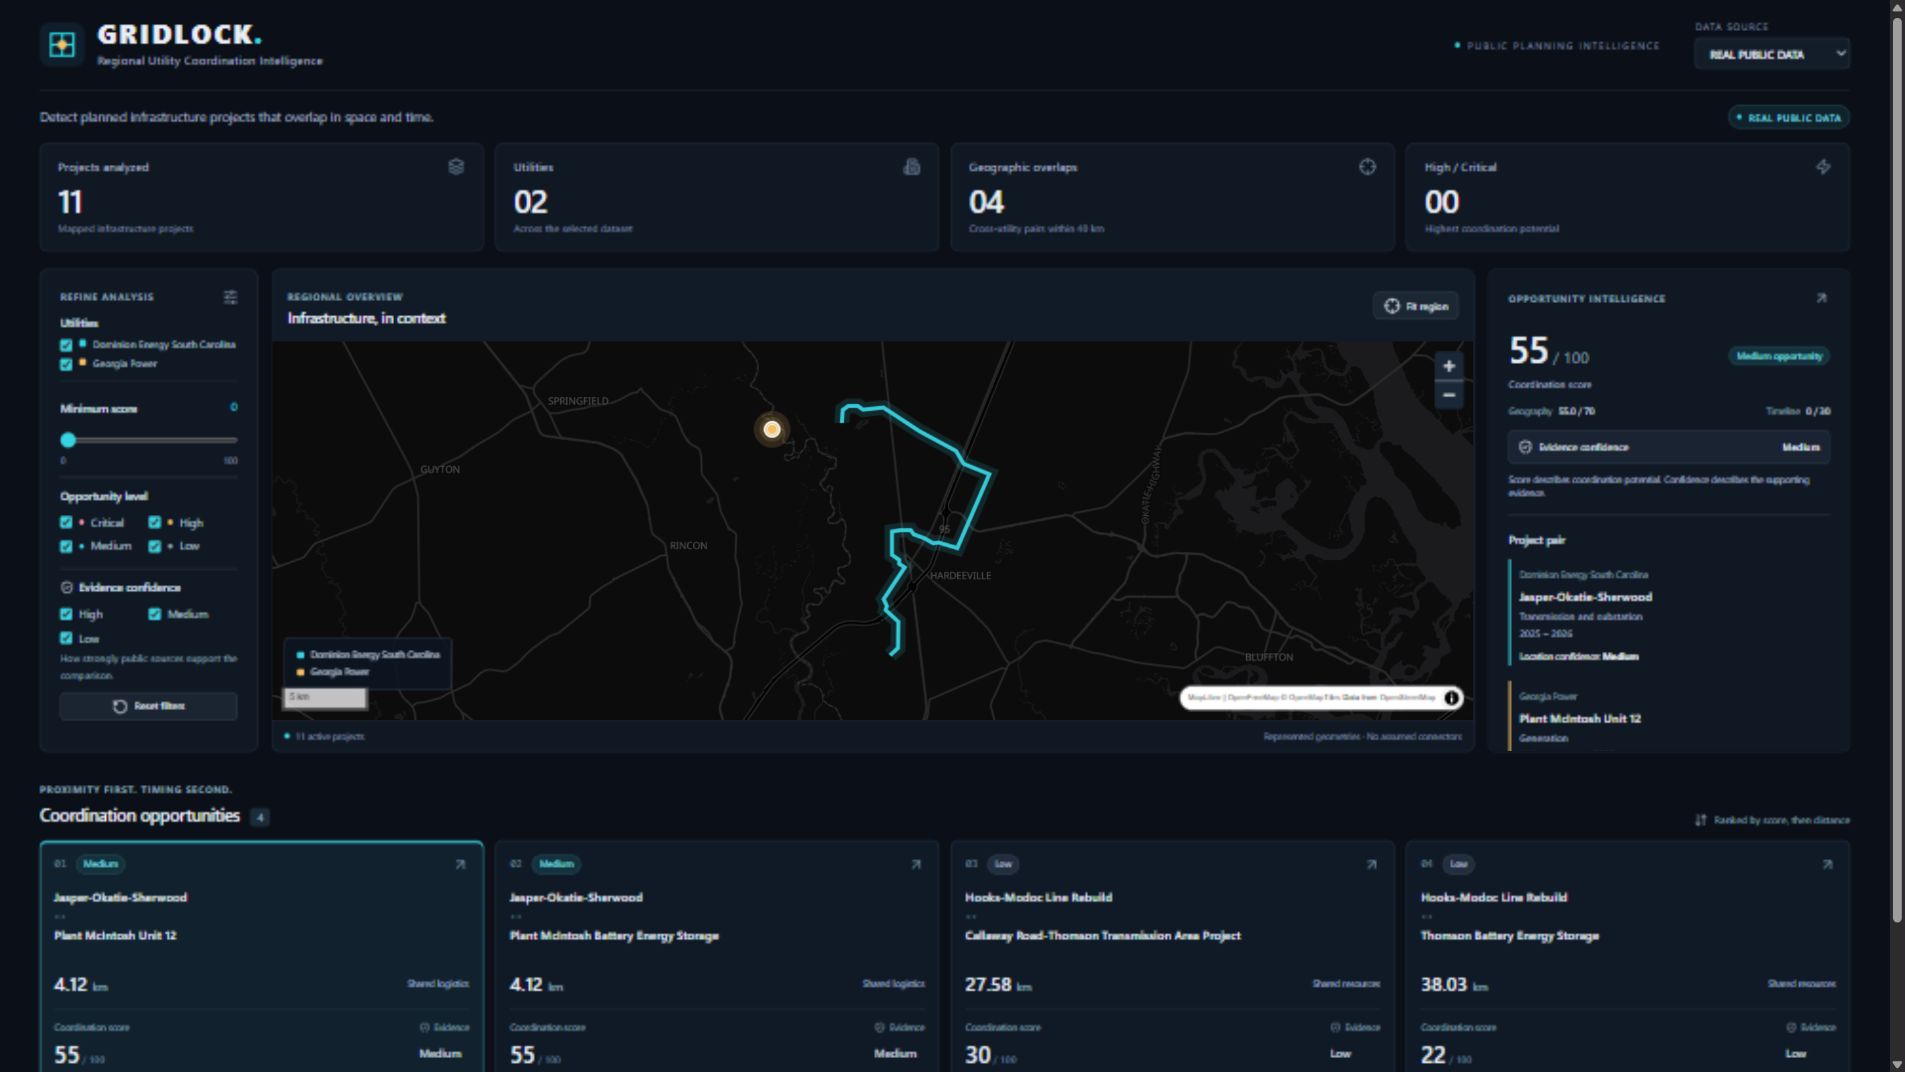
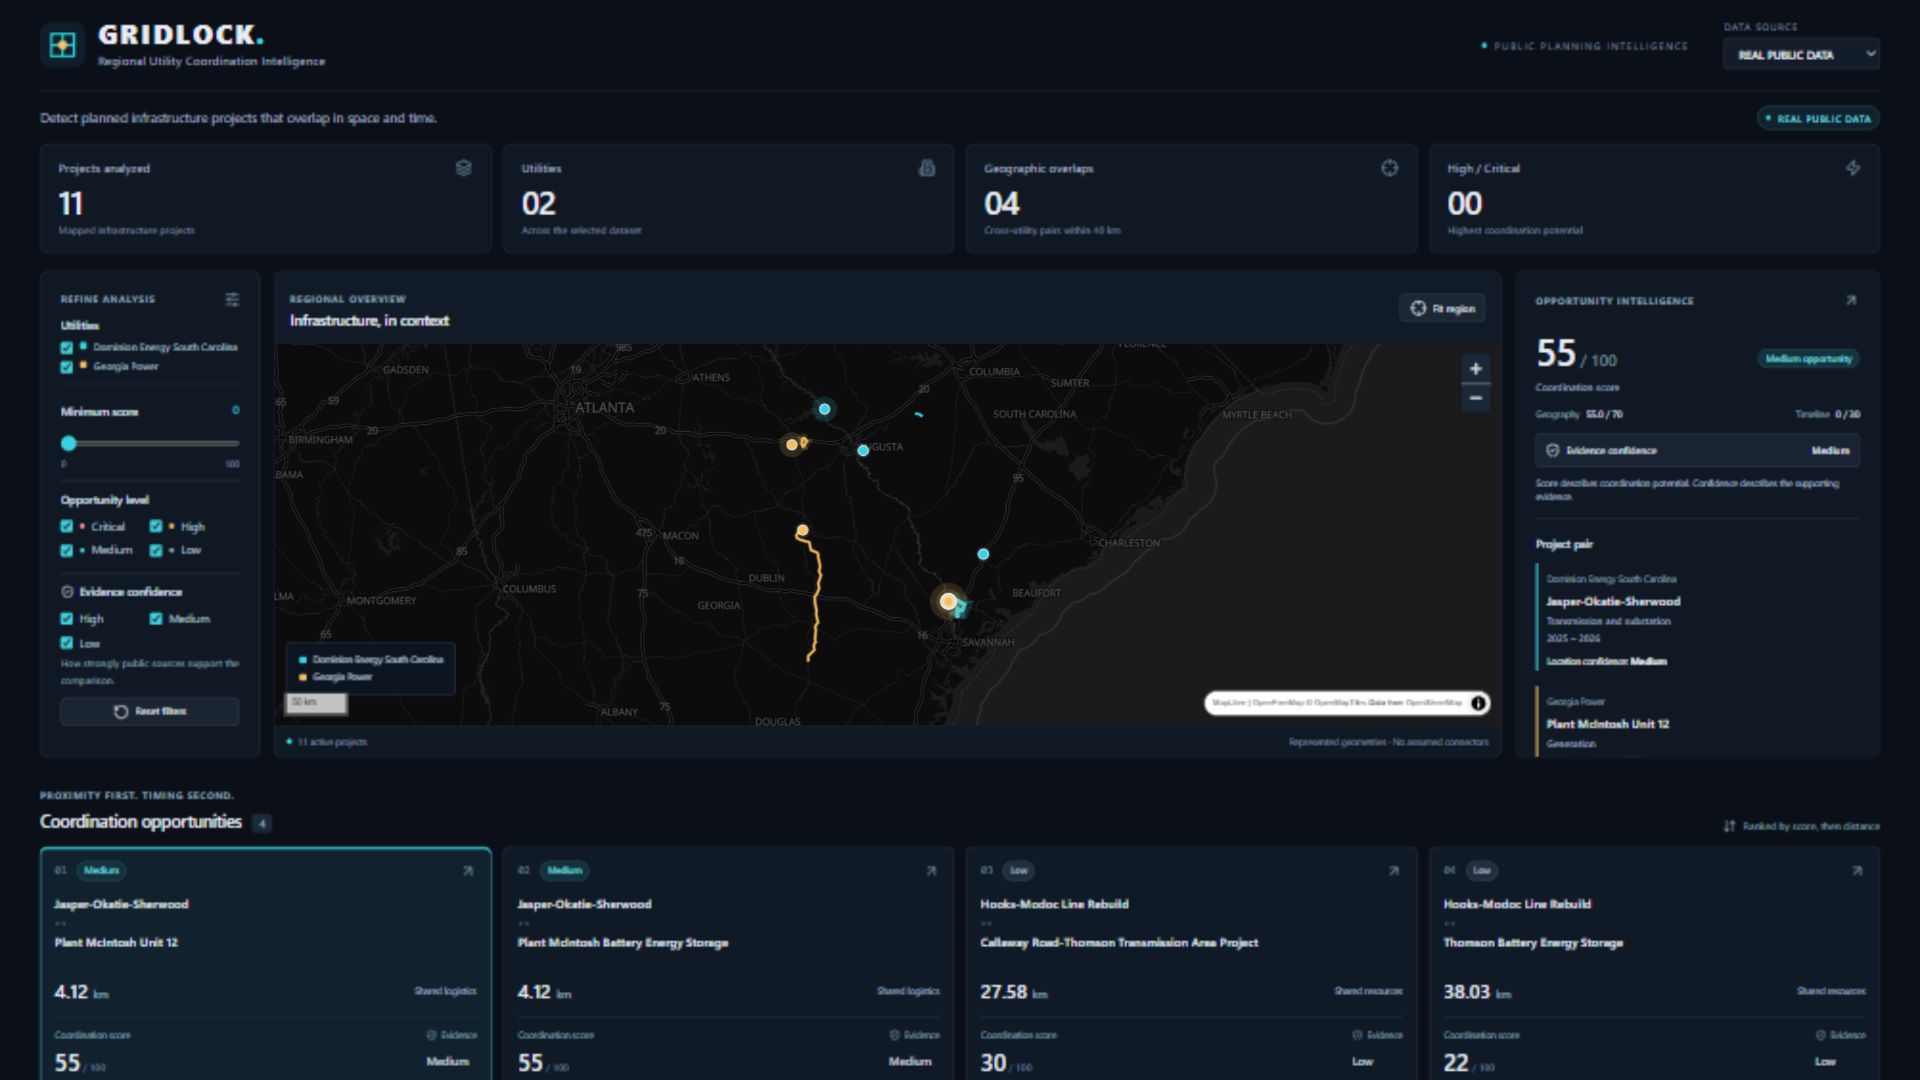
GridLock compares utilities’ public construction plans and highlights potential coordination opportunities on an interactive map.
Users can:
- Explore projects from neighboring utilities.
- Find projects that intersect or are geographically close.
- Compare construction timelines when dates are available.
- Review match scores, supporting evidence, and potential shared resources.
- Filter results by utility and opportunity type.
Our current real-data demonstration includes 11 projects from Dominion Energy South Carolina and Georgia Power, producing four geographic matches. A separate synthetic dataset helps demonstrate additional scenarios.
How we built it
We built the analysis engine with Python, GeoPandas, Shapely, and PyProj. It compares project geometries using projected coordinates so distances are measured in meters instead of latitude and longitude degrees.
Eligible projects must belong to different utilities and be within 40 kilometers of each other. We then rank matches using geography and available timeline information:
$$ S = G + T $$
Here, geography contributes up to 70 points, and timing contributes up to 30 points. Missing dates remain unknown and receive no timing points.
A FastAPI backend serves the results to a React and TypeScript dashboard built with Vite and MapLibre.
For mobile access, we created a React Native and Expo app that displays the dashboard through a WebView. Its bottom navigation provides Map, Matches, Details, and Filters.
Challenges we faced
The biggest challenge was working with incomplete public information. Utilities do not always publish comparable schedules or precise project boundaries. We needed to preserve those uncertainties instead of presenting assumptions as verified facts.
Geographic comparisons also required care. Measuring between project centers can miss nearby sections of long transmission corridors, so we compare the represented geometries themselves.
Another challenge was adapting a detailed desktop dashboard to a phone. We separated the interface into focused tabs while keeping project details and map navigation connected.
What we learned
We learned that useful coordination tools need both clear results and transparent evidence. A strong match score does not automatically mean the underlying data is complete.
We also learned how geospatial analysis, public infrastructure data, and mobile interfaces can work together to make complex planning information easier to understand.
What’s next for GridLock
We want to expand coverage to more utilities, improve geometry and schedule verification, and host the dashboard and API so the mobile app can work without a local development computer.
Our next validation step is hands-on iPhone testing through Expo Go.
GridLock helps neighboring utilities find overlapping projects and coordinate crews, equipment, and construction.
Built With
- expo.io
- fastapi
- geopandas
- maplibre-gl-js
- native
- pyproj
- python
- react
- react-native
- shapely
- typescript
- vite

Log in or sign up for Devpost to join the conversation.