-
-
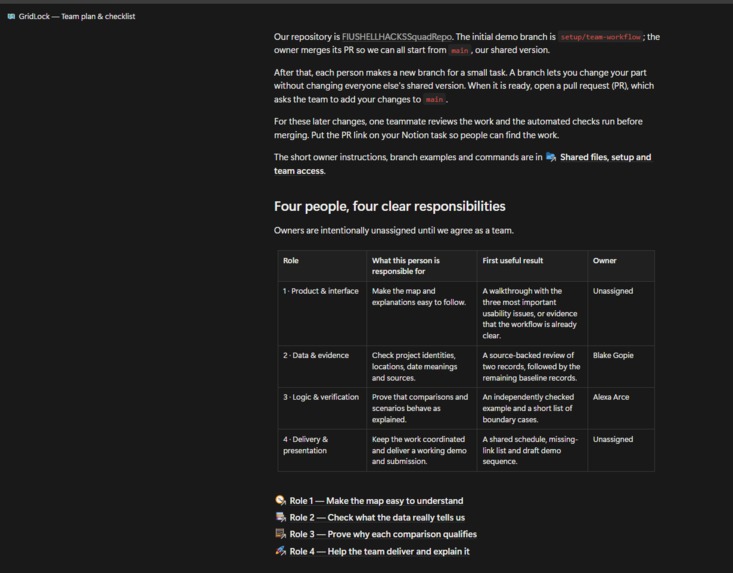
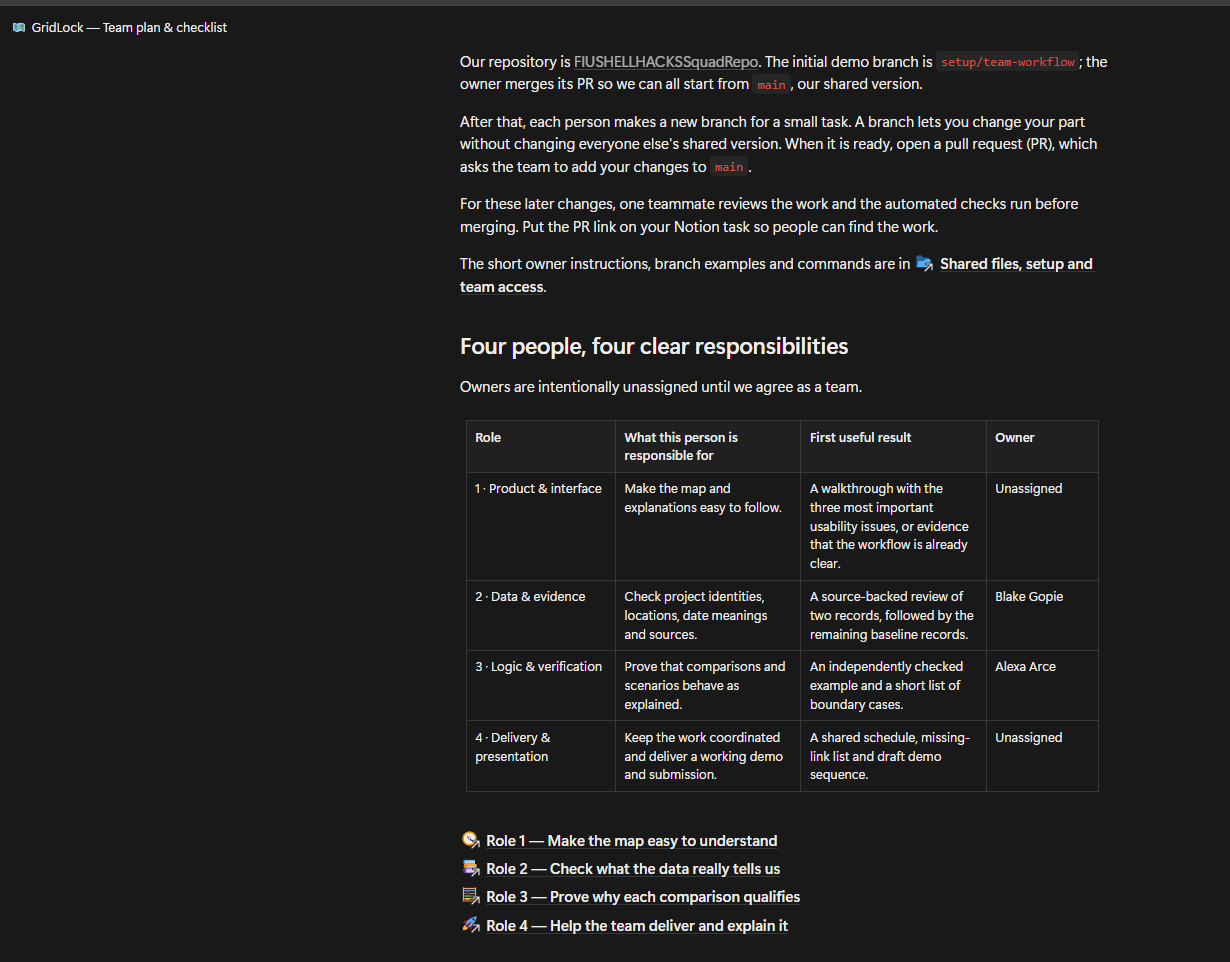
We used Notion to help break down the project, analyze our objectives, delegate tasks, and write down changes.
-
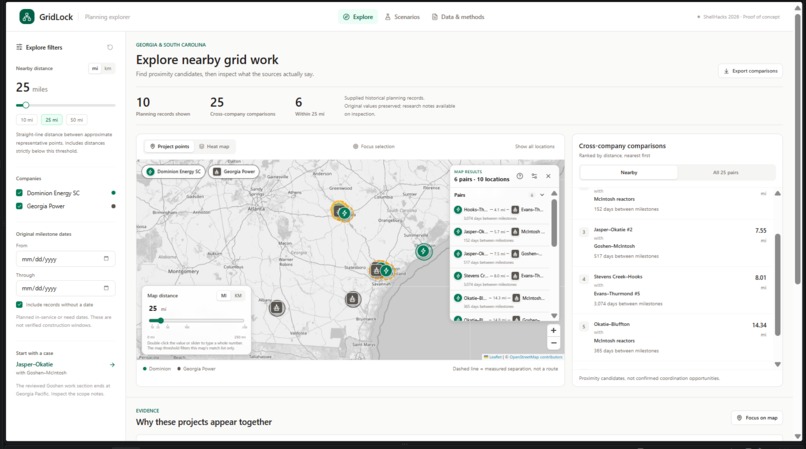
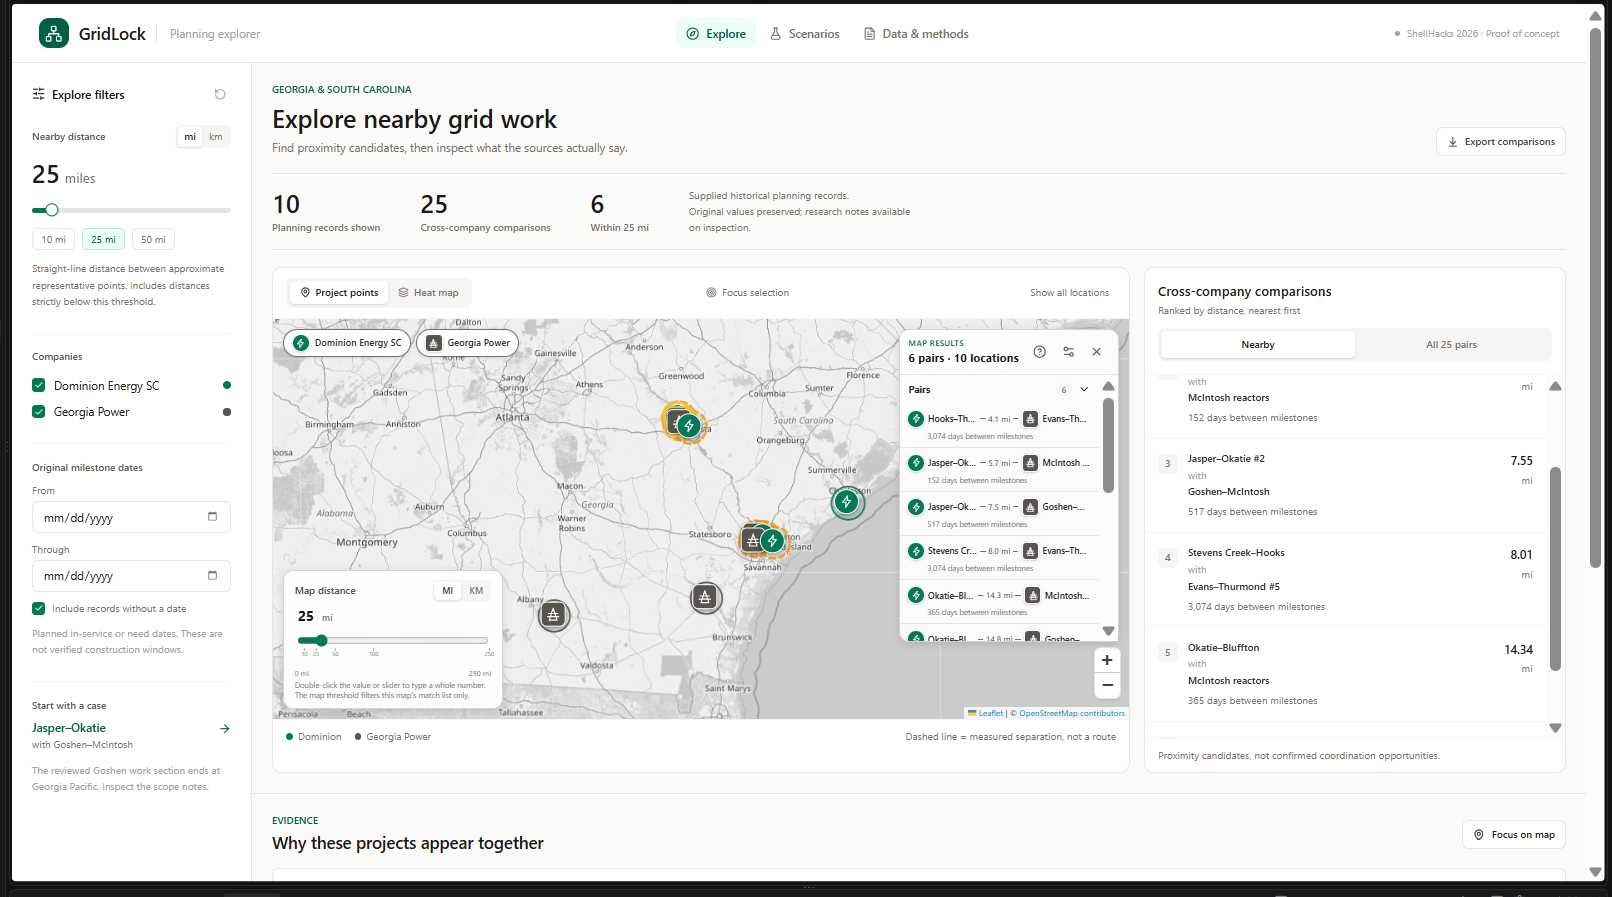
We're testing how clearly users can explore the map while displaying information about project locations and cross-company candidates.
-
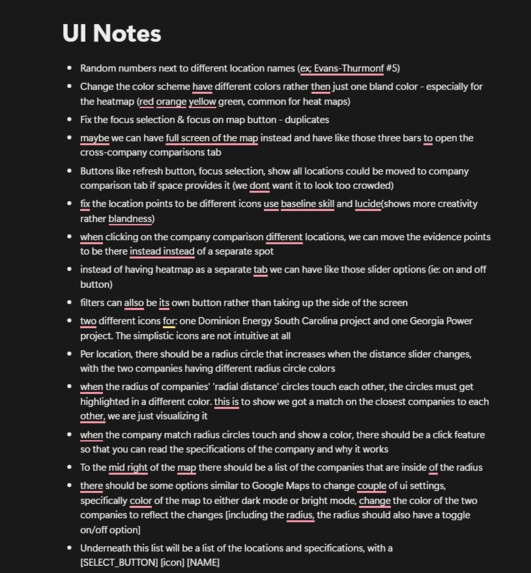
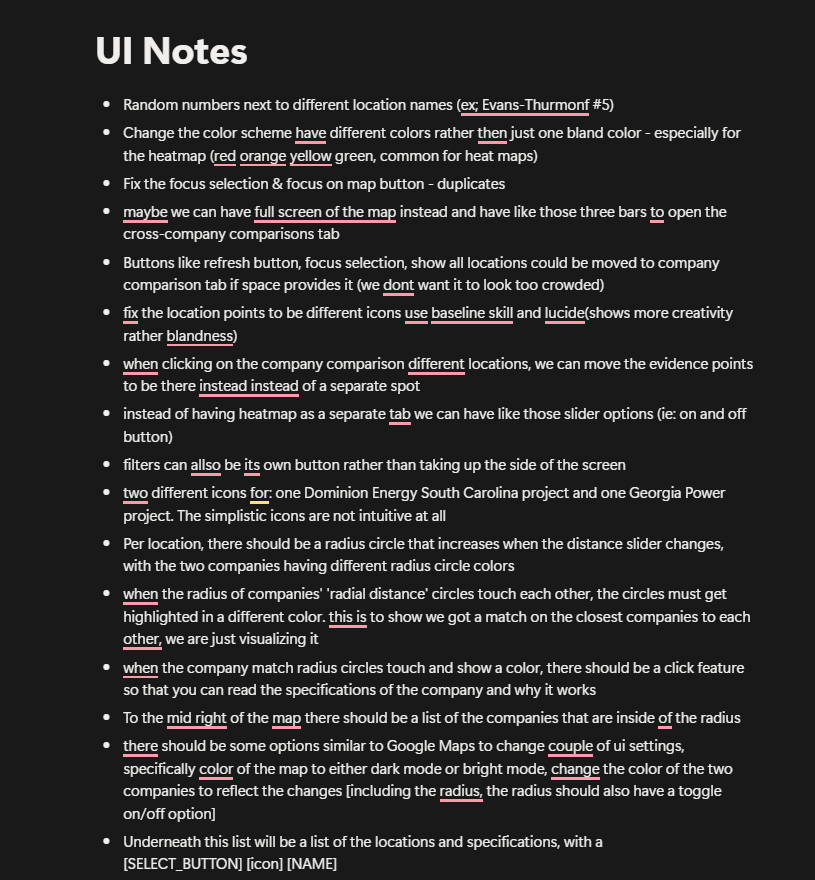
During project debugging and planning we wrote down changes and thoughts. We used this as a reference throughout our project making phase.
-
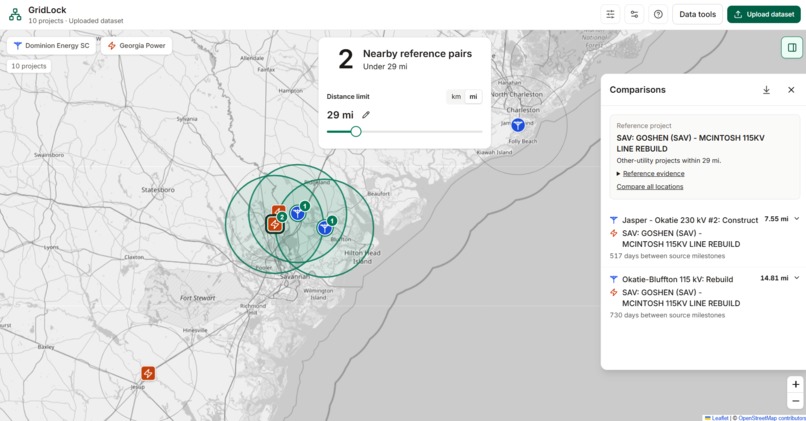
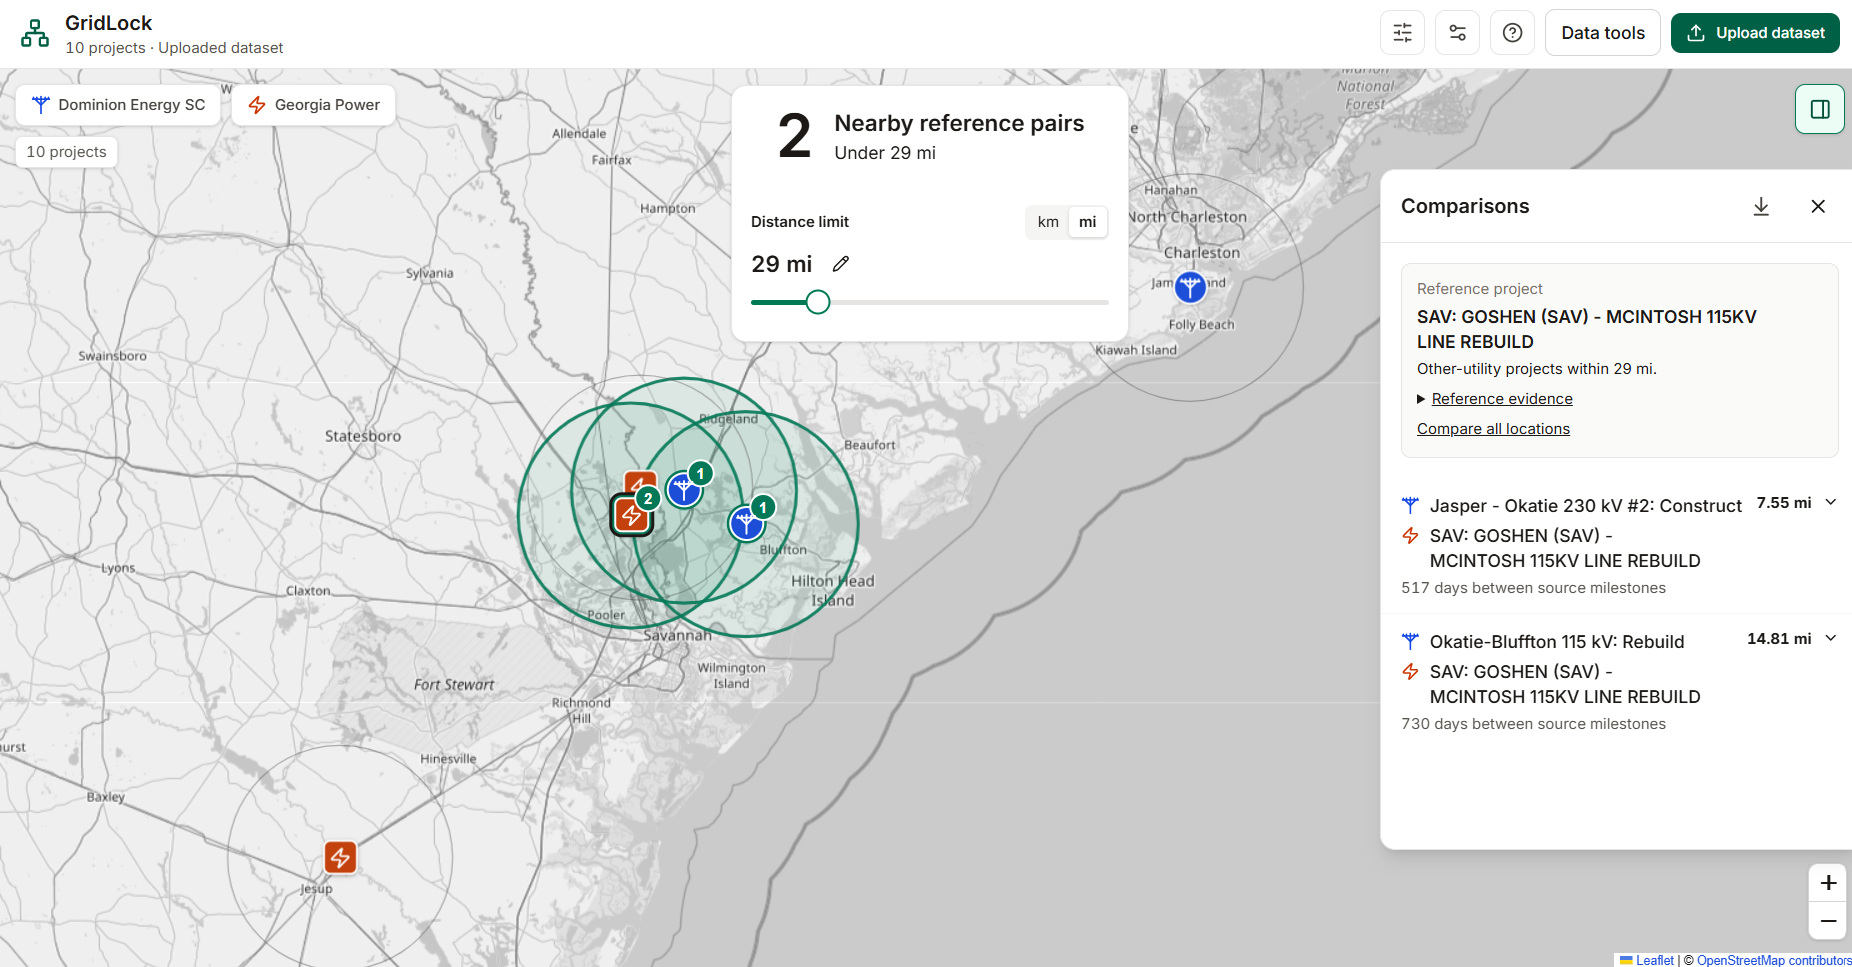
Finalized version of Gridlock.
Inspiration
GridLock was inspired by coordination opportunities that can be hidden across separate utility spreadsheets and planning reports. We wanted to connect project locations, schedules and supporting evidence so planners could identify nearby projects worth investigating together.
Our practical motivation was construction access, particularly for remote work areas. Could projects share staging space? Could suitable temporary access mats be released from one project and reused at another? These questions depend on more than proximity. They require understanding actual access routes, site requirements, permissions and construction timing.
GridLock provides a starting point for those conversations by making the relevant project records easier to compare.
What it does
GridLock helps utility planners find nearby projects from different companies, compare their planning dates and inspect supporting information in one workspace.
Users can download a historical ten-project sample or upload their own CSV or Excel dataset. After validation, records with usable coordinates appear on the map. Users can adjust the distance in miles or kilometers, filter utilities, individual locations and planning dates, or select a project to focus the comparison.
The distance control updates the qualifying comparisons, count and map presentation together. Each comparison shows approximate straight-line separation, the gap between recorded planning dates, project descriptions and source information. Document links appear where available; uploaded records retain file and row provenance.
Users can also explore explicit schedule assumptions, make separate reversible corrections and export selected or displayed comparisons as CSV. An optional Suggest next step integration requests a short AI recommendation about what to investigate next.
The goal is to identify candidates for further review. Approximate locations and planning dates alone do not establish a shared access route or a workable construction sequence.
How we built it
We built GridLock with React, TypeScript and Vite, using Leaflet for the map. Background Web Workers parse and validate uploaded files. Indexed spatial searches find nearby candidates, followed by straight-line distance calculations to determine qualifying cross-utility pairs.
We kept the workflow on one main page: upload or filter projects, select a comparison, inspect its evidence and export findings. Expandable controls and contextual details keep the default view focused without removing access to deeper information.
Original records, user corrections and hypothetical schedule changes remain separate. This lets users explore alternatives without silently changing the source data.
The OpenAI integration sends the selected pair’s relevant context through a server endpoint to request an investigative next step. Its API key stays server-side and outside Git. The integration and error handling have been tested with mocked responses; live API output remains a verification step.
We used Codex to assist with research, implementation, testing, documentation and Git workflows.
Our Roles:
- Santiago: Created the initial project draft, helped design and refine the UI/UX, and integrated the AI feature that generates recommendations for selected project comparisons.
- Alexa collaborated with Santiago to redesign GridLock’s map interface and tested project comparisons to verify distances, dates, and consistency between the map and comparison list.
- Erick utilized Visual Studio Code and helped make the map easy to understand through clear company markers, distance controls, and expandable details
- Blake managed data and evidence by checking all ten project records against the workbook and source PDFs, documenting date meanings and location uncertainties, and improving the interface with consistent blue styling and clearer evidence cards.
Challenges we ran into
Getting a consistent development environment running across our devices was an early challenge. We learned unfamiliar tools and syntax while resolving Git issues and integrating everyone’s contributions into one application.
The data presented its own difficulties. Planning reports contained conflicting dates, missing coordinates and project names that sometimes described a broader area than the documented work. We preserved original values and kept researched interpretations separate rather than treating uncertain information as confirmed.
Another challenge was making the map understandable without overcrowding it. Filters, distance controls, comparison results and source details all needed to remain accessible. We refined the interface around one consistent workflow and checked that the map and comparison results stayed aligned.
Accomplishments that we're proud of
We connected file upload, geographic comparison, source inspection and export into one working workflow. The supplied ten-project sample produces six cross-utility pairs below twenty-five miles, while preserving the context behind their locations and dates.
We are also proud of keeping the practical question in focus: which nearby projects deserve further investigation for access and logistics coordination?
For most of our team, this was our first hackathon. Learning together, resolving integration problems and turning separate contributions into a coherent project was an accomplishment in itself.
What we learned
We learned that a useful planning tool needs more than points on a map. Users need to understand where information came from, what dates represent and how each comparison was formed.
We also learned to distinguish geographic proximity from practical coordination. Projects could be nearby yet have incompatible access requirements or schedules. Conversely, sequential work might create an opportunity to move suitable mats between projects after their release, even without overlapping construction.
These lessons shaped GridLock around traceable evidence and questions worth investigating. The experience also strengthened our collaboration, version-control practices and ability to explain technical decisions through user needs.
What's next for GridLock
For the future, we want to validate the workflow with utility planners using current construction windows and actual access routes. We will expand the dataset, improve location accuracy and refine the interface based on their feedback.
Next versions would incorporate terrain, site conditions, access permissions, staging requirements and matting information. This could help planners assess whether suitable mats would become available when another project needs them and whether transport and reuse would be practical.
We would validate these assessments against planner reviews and verified project and logistics records, building an evidence base for evaluating potential coordination benefits and savings.

Log in or sign up for Devpost to join the conversation.