-
-
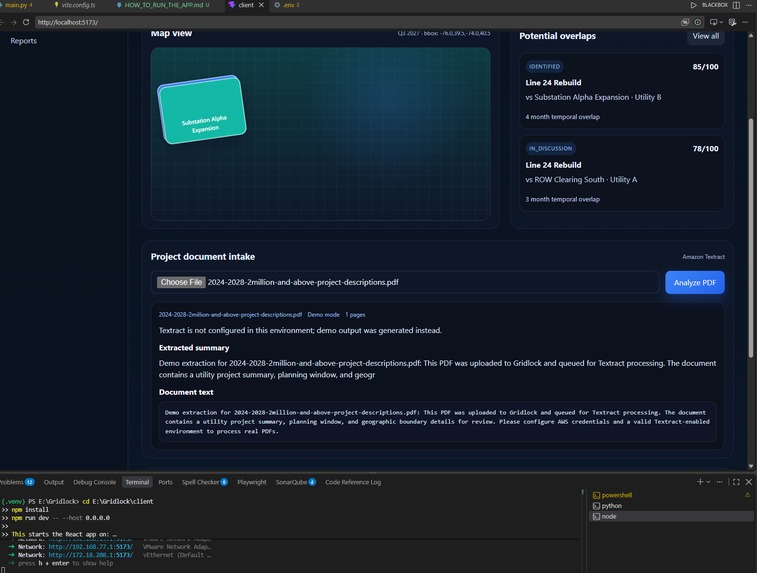
Gridlock-dashboard
-
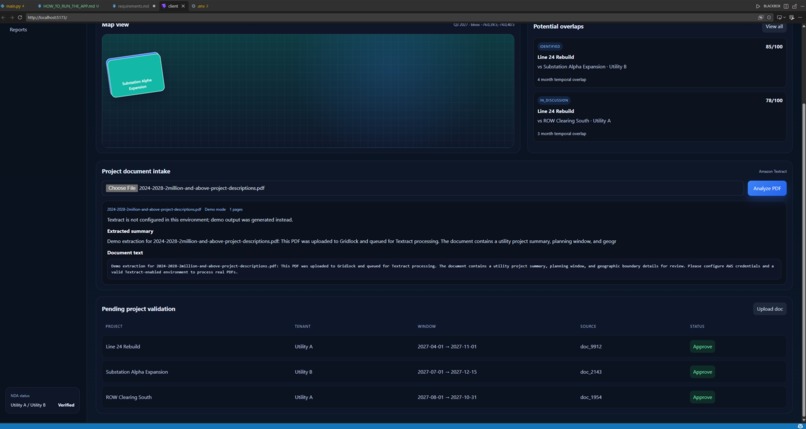
Gridlock-dashboard1
Inspiration
With FERC Order 1920 requiring utilities and Regional Transmission Organizations (RTOs) to conduct comprehensive, scenario-based transmission planning over a 20-year horizon, an unprecedented amount of long-term grid data is entering the public record. By combining this regulatory push with AI, we can bridge the visibility gap between neighboring utilities and create a proactive coordination tool.
What it does
The most effective way to solve the utility coordination problem is to build a centralized Geospatial AI Matching Engine that automatically ingests unstructured public planning documents, extracts project timelines and locations, and overlays them on a single unified map.
How we built it
1. Project Overview
- Description: a scalable, centralized geospatial dashboard that separates heavy spatial computations from the web frontend. To handle unstructured utility documents, complex spatial project queries, and real-time mapping queries, and real-time mapping.
- Target Audience: utility workers
- Project Scope: a. Because utilities publish unstructured PDFs and compliance filings, you need an asynchronous pipeline to extract the data and aggregate the information in a unified dashboard for any overlaps.
1. Document Parsing: Use AWS Textract to extract text, tables, and schedules from massive utility plans.

2. AI Extraction: Use Python with an orchestration framework like LangChain or LlamaIndex to pass the parsed text to a Large Language Model (like GPT-4o or Claude 3.5). The LLM's job is to extract the project scope, dates, and geographic markers into a standardized JSON format.

3. Task Queues: Use Celery backed by Redis to handle the long-running AI extraction and formatting jobs in the background.

b.Geospatial Database (The Core Engine): Never try to calculate overlapping geographic boundaries in the application's memory; move the spatial logic to the database level.

1. Primary Database: PostgreSQL extended with PostGIS. Store the extracted project coordinates as actual geometric shapes rather than plain text coordinates.

2. Matching Logic: Use built-in PostGIS functions like ST_Intersects or ST_DWithin to instantly query whether two utility project polygons physically overlap or fall within a specific coordination radius of each other.

c.Backend API. The backend acts as a traffic controller, ensuring the frontend only loads the map data relevant to the user's current viewport.
    1. API Framework: FastAPI (Python). Geospatial apps are heavily read-optimized and require concurrent data streaming. FastAPI is asynchronous, highly performant, and natively handles Python data validation.

    2. Spatial ORM: Use GeoAlchemy2 or asyncpg to securely and rapidly query PostGIS directly from the Python backend.

d.Frontend & Map Visualization. Rendering tens of thousands of transmission lines and substation points simultaneously will crash a standard web map. We need GPU-accelerated rendering.

1. Core UI Framework: React or Next.js.

2. Base Map: MapLibre GL JS for rendering the underlying street, satellite, or topographical map tiles.

3. Data Visualization Layer: deck.gl. Built to handle massive geospatial datasets, deck.gl overlays on top of the base map and leverages the browser's GPU (WebGL) to smoothly render complex utility boundaries and overlapping construction zones without performance lag.

e. Cloud Infrastructure

1. Containerization: Docker ensures that AI pipeline, FastAPI backend, and PostGIS database run consistently across environments.

2. Hosting: Deploy on AWS. Use managed object storage (like AWS S3) for holding raw utility filings, and a managed relational database (like Amazon RDS for PostgreSQL) to simplify scaling and PostGIS maintenance.
2. Technology Stack
- Frontend: [React 19, TypeScript, Tailwind CSS, deck.gl]
- Backend: [Python FastAPI, LLM, AWS Textract]
- Database / Storage: [PostgreSQL, PostGIS, Redis]
- Authentication: [OAuth2]
- Deployment & Infra: [Docker]
3. Architecture & Directory Structure
- High-Level Data Flow: The Client Initiates the Request. The client (the single-page application dashboard) is the starting point. When a user takes an action like clicking a button to view an overlapping utility project, the client packages that action into a formatted request (typically an HTTP or HTTPS request). This request is sent over the network to the server, carrying necessary details like authorization tokens and the specific data parameters needed.
The Server Processes the Logic The server (the backend application layer, like FastAPI ) acts as the brain and traffic cop. It receives the client's request, verifies that the user is authenticated and authorized, and executes the business logic. Because the server does not store permanent data itself, it translates the client's request into a query (like SQL) that the database will understand.
The Database Retrieves or Stores Data. The database (the storage layer, like PostgreSQL) receives the server's query. It executes the search, updates, or spatial calculations requested. Once complete, it packages the raw, requested data and sends it back to the server.
The Server Formats the Response. The server takes the raw data returned by the database, formats it into a structure the client can easily read (usually JSON), and wraps it in an HTTP response.
The Client Renders the View. The client receives the final response from the server. It parses the data and updates the user interface, such as dynamically drawing new power lines on the user's map, completing the cycle.
4. User Flows & Core Functionality
- User Journey 1: [e.g., User Authentication & Onboarding] Here are the primary user flows and the core functionality driving them:
- The "Ingestion & Validation" Flow (Internal View) Before coordinating with others, a utility must ensure its own data is accurate within the system.
Core Functionality: Automated PDF/spreadsheet parsing, AI data extraction, and a validation UI.
The Flow:
Upload/Sync: A planner uploads their utility's latest 5-year capital plan (or the system automatically ingests it from a public regulatory docket).
AI Processing: The AI extracts project scopes, coordinates, and timelines.
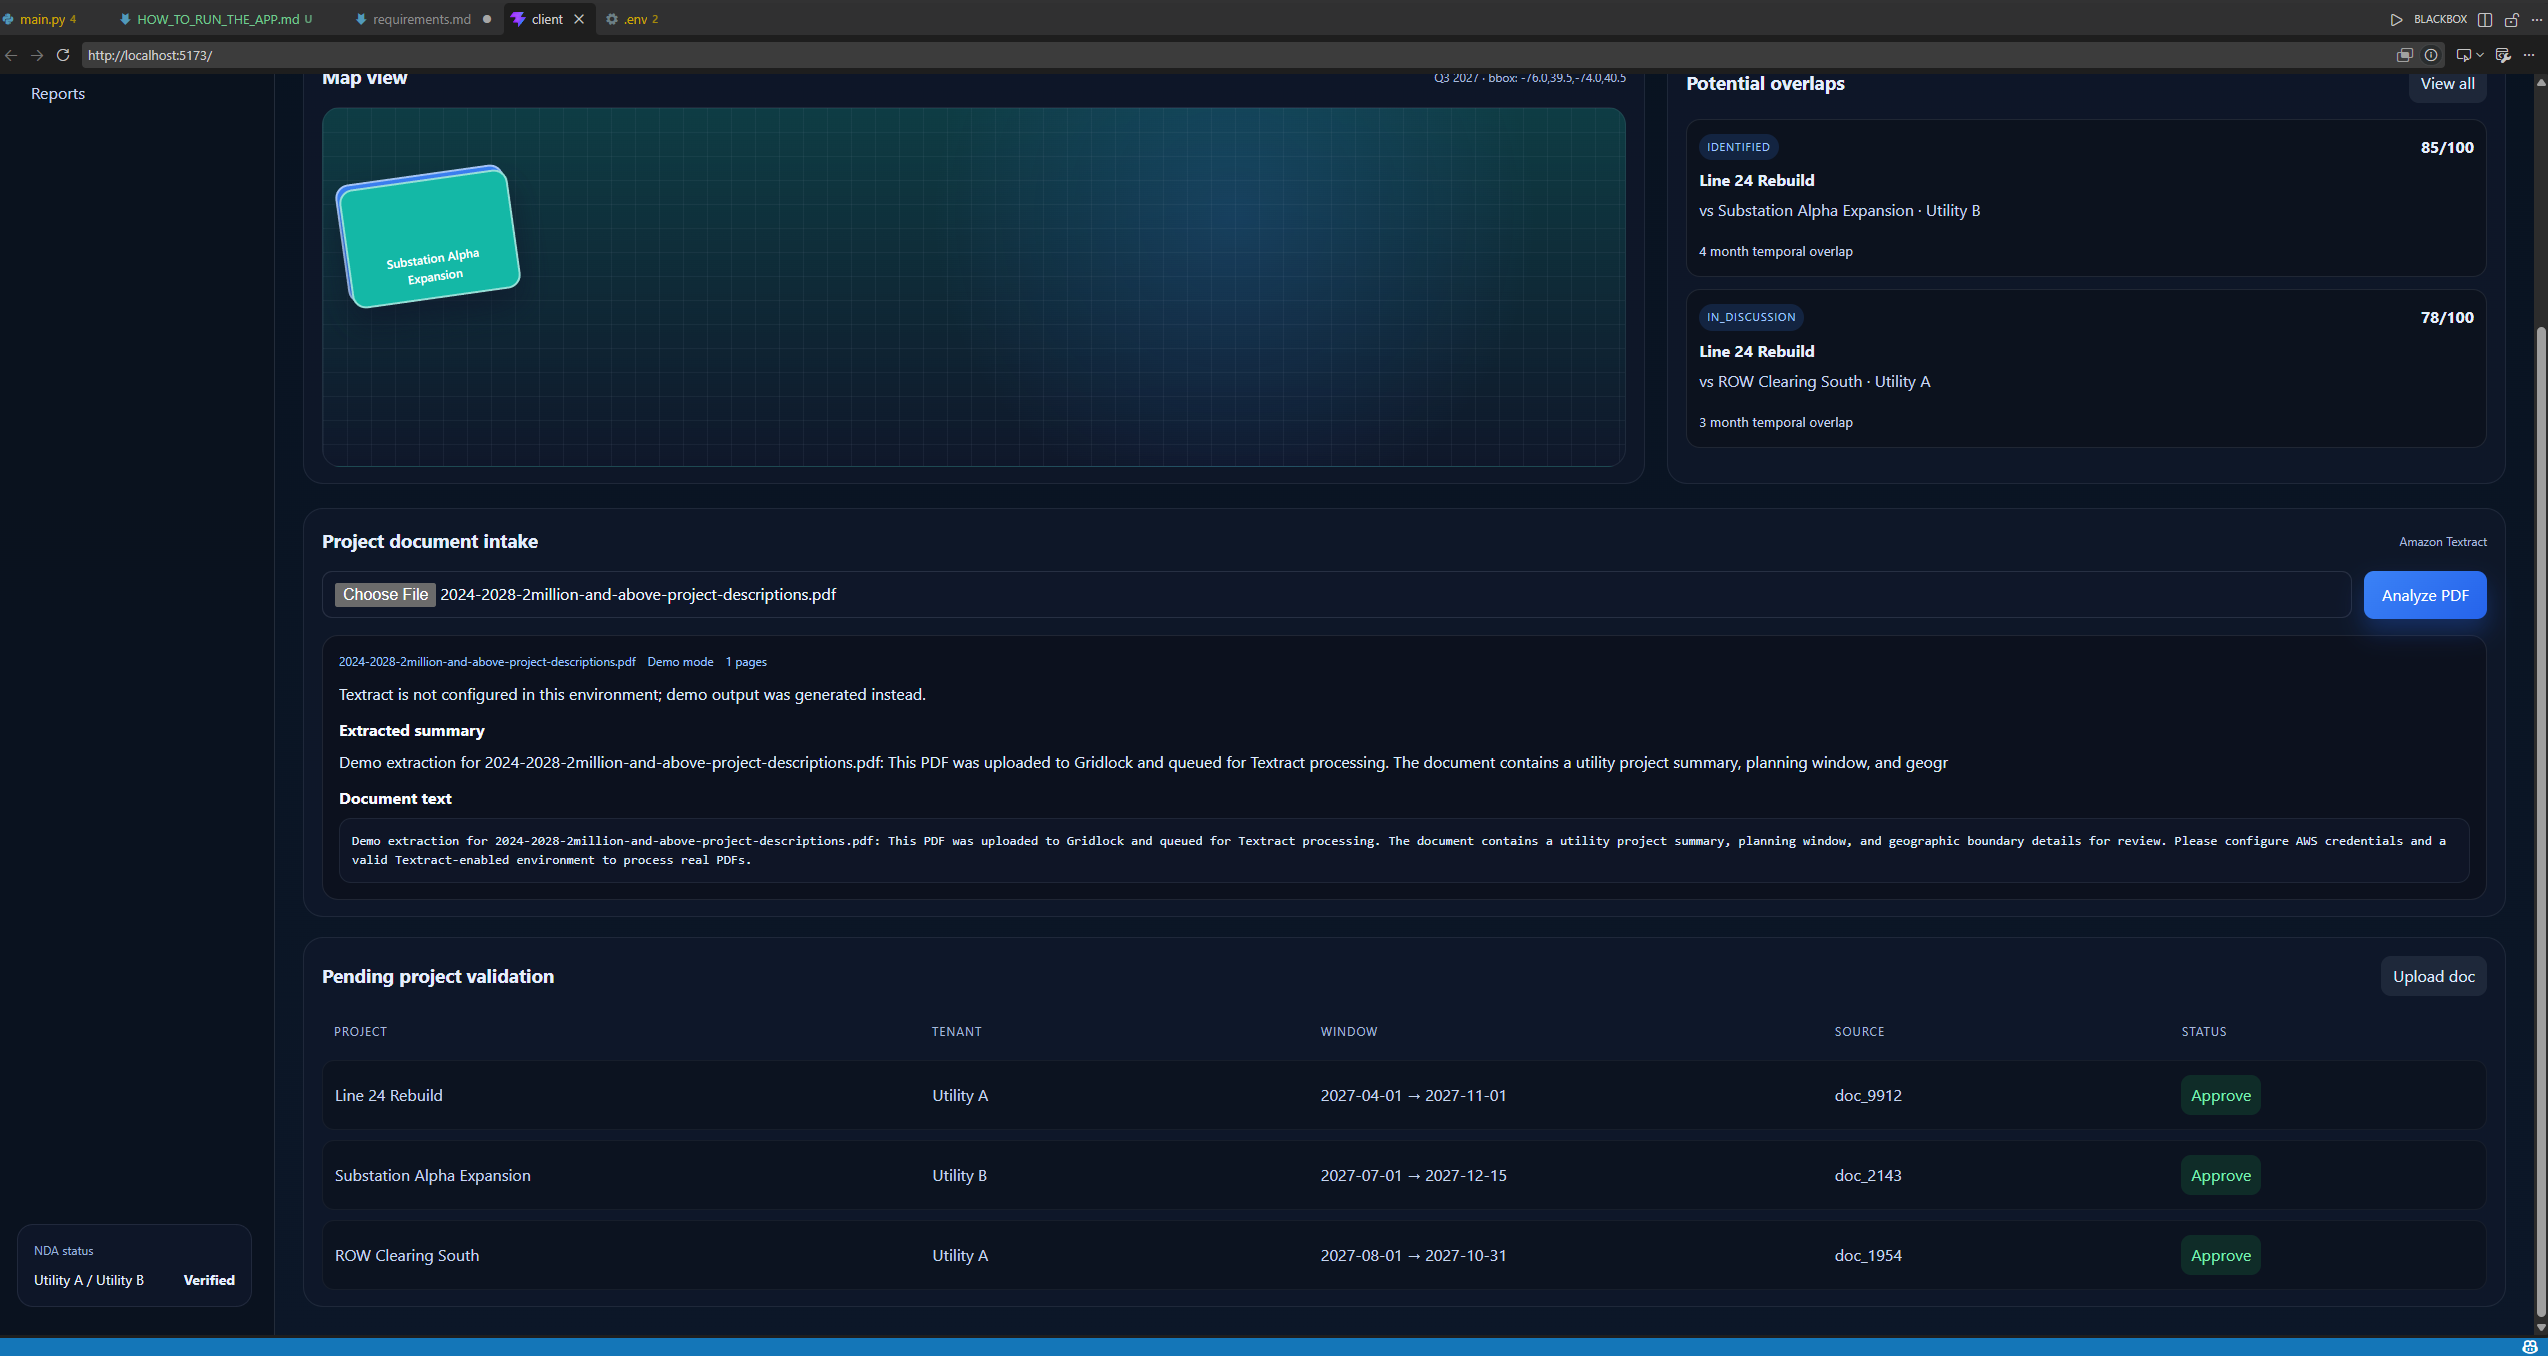
Human-in-the-Loop Validation: The planner reviews a list of "Pending Projects." The UI highlights the AI-extracted data alongside the original source document. The planner clicks "Approve" or edits errors (e.g., correcting a misread ZIP code).
Publishing: Once approved, the projects are committed to the spatial database and become visible to the matching engine.
- The "Discovery & Match" Flow (The Core Value Prop) This is where the platform generates its ROI by identifying previously unseen synergies.
Core Functionality: A spatiotemporal matching algorithm, an interactive GIS map (deck.gl), and Synergy Scoring.
The Flow:
Alert Generation: The system runs its nightly matching job. It finds that Utility A is rebuilding a substation in Q3 2027, and Utility B is clearing a transmission right-of-way 3 miles away in Q4 2027.
Notification: Planners at both utilities receive an in-app alert and an email summary: “High-Value Overlap Detected: Substation Rebuild / ROW Clearing (Q3-Q4 2027).”
Map Exploration: The planner clicks the alert and is taken to the Interactive Map Dashboard. The map automatically zooms to the location and renders both projects as distinct, overlapping polygons.
Detail Review: Clicking on the overlap reveals the "Synergy Score" and the specific resource-sharing opportunities (e.g., "Potential to share heavy earth-moving equipment and traffic control resources").
- The "Coordination & Outreach" Flow (Cross-Tenant Action) Identifying an overlap is useless if the utilities cannot communicate securely.
Core Functionality: Secure cross-tenant messaging, shared workspaces, and NDA gating.
The Flow:
Initiate Contact: Planner A decides the overlap is worth pursuing and clicks "Request Coordination."
Information Gate: Because project details can be sensitive, the system checks if a mutual NDA is on file between Utility A and Utility B. If not, it prompts the legal workflow.
Shared Workspace: Once approved, a secure "Coordination Room" opens. Here, planners from both utilities can chat, share detailed CAD files or engineering schematics (which are not ingested into the main public database), and assign tasks.
Status Tracking: The overlap moves from "Identified" -> "In Discussion" -> "Coordinated (Action Plan Created)."
- The "Reporting & Regulatory" Flow (Executive View) Regulators (like FERC or state PUCs) and utility executives need to track the success of these coordination efforts to justify budgets and prove compliance.
Core Functionality: Data aggregation, ROI calculators, and exportable compliance reports.
The Flow:
Dashboard View: An executive logs in and views the "Coordination ROI Dashboard."
Metrics Tracking: The dashboard displays aggregate metrics: "Total Overlaps Found," "Active Coordinations," and "Estimated Capital Saved via Shared Resources."
Report Generation: The user selects a date range and clicks "Generate FERC 1920 Compliance Report." The system compiles a PDF summarizing all coordinated regional planning efforts, which can be submitted directly to regulators.
5. API Contracts & Database Schema
- Database Schema:
tenantstable:id(UUID, PK),name(VARCHAR(255), NOT NULL),sso_domain(VARCHAR(255), unique),created_at(TIMESTAMPTZ, Default NOW())Userstable:id(UUID, PK),tenant_id(UUID,FK),email(VARCHAR(255), Unique, Not Null),role(VARCHAR(50), Not Null)projectstable:id(UUID, PK),tenant_id(UUID, FK),name(VARCHAR(255), Not Null),project_type(VARCHAR(50), Not Null),geom(GEOMETRY(Geometry, 4326), Not Null),start_date(DATE, Not Null),end_date(DATE, Not Null),source_doc_url(TEXT, Nullable)matchestable:project_a_id(UUID, FK),project_b_id(UUID, FK),synergy_score((INT), 0-100),spatial_distance_m((FLOAT), Not Null),status(VARCHAR(50), Default 'identified')workspacestable:id(UUID, PK),match_id(UUID, PK),nda_signed_a(BOOLEAN, Default False),nda_signed_b(BOOLEAN, Default False)
- Key API Endpoints:
POST /api/v1/projects/ingest- Accepts structured data from the AI extraction pipeline and inserts it into the Projects table. Request Payload: JSON { "tenant_id": "b4f2a3...", "source_document_id": "doc_9912", "projects": [ { "name": "Line 24 Rebuild", "type": "transmission", "start_date": "2027-04-01", "end_date": "2027-11-01", "geojson_boundary": { "type": "Polygon", "coordinates": [[[-75.1, 40.0], [-75.2, 40.1], [-75.3, 40.0], [-75.1, 40.0]]] } } ] }GET /api/v1/projects/map- Feeds the React/deck.gl frontend. To prevent crashing the browser, it uses spatial bounding boxes (bbox) to only return the projects currently visible on the user's screen. Query Parameters: bbox: -76.0,39.5,-74.0,40.5 (min_lon, min_lat, max_lon, max_lat) , year: 2027
Request Payload (GeoJSON format): JSON { "type": "FeatureCollection", "features": [ { "type": "Feature", "geometry": { "type": "Polygon", "coordinates": [[...]] }, "properties": { "project_id": "p_8841", "name": "Line 24 Rebuild", "tenant_name": "Utility A", "match_count": 1 } } ] }
GET /api/v1/matches/alerts- Purpose: Returns the list of spatial overlaps calculated by the database for the currently authenticated user's tenant.
Response Payload: JSON { "data": [ { "match_id": "m_102", "synergy_score": 85, "my_project": { "id": "p_8841", "name": "Line 24 Rebuild" }, "external_project": { "id": "p_3321", "tenant_name": "Utility B", "name": "Substation Alpha Expansion" }, "temporal_overlap_months": 4 } ] }
Challenges we ran into
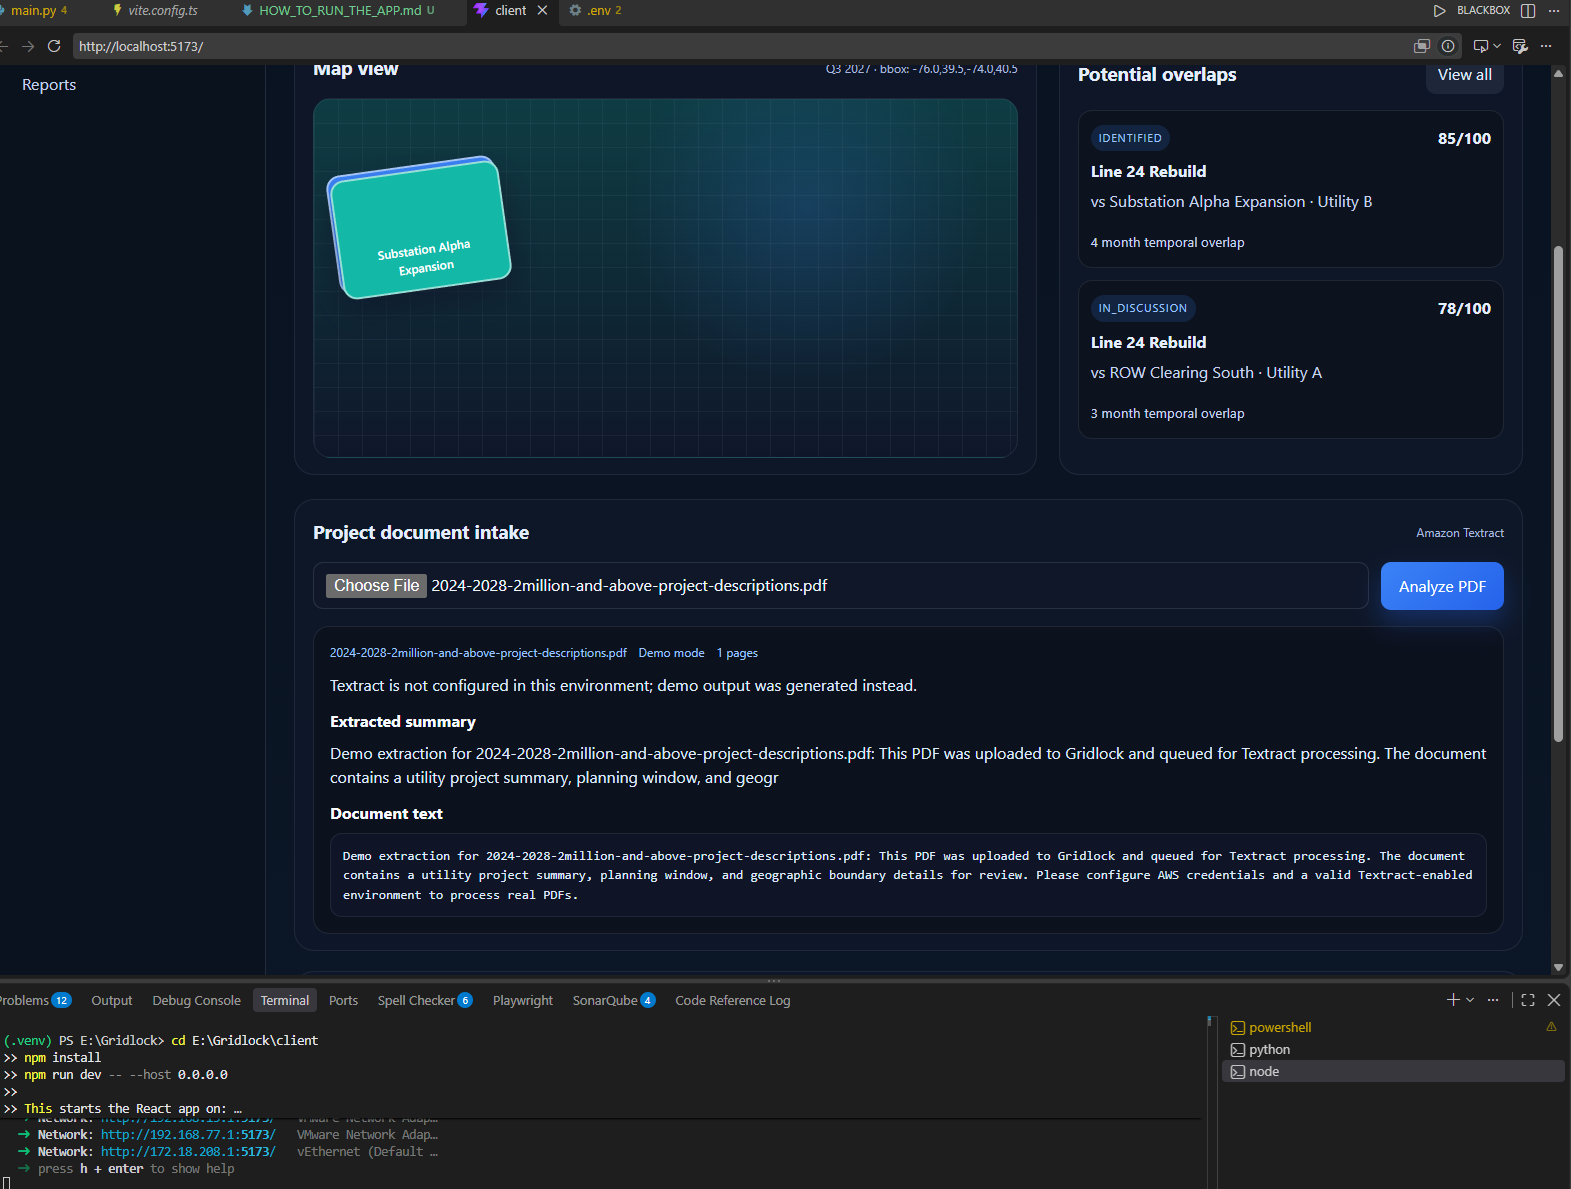
I tried to figure out how I can get the API key through their developer support, through the IAM role or if that is restricted I integrated AWS Textract into my project, and I see this message when I use the 'Project document intake' feature, which led me to investigate the AWS account credentials for AWS Textract. I am currently looking into acquiring the right AWS Textract API secret keys into the env file. But I suspect that it could be an IAM access issue with the AWS account, so I want to make sure.
Accomplishments that we're proud of
I was able to create a mock overlap dashboard
What we learned
Database design, application system design, NLP document text extraction, full-stack software development, Amazon Web Services, Python
What's next for Gridlock
Implement LLMs and AI comparison for data overlaps
Built With
- deck.gl
- fastapi
- llm
- postgis
- postgresql
- python
- react

Log in or sign up for Devpost to join the conversation.