Inspiration
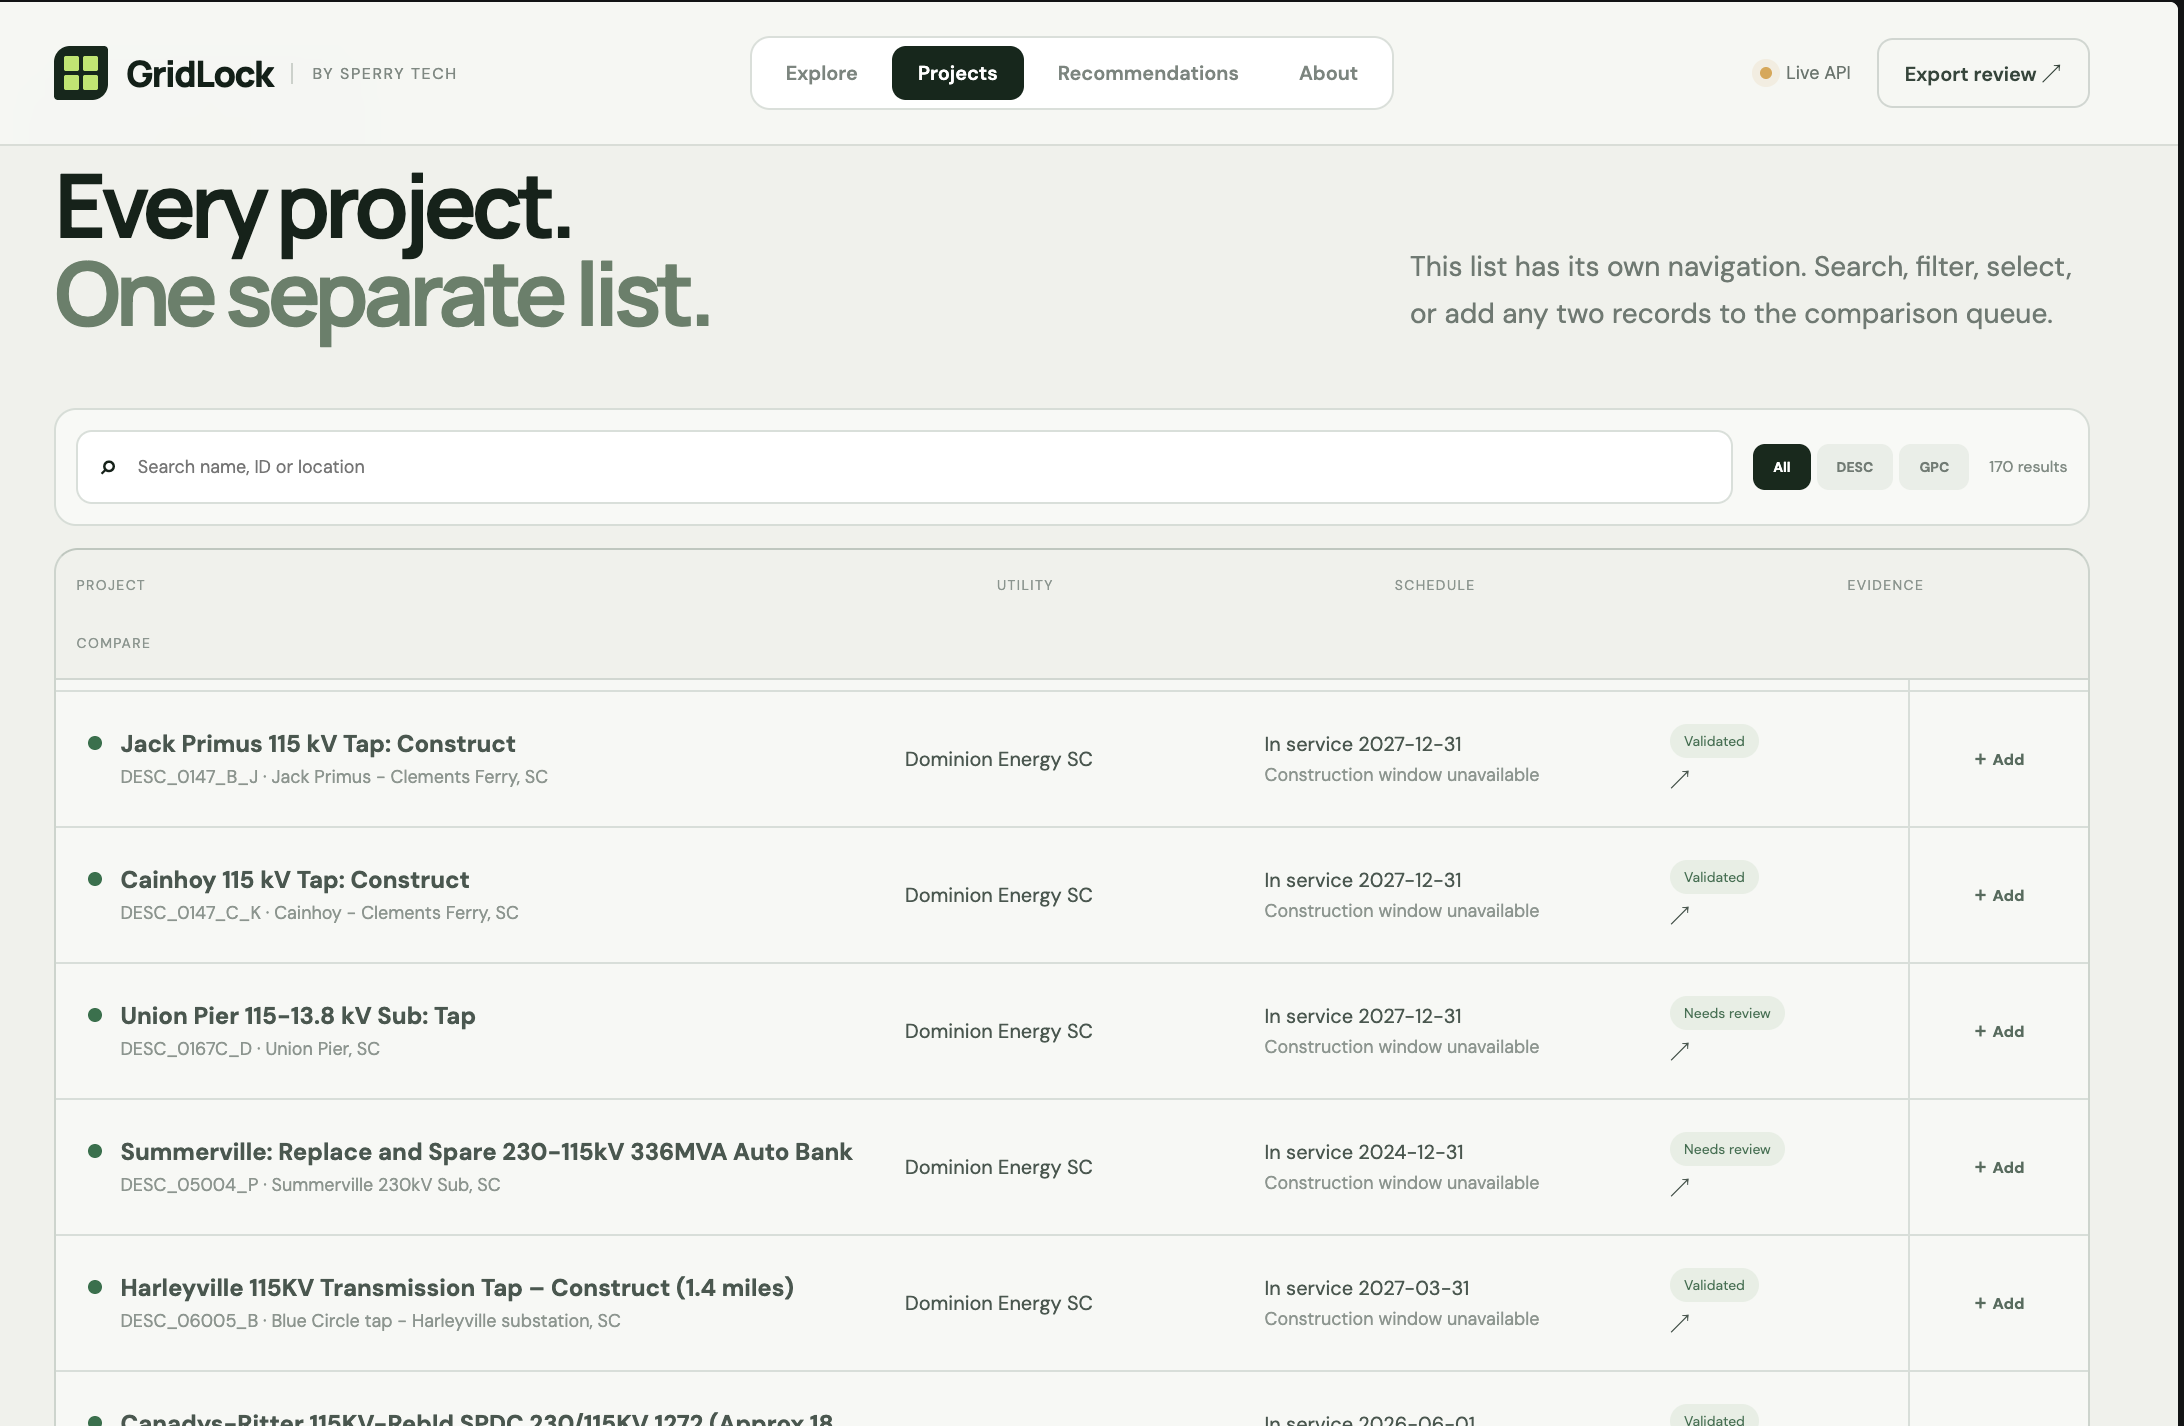
Transmission infrastructure projects are often documented across PDFs, spreadsheets, route descriptions, and separate project files. When multiple projects are planned in nearby areas, identifying overlaps and potential coordination issues can be difficult and time-consuming.
We built GridLock to make that process easier by transforming fragmented project information into a clear, interactive geographic experience.
What it does
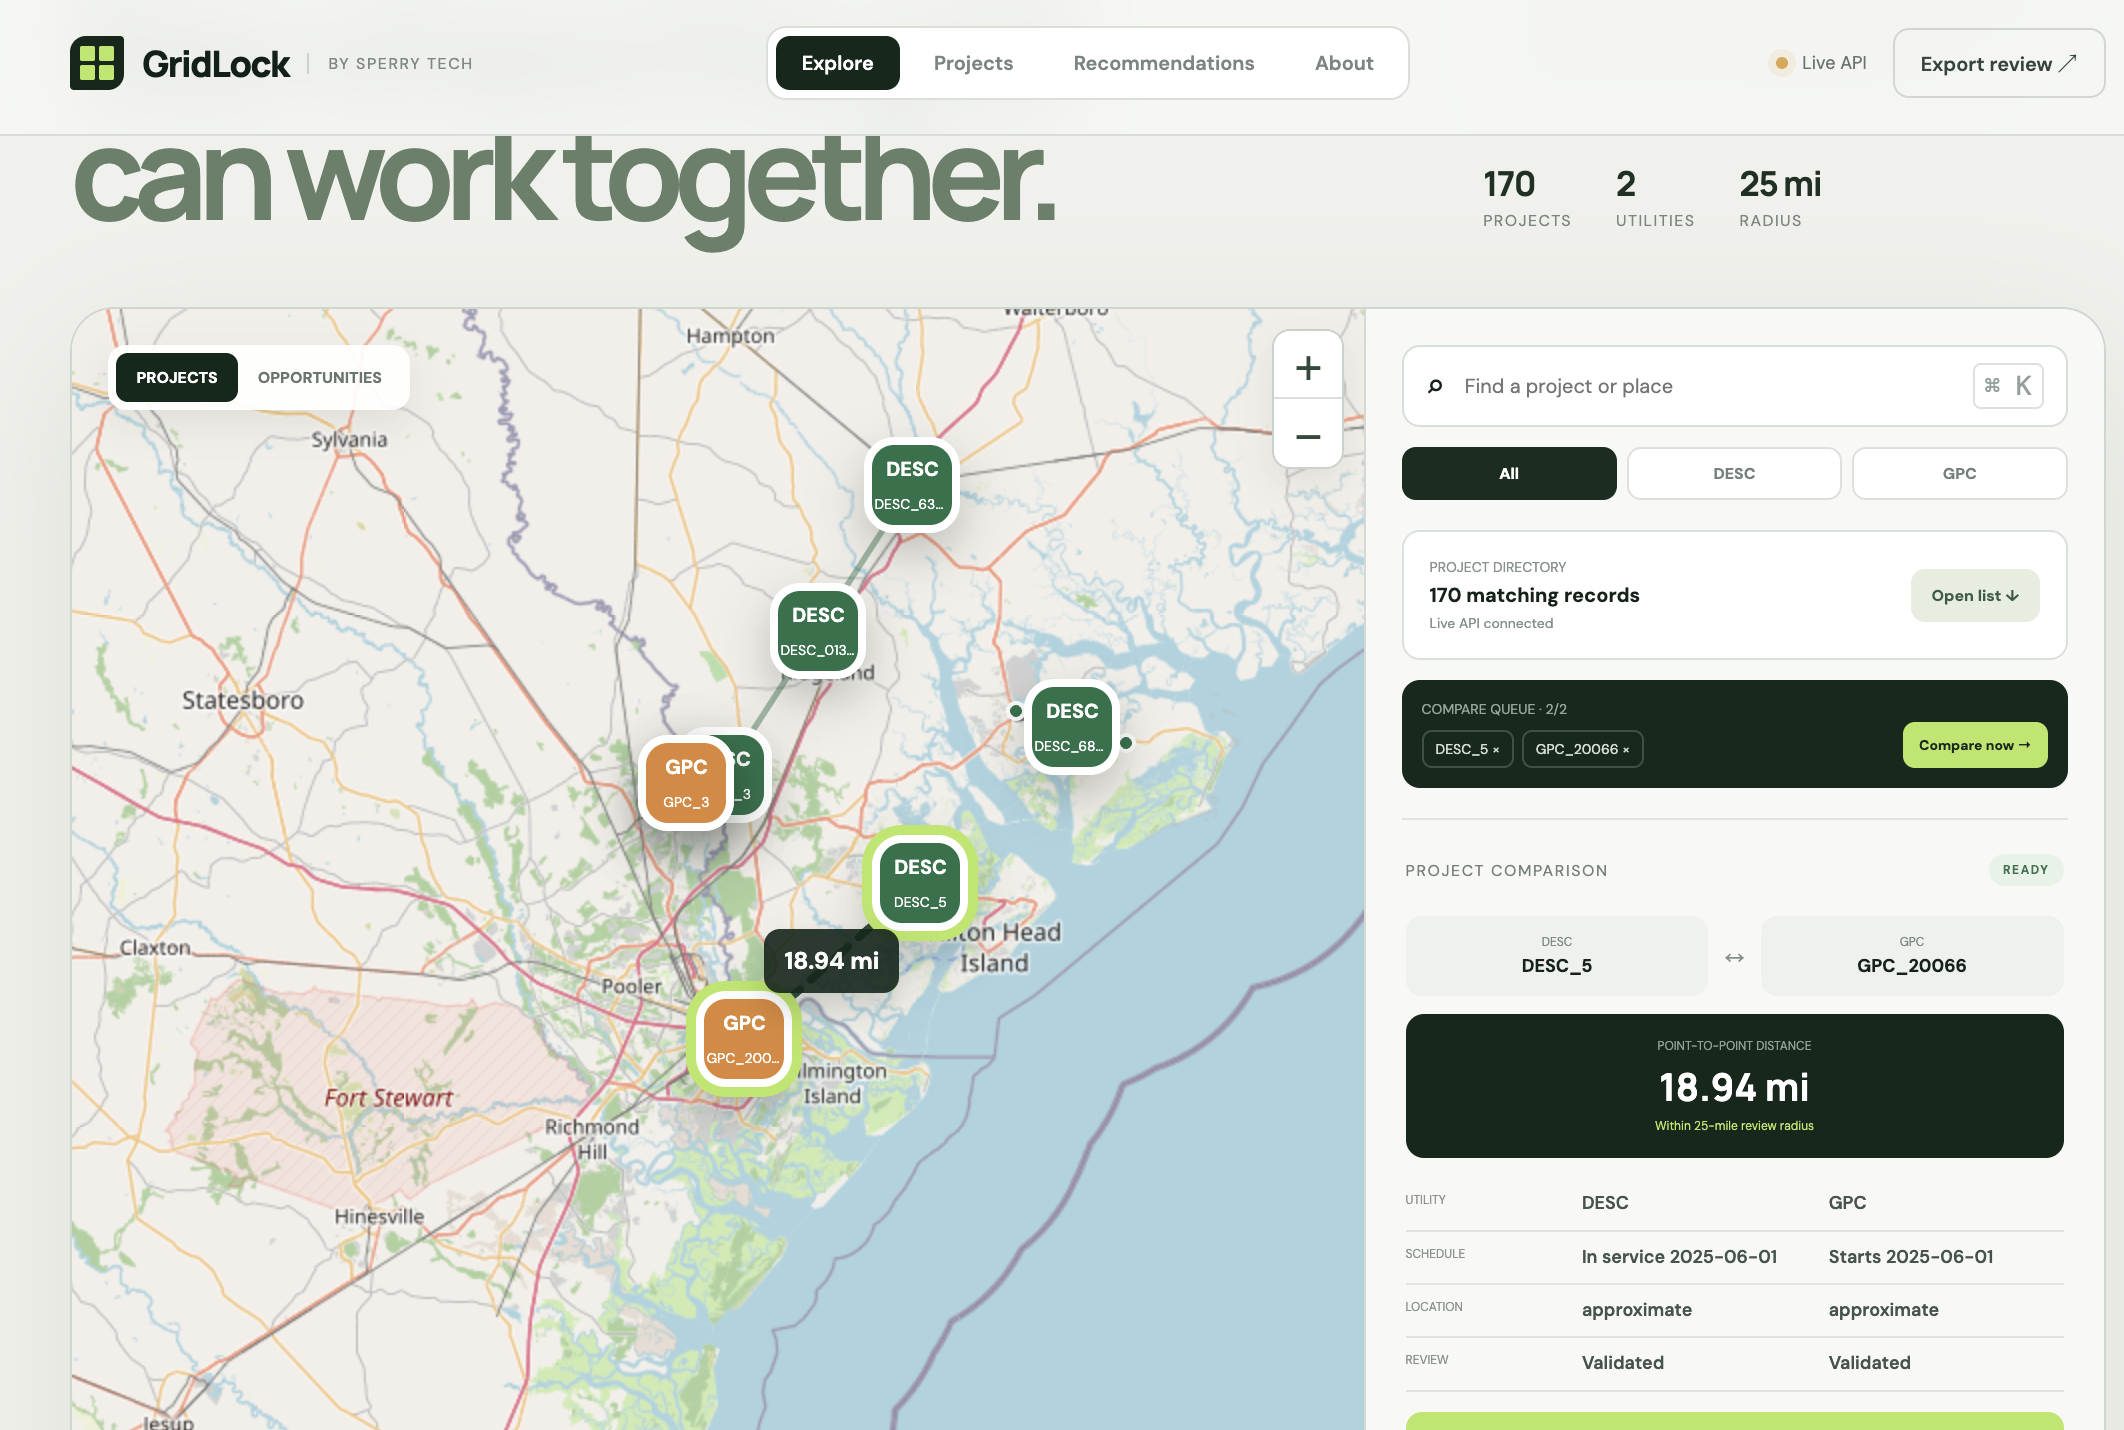
GridLock combines transmission project data into an interactive map that helps users understand where projects are located, how their routes relate to one another, and where potential overlaps may occur.
Users can explore project locations, visualize routes, identify geographic conflicts, and access project-specific information in one place.
GridLock helps teams:
- Visualize transmission projects on an interactive map
- Detect project and route overlaps
- Identify nearby infrastructure conflicts
- Explore project and location details
- Surface location-based recommendations
- Reduce the need to manually compare PDFs and spreadsheets
How we built it
We built GridLock using a combination of frontend mapping tools, Python-based data processing, and structured project datasets.
The frontend was developed with React and Vite, while Leaflet powers the interactive map.
On the data side, Python scripts process project information, enrich locations, organize route data, and generate recommendations.
We also used Google Gemini to assist with extracting structured information from project documents.
The processed data is converted into structured formats that can be used by the frontend to display projects, routes, and recommendations dynamically.
Challenges we ran into
One of the biggest challenges was converting infrastructure project descriptions into reliable geographic information.
Project documents often describe locations using substations, roads, counties, corridors, or nearby landmarks instead of exact coordinates.
Another challenge was combining information from multiple sources while keeping project names, routes, and locations consistent.
We also had to design the interface so that complex project relationships could be understood quickly without overwhelming the user.
Accomplishments that we're proud of
We are proud that GridLock turns fragmented infrastructure information into a single interactive system.
Instead of only displaying project locations, GridLock connects project data, routes, overlaps, and recommendations to help users better understand how infrastructure projects may affect one another.
We also created a workflow that can process additional project data and expand the map as more infrastructure information becomes available.
What we learned
We learned how important data normalization, location enrichment, and geospatial visualization are when working with real-world infrastructure data.
We also gained experience integrating Python data pipelines with a React frontend and an interactive mapping system.
Most importantly, we learned that complex infrastructure relationships can become much easier to understand when they are presented visually instead of through static documents or spreadsheets.
What's next for GridLock
The next step for GridLock is to support more transmission projects, more detailed route information, and larger geographic datasets.
Future versions could include real-time project updates, construction timeline comparisons, automated conflict detection, risk scoring, and smarter recommendations to help infrastructure teams identify coordination issues earlier.

Log in or sign up for Devpost to join the conversation.