Inspiration
Watching a Grand Prix often leaves us with questions that a highlight reel cannot answer. Where did a driver lose time? Did fresh tyres justify an extra stop? Could a different decision have changed the result?
We imagined a race viewer that people could investigate rather than simply watch. A place where they could change perspective, revisit a crucial lap, compare strategies, and learn why a team made a particular call.
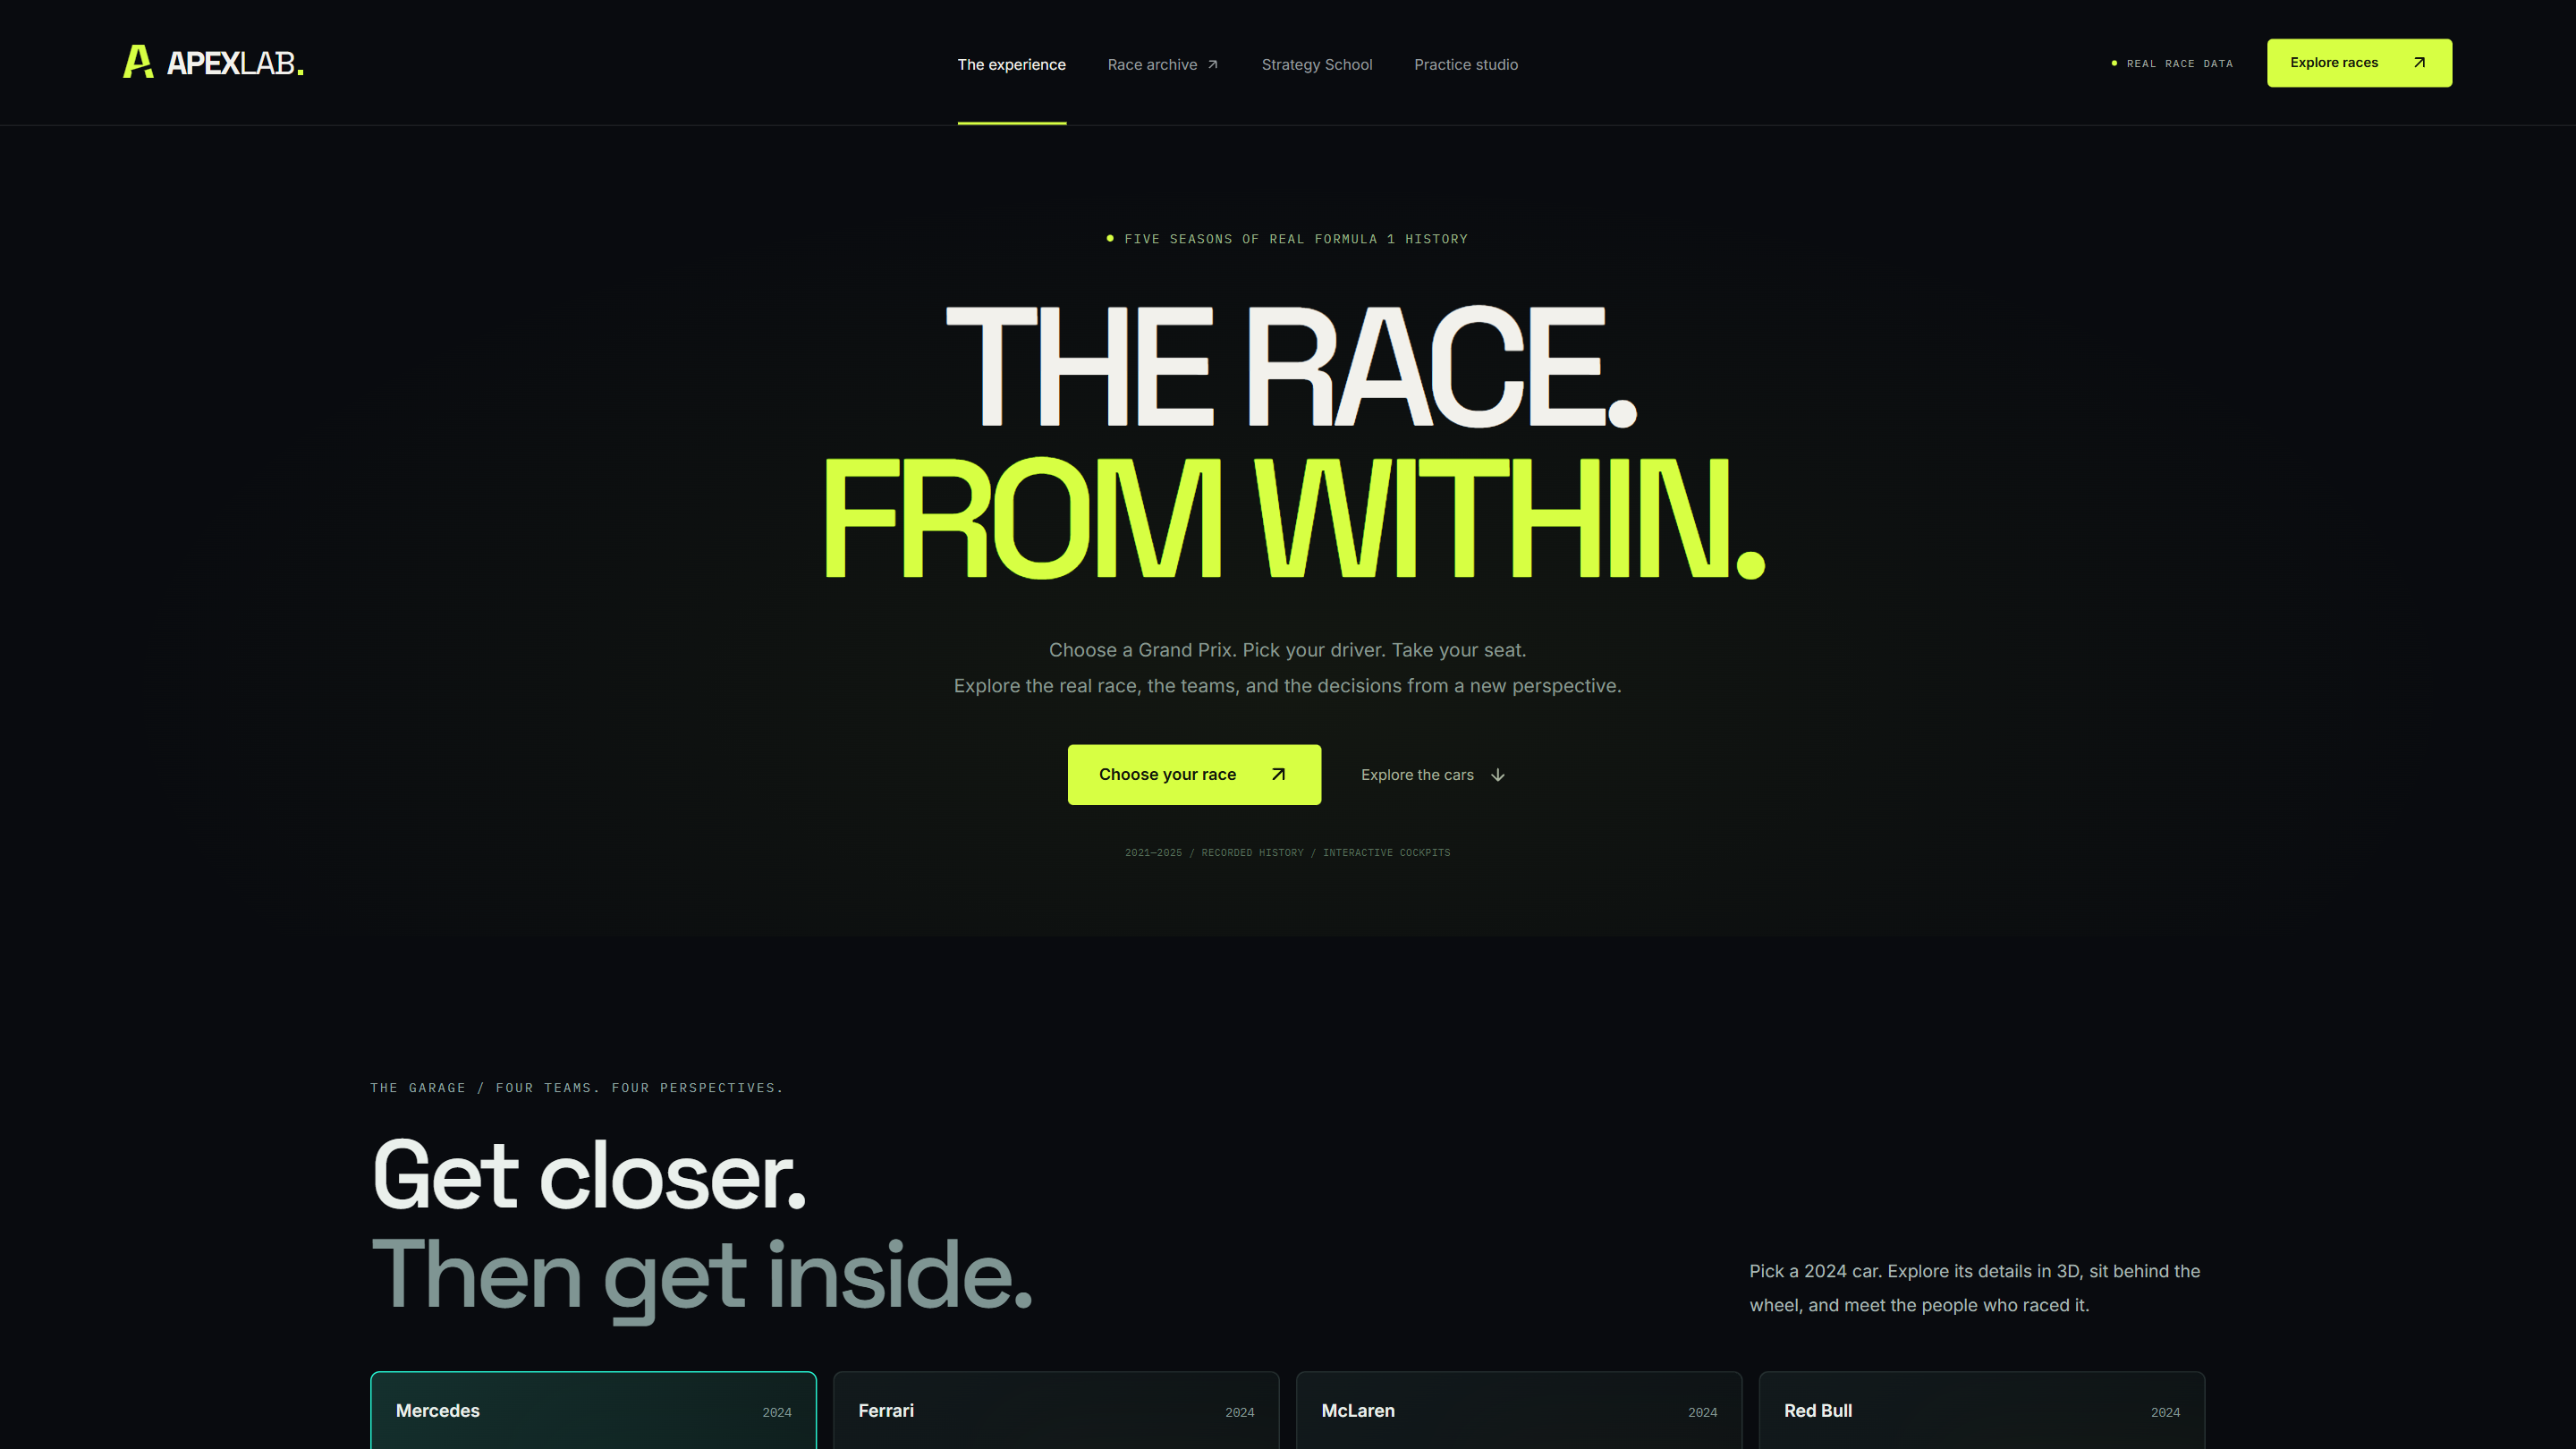
GridLens — 3D Race Replay & Strategy Studio grew from that idea. It brings historical racing records into an interactive visual environment, making race analysis more approachable through exploration.
The project connects the excitement of motorsport with the curiosity of data analysis. Its purpose is to help users move from “What happened?” to “What explains it?”
What it does
GridLens is an interactive workspace for exploring historical Formula 1 races and the decisions that shaped them.
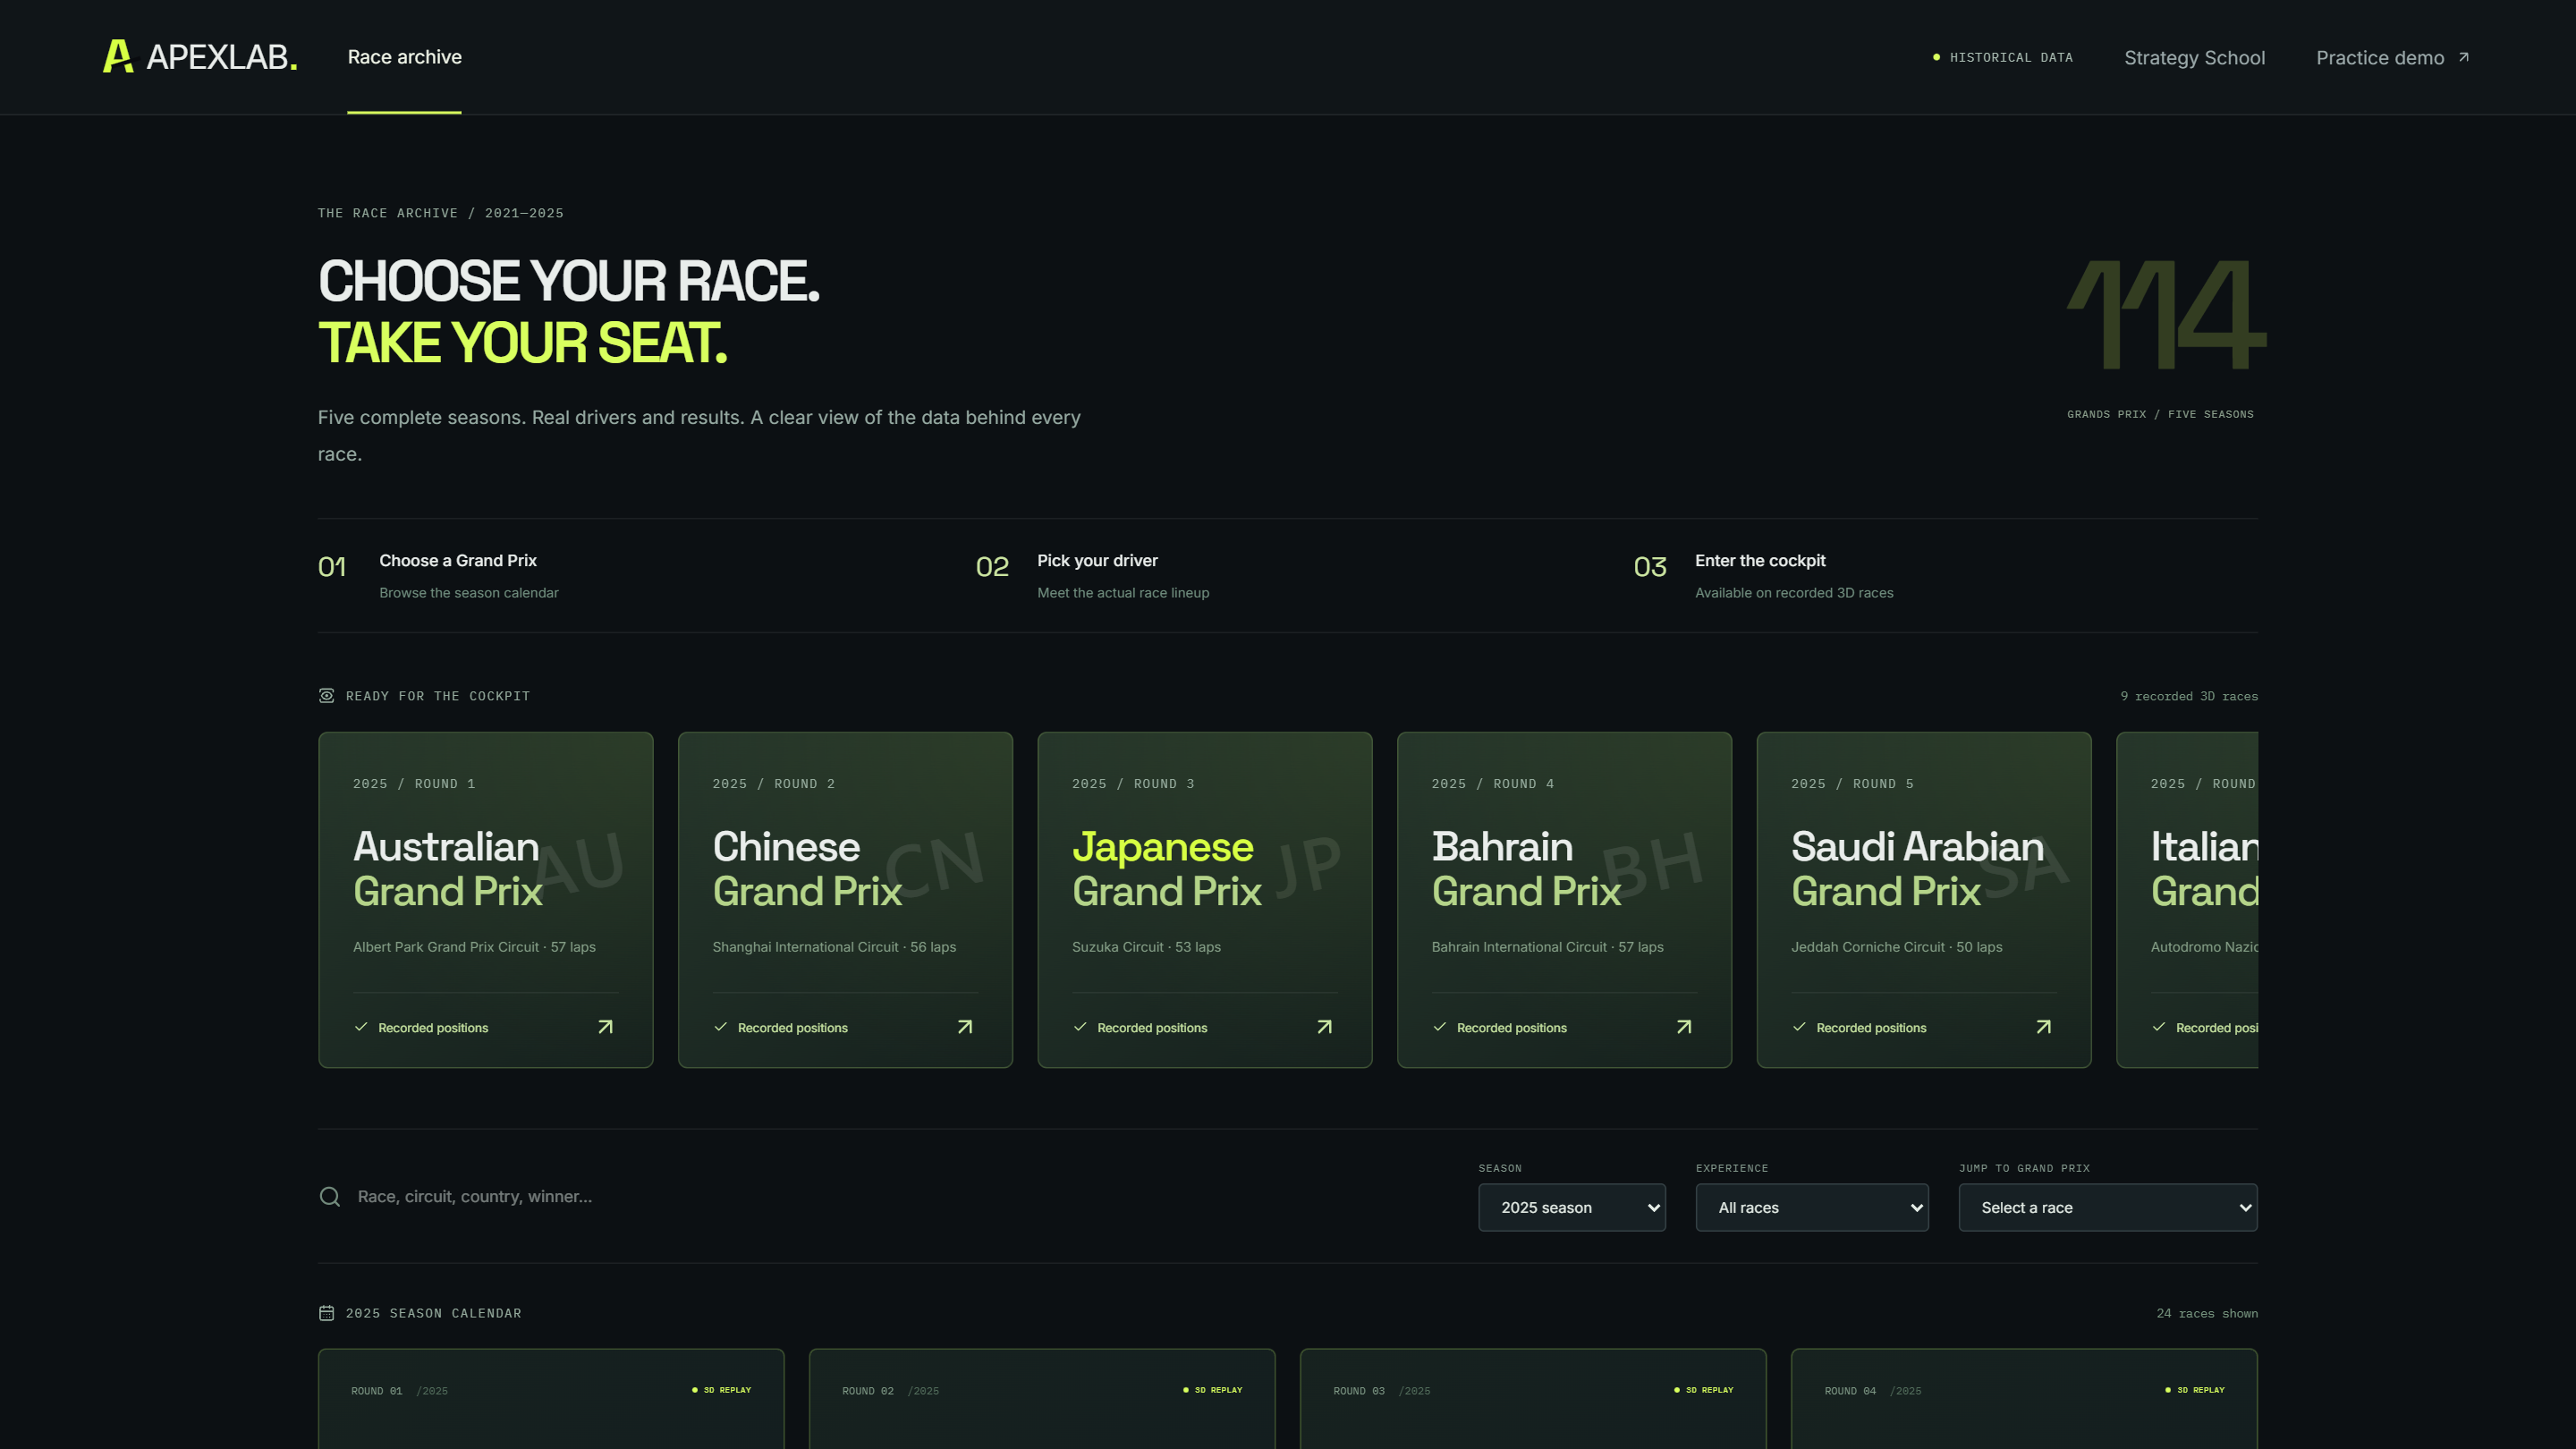
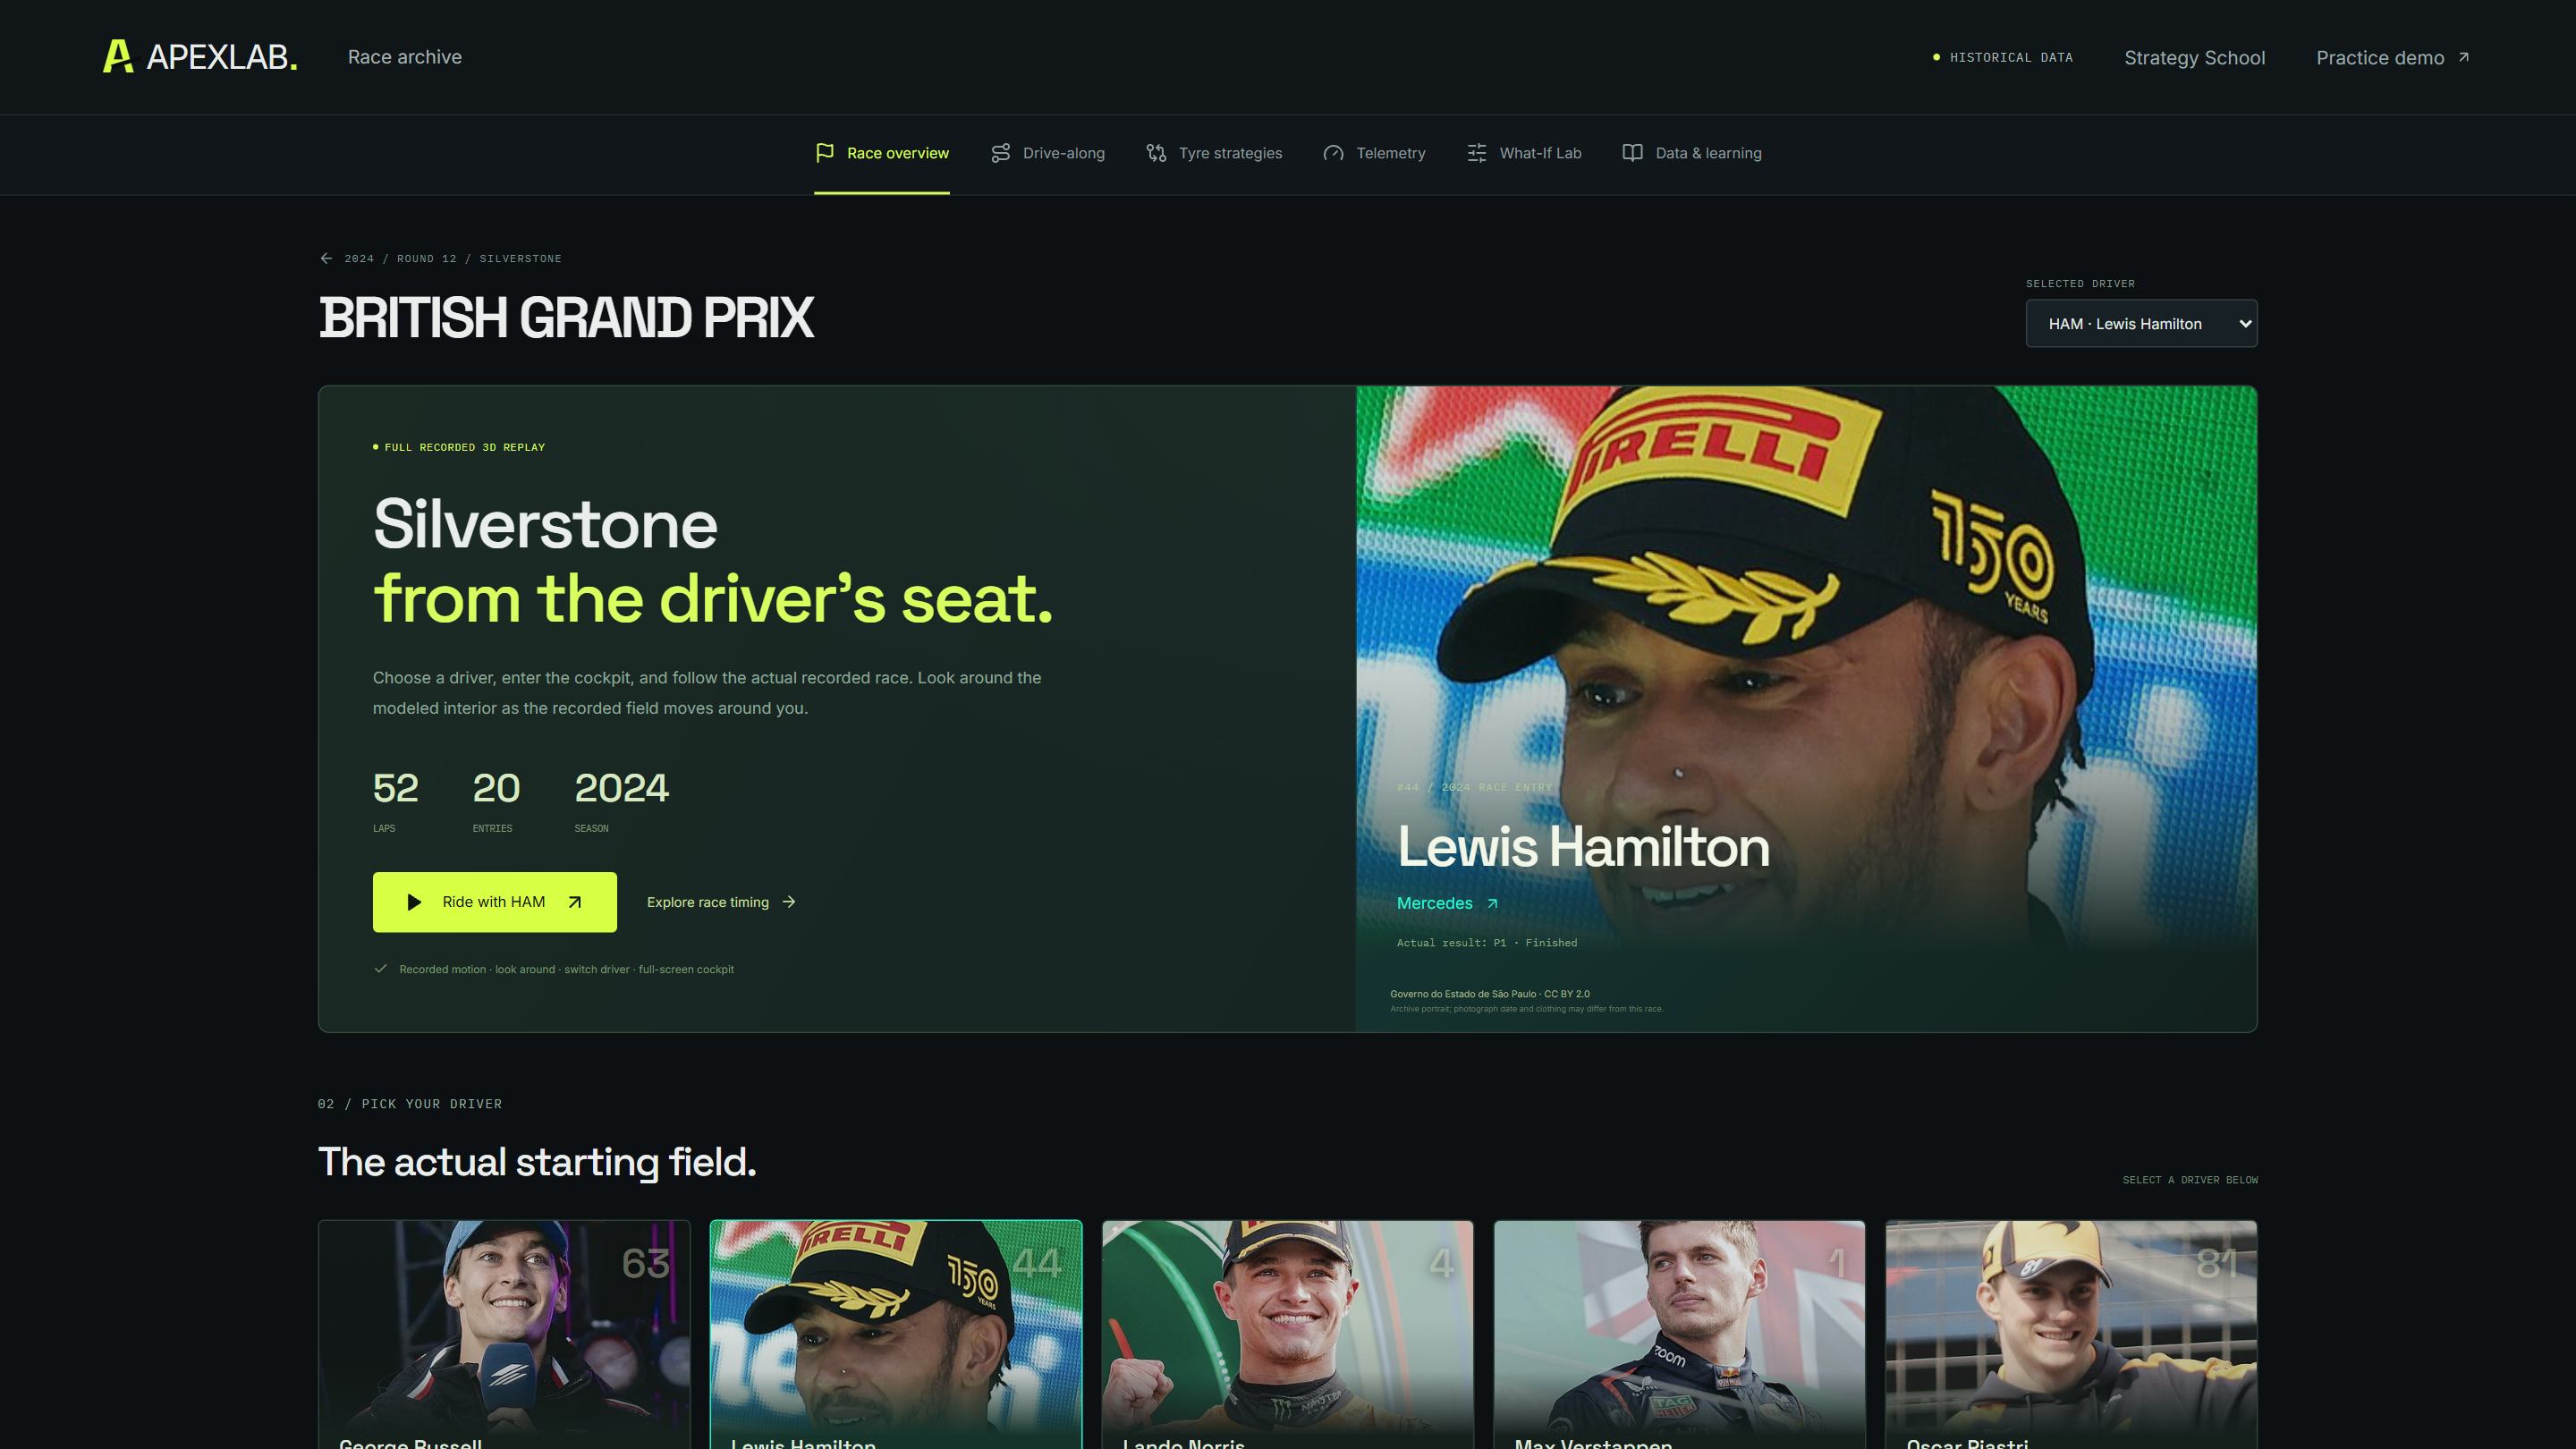
Choose a race
Users can browse an archive of 114 Grands Prix from 2021–2025. Depending on the event's available data, they can explore the actual competitors, teams, starting grid, results, lap timing, tyre stints, and pit stops.
The archive communicates differences in coverage. A race with timing records does not automatically have enough positional information for a detailed 3D replay.
Follow the action from different perspectives
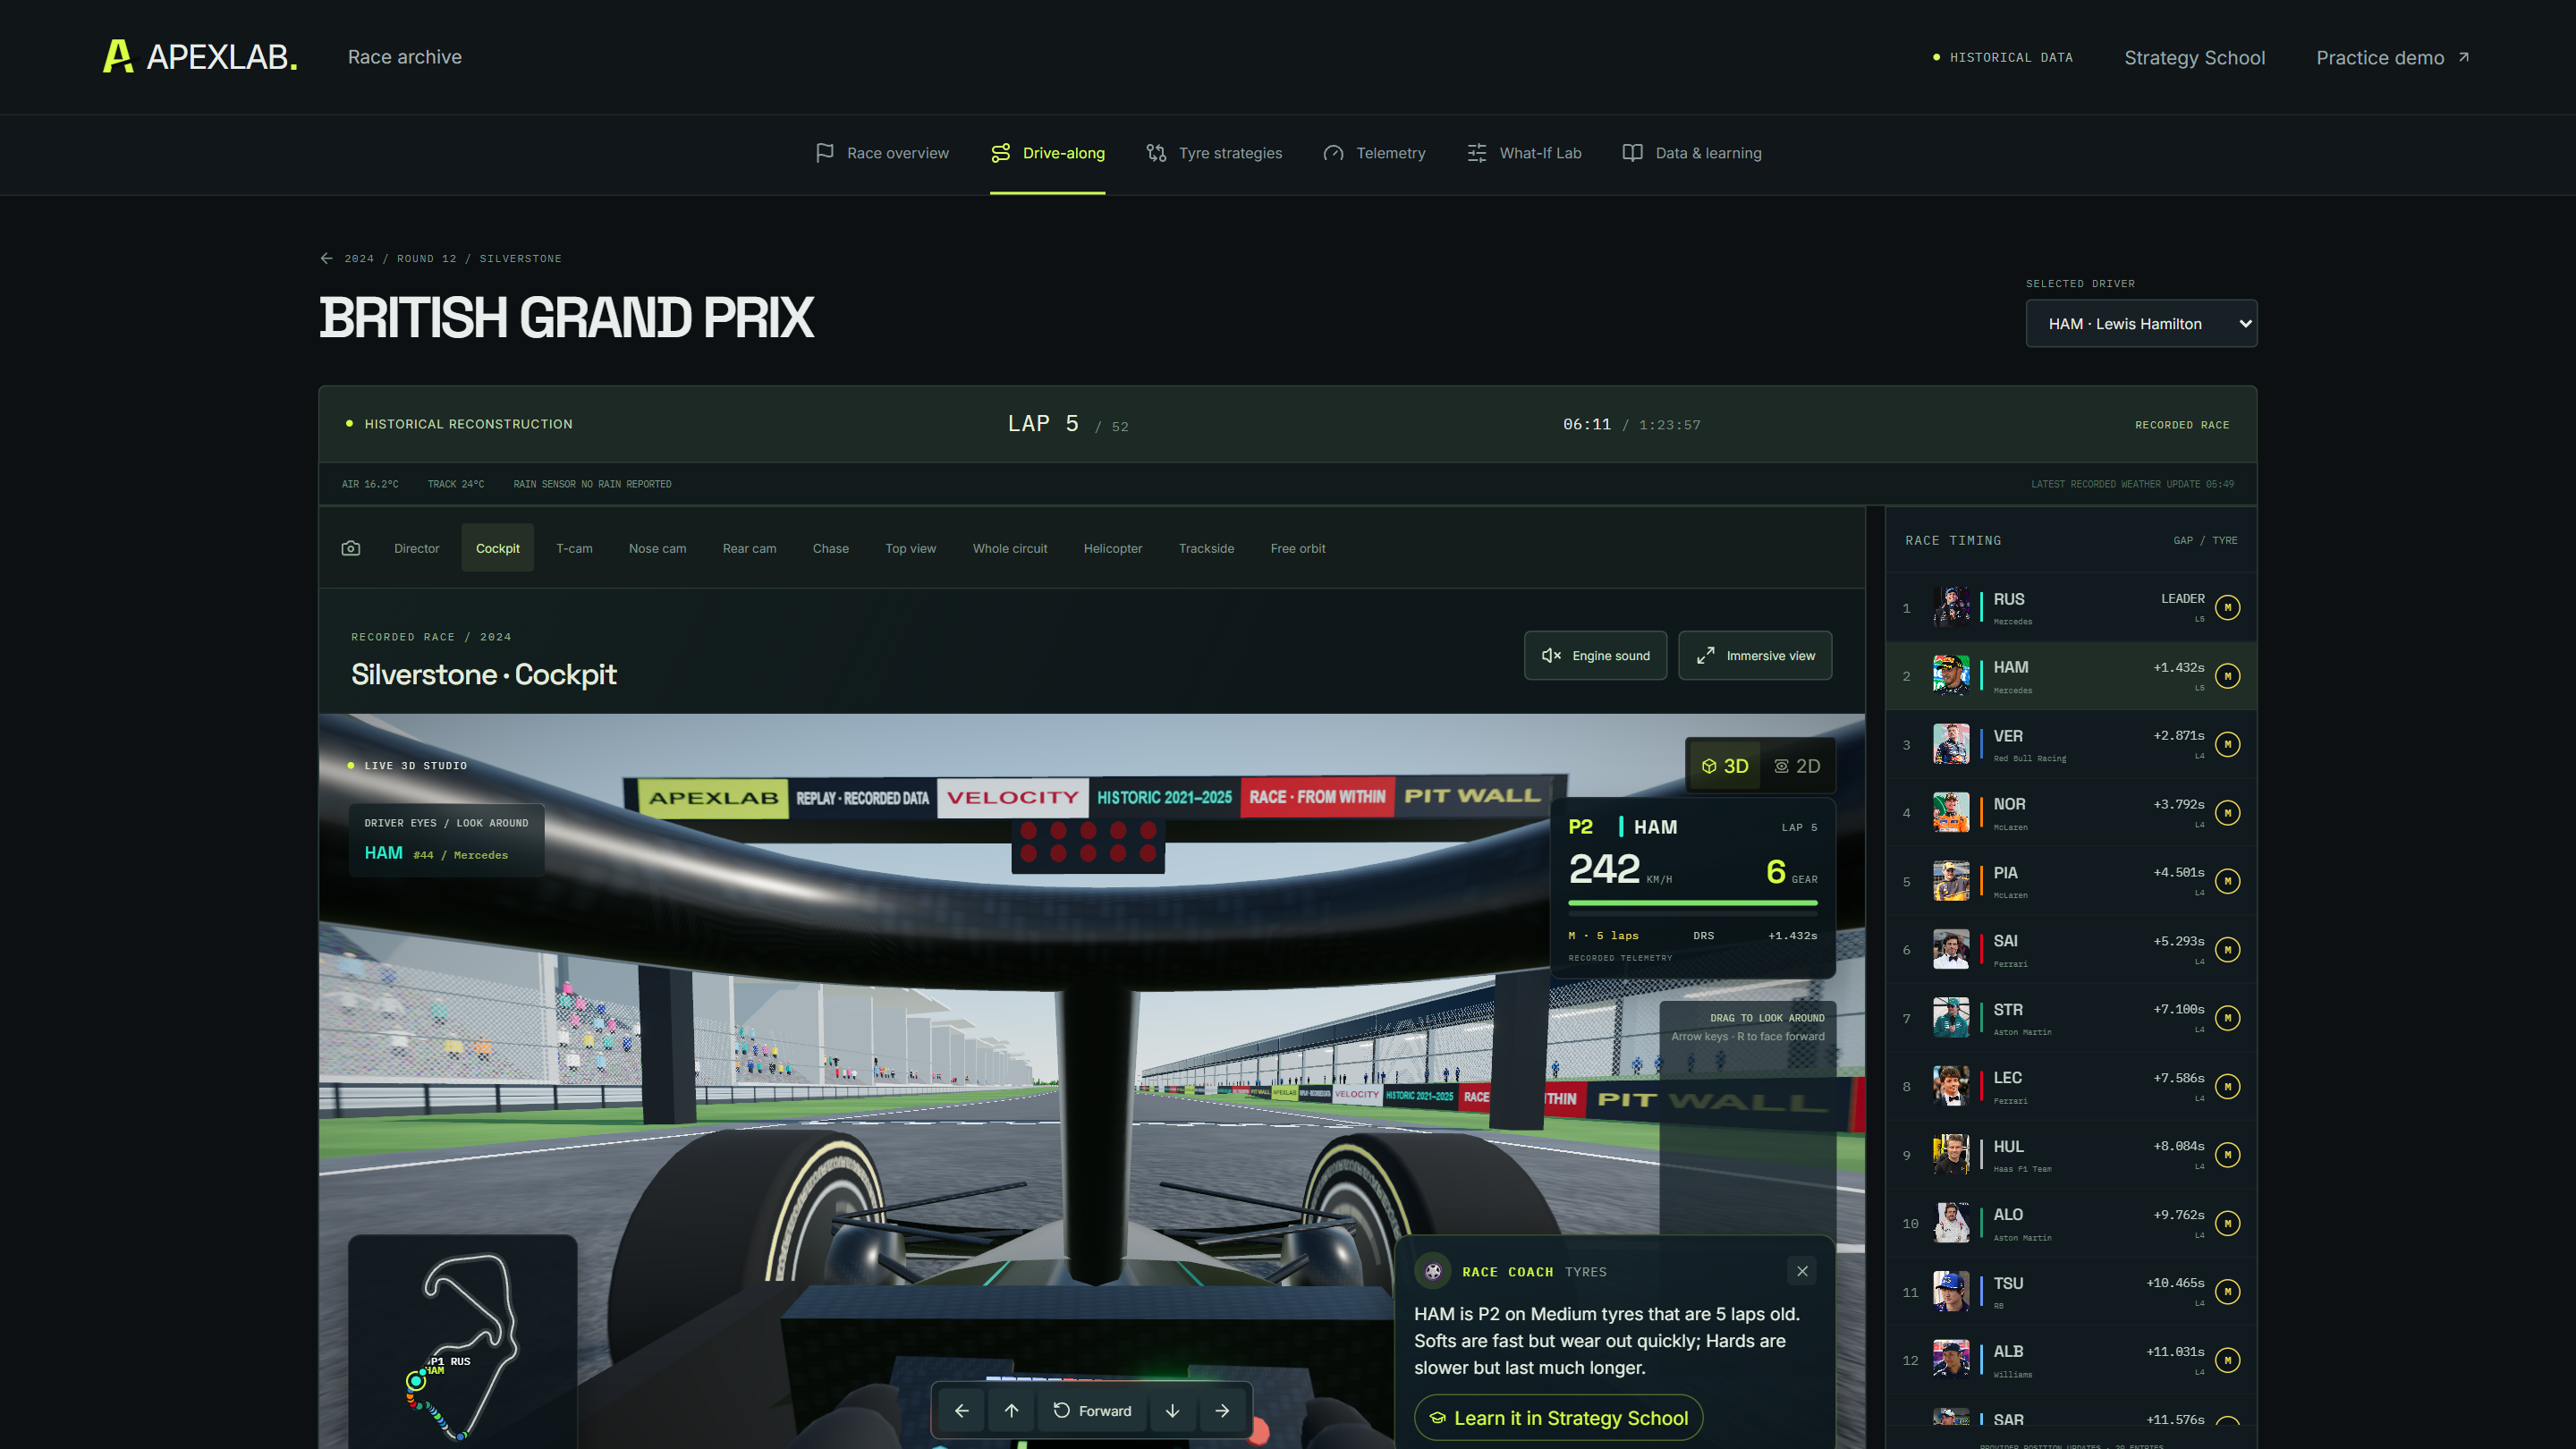
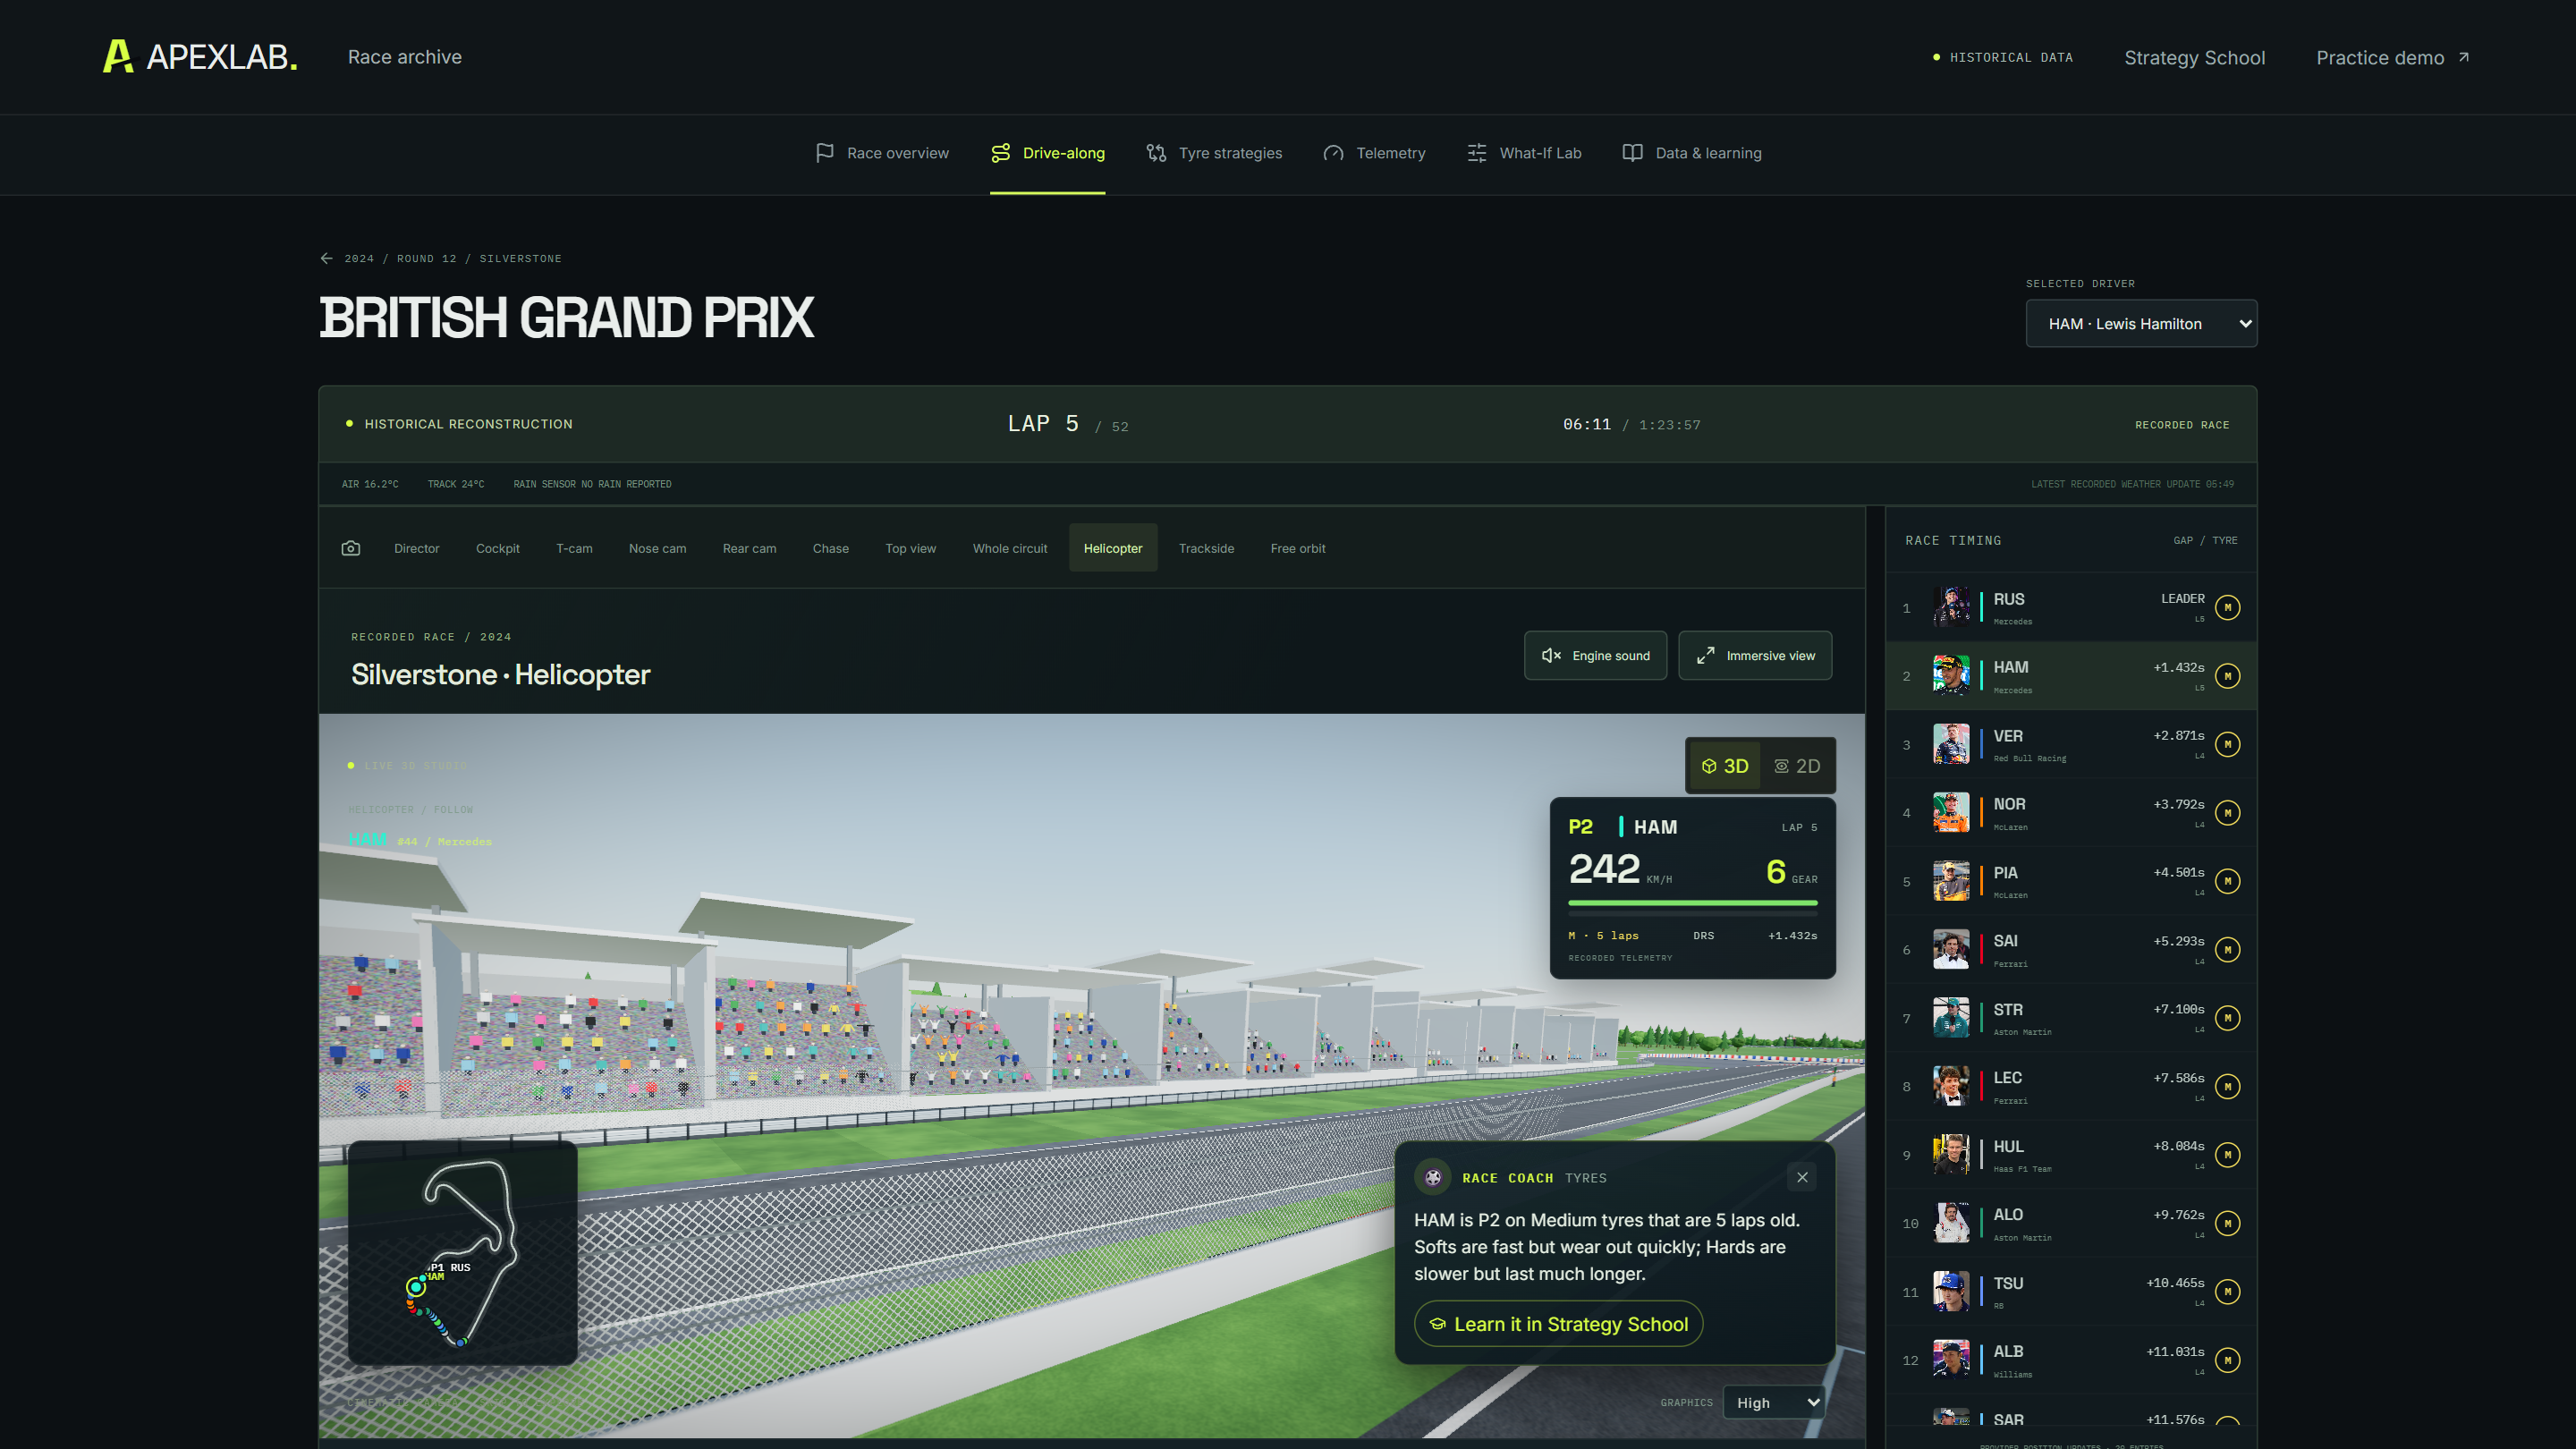
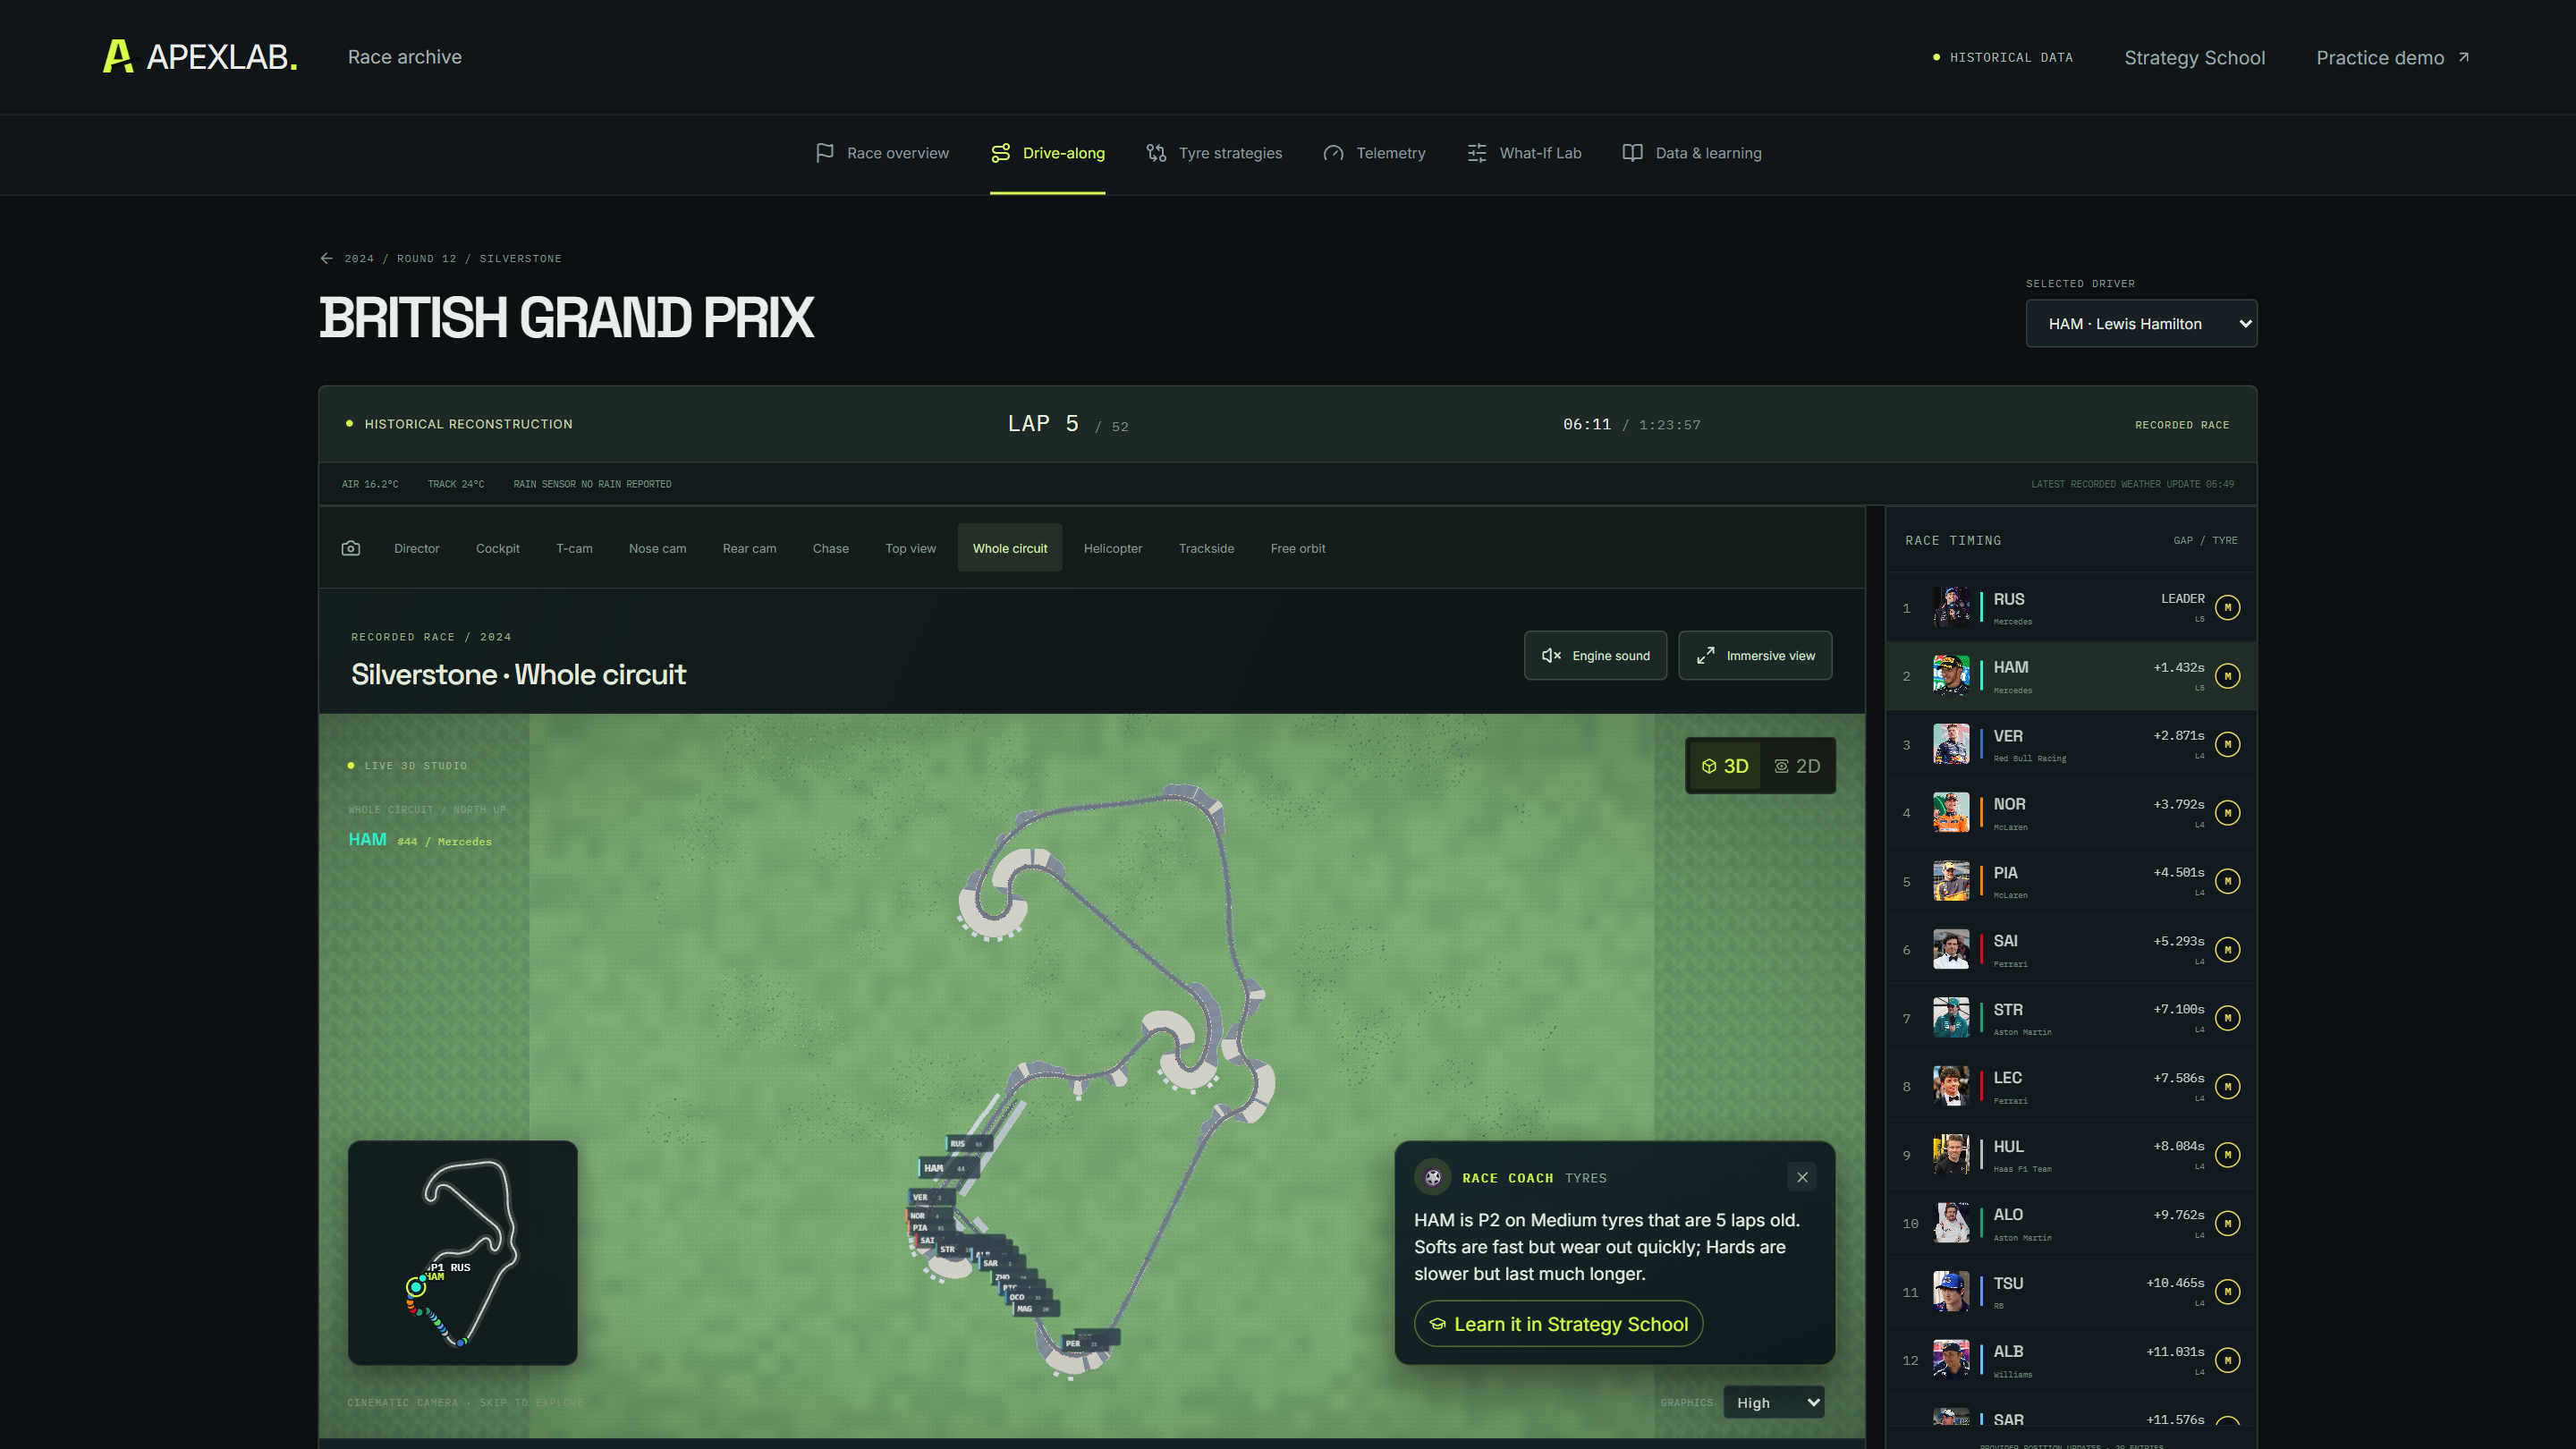
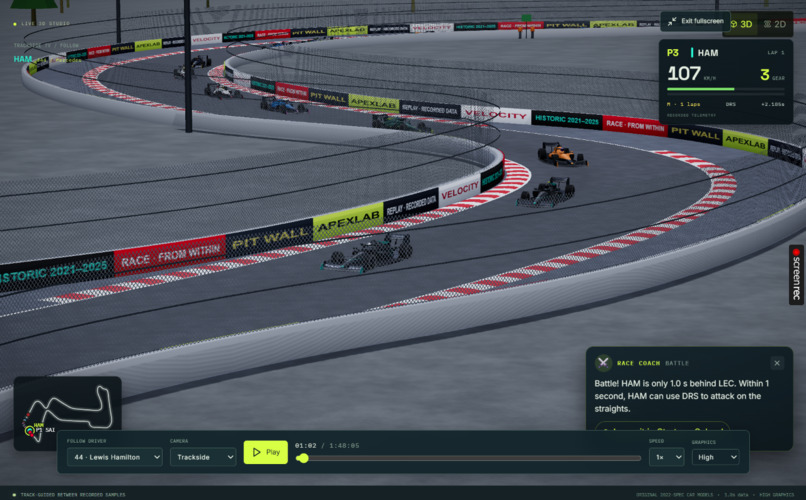
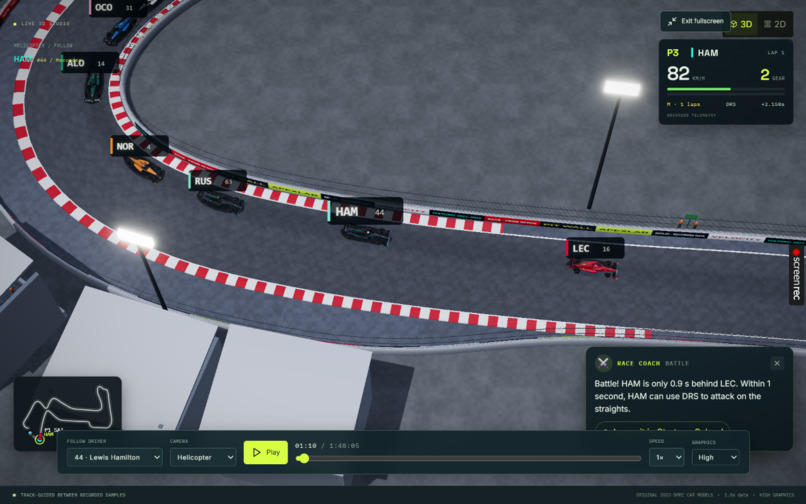
Supported replays let users follow drivers through cockpit-inspired, trackside, helicopter, and whole-circuit views.
Users control the experience with playback, pause, restart, speed adjustment, and timeline navigation. Switching perspectives makes it possible to examine a driver's immediate surroundings and then step back to understand the wider race.
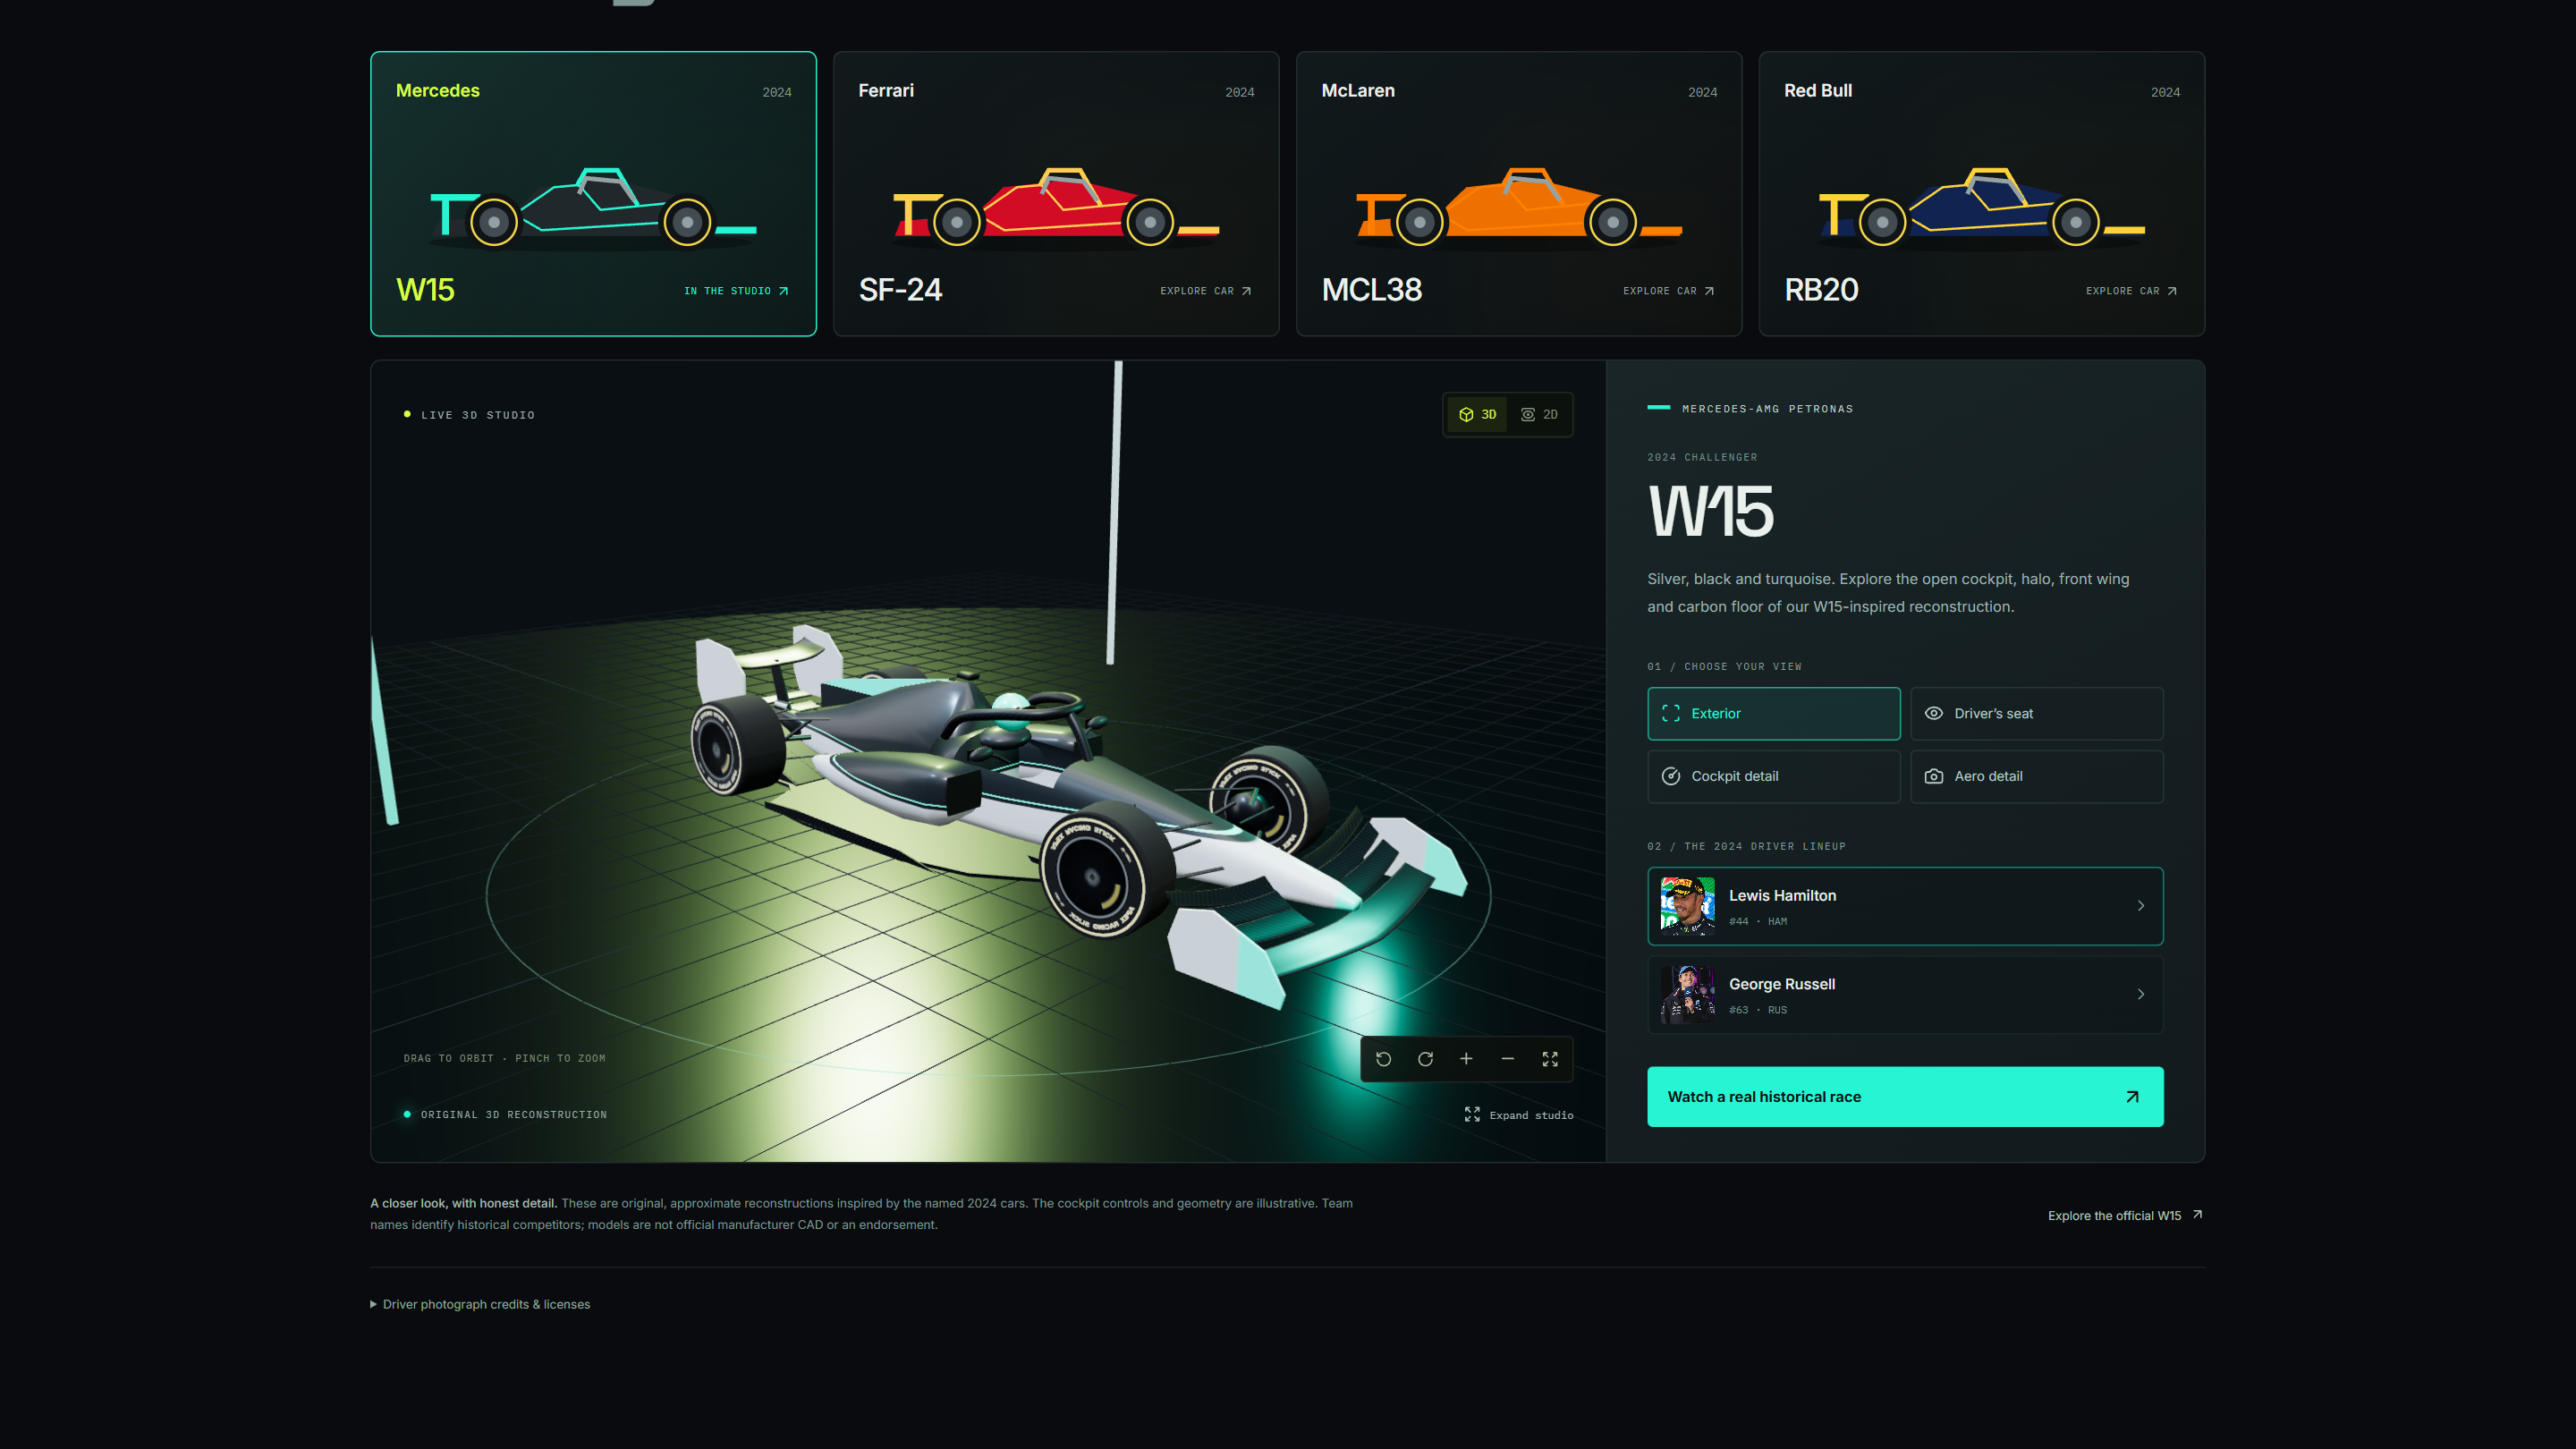
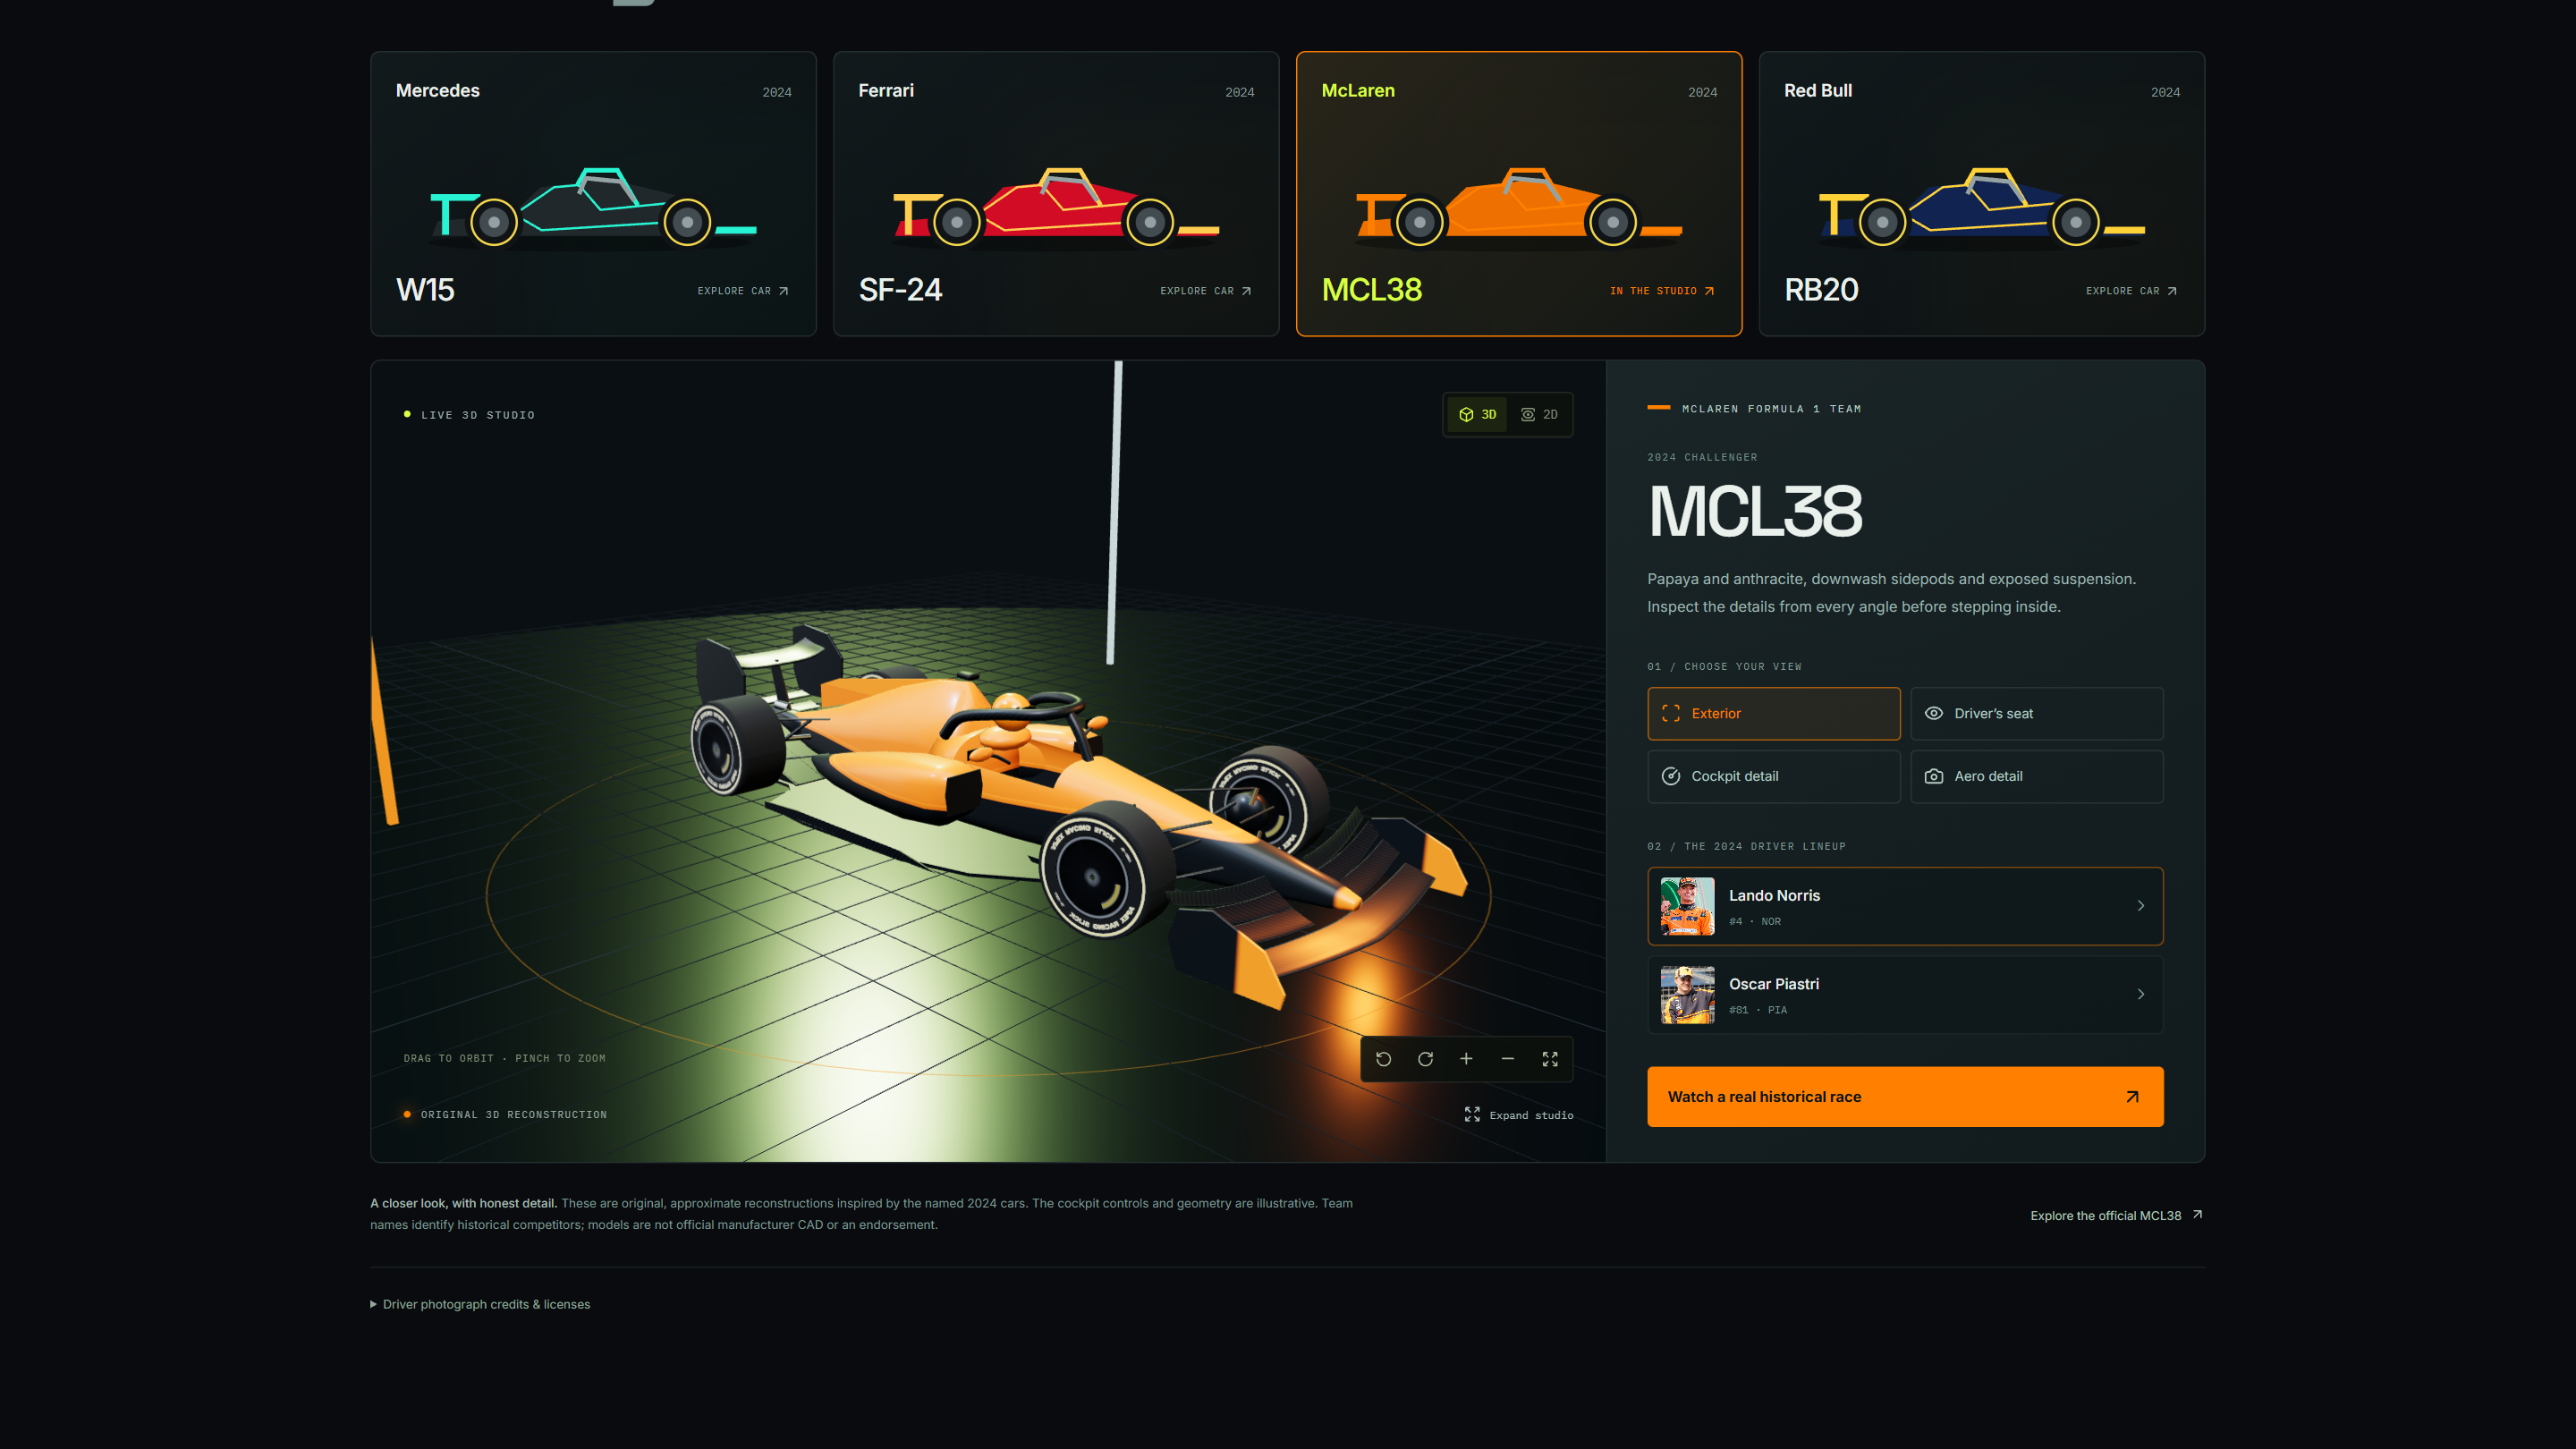
Cars, cockpit interiors, scenery, and pit-crew animations are reconstructed visual elements. They provide context without claiming to be exact digital replicas of the original event.
Read the race alongside the replay
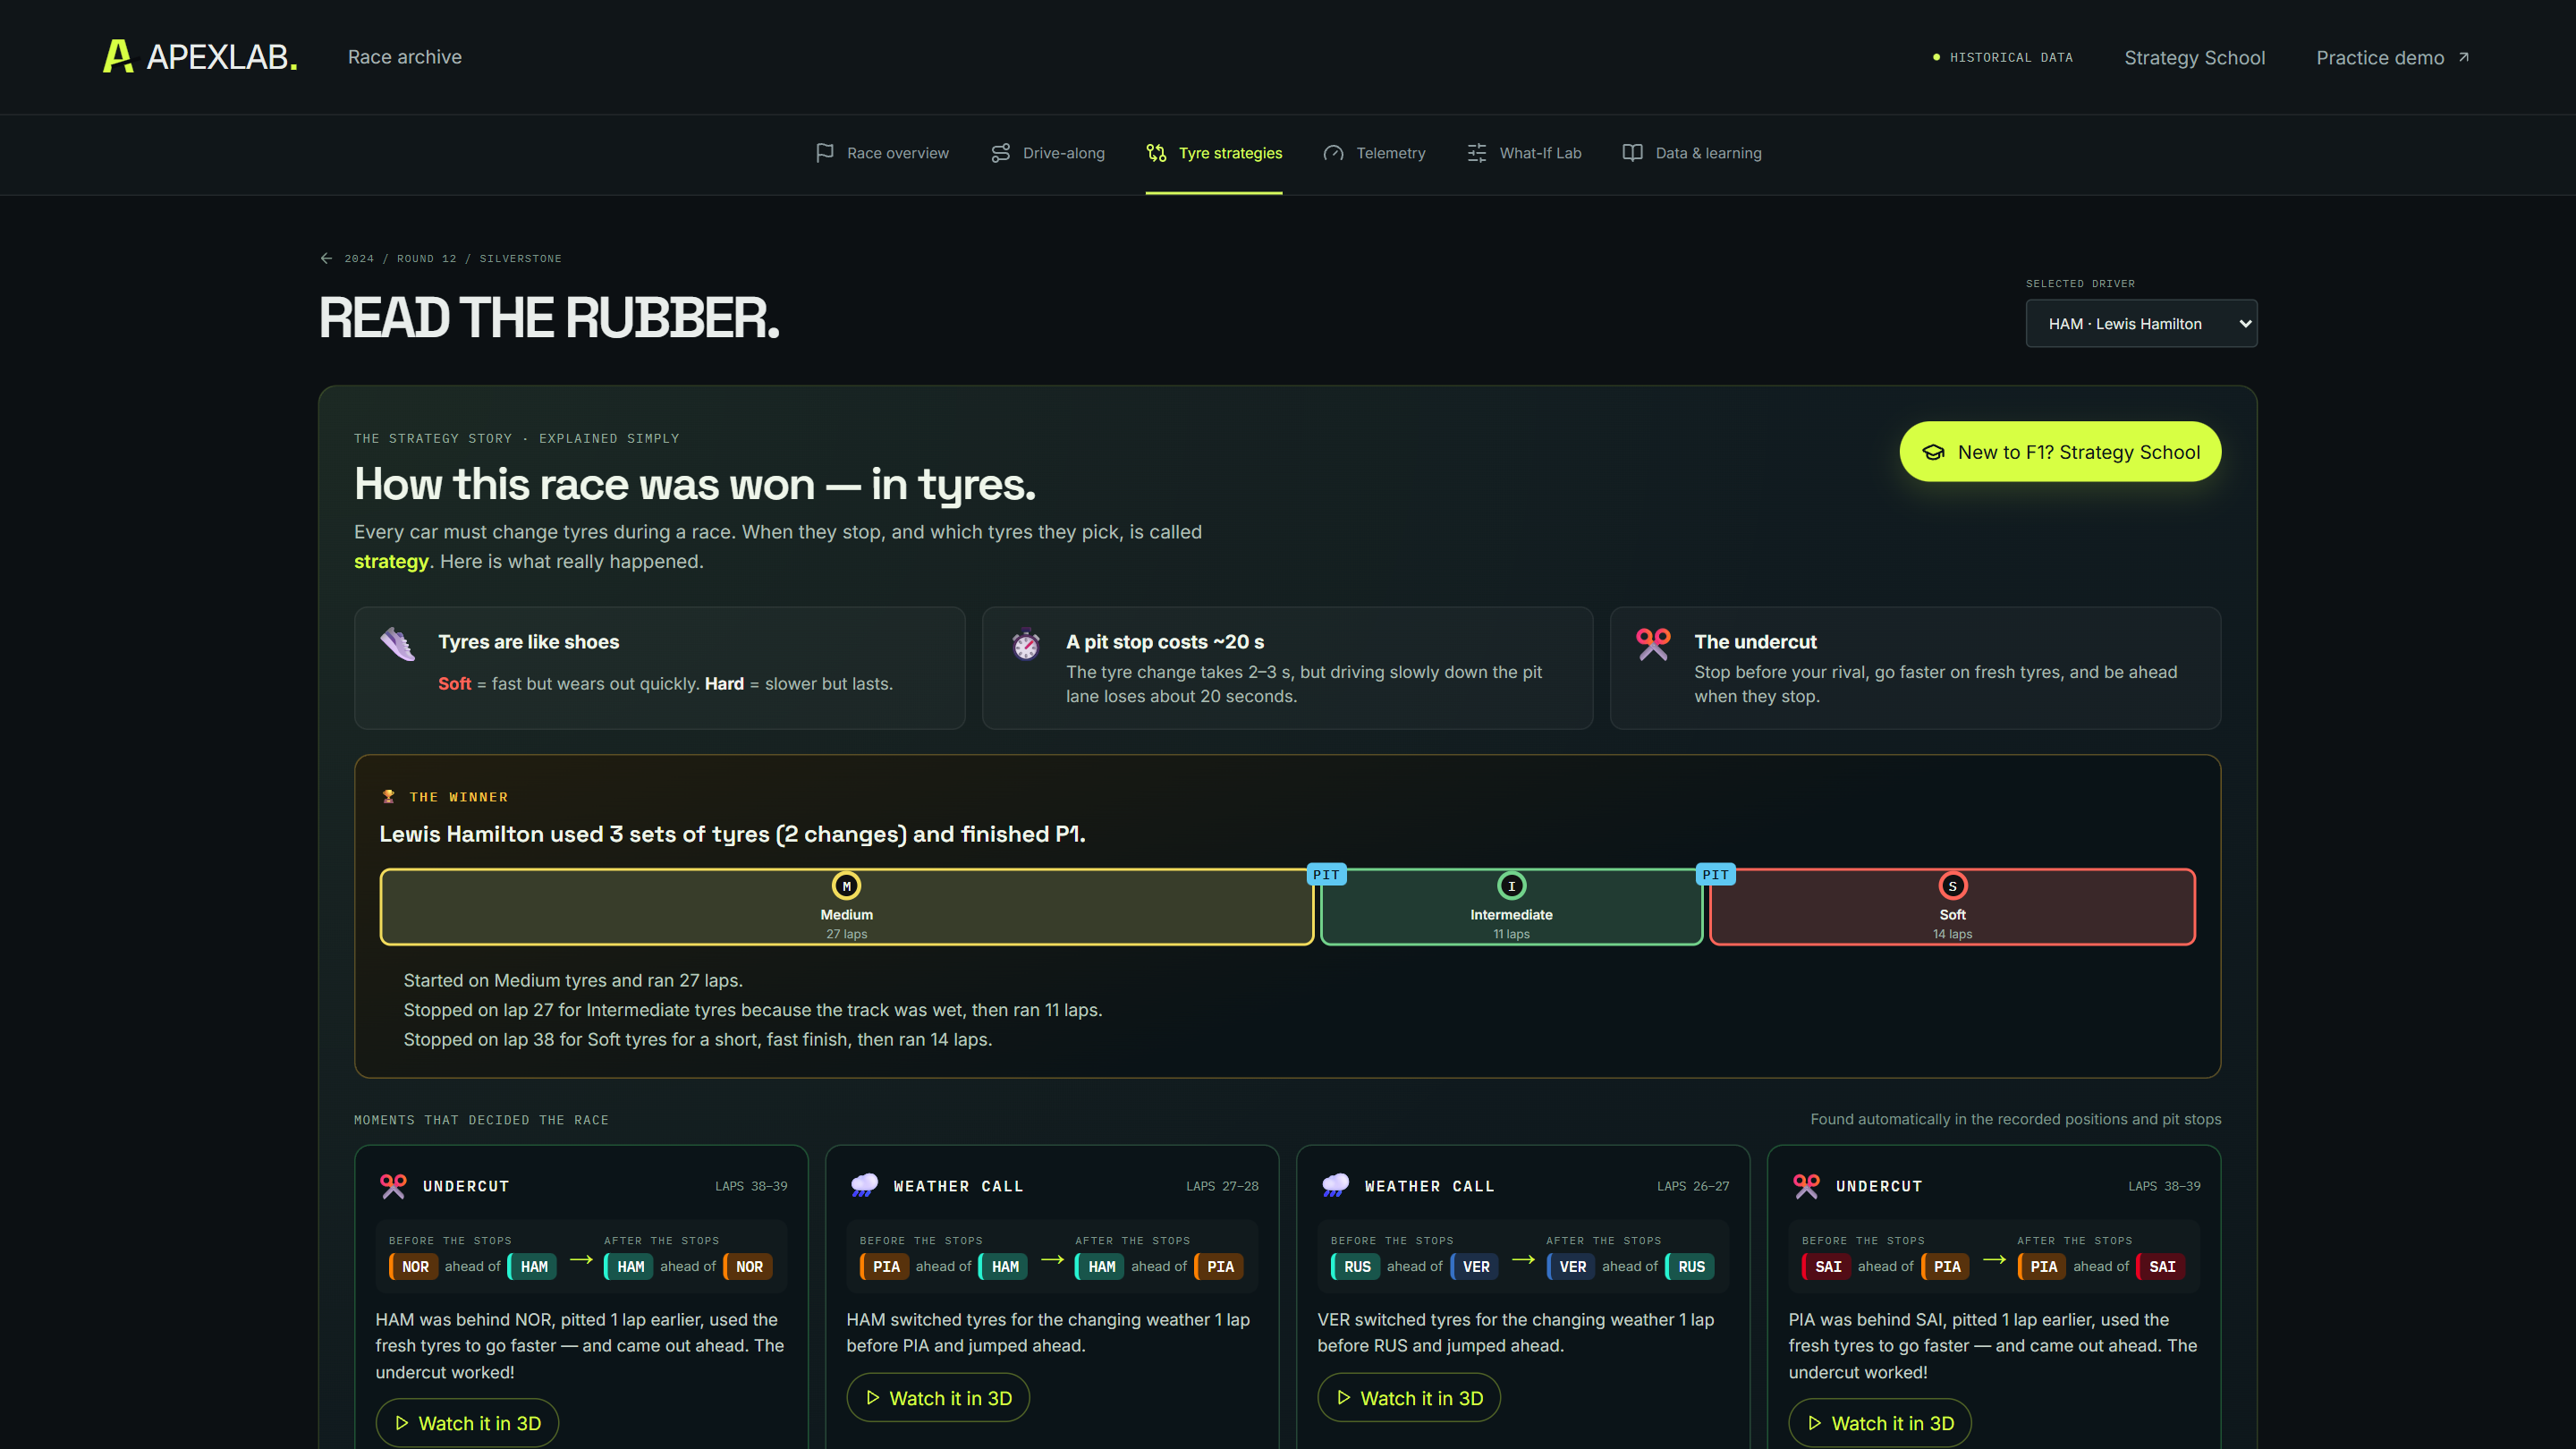
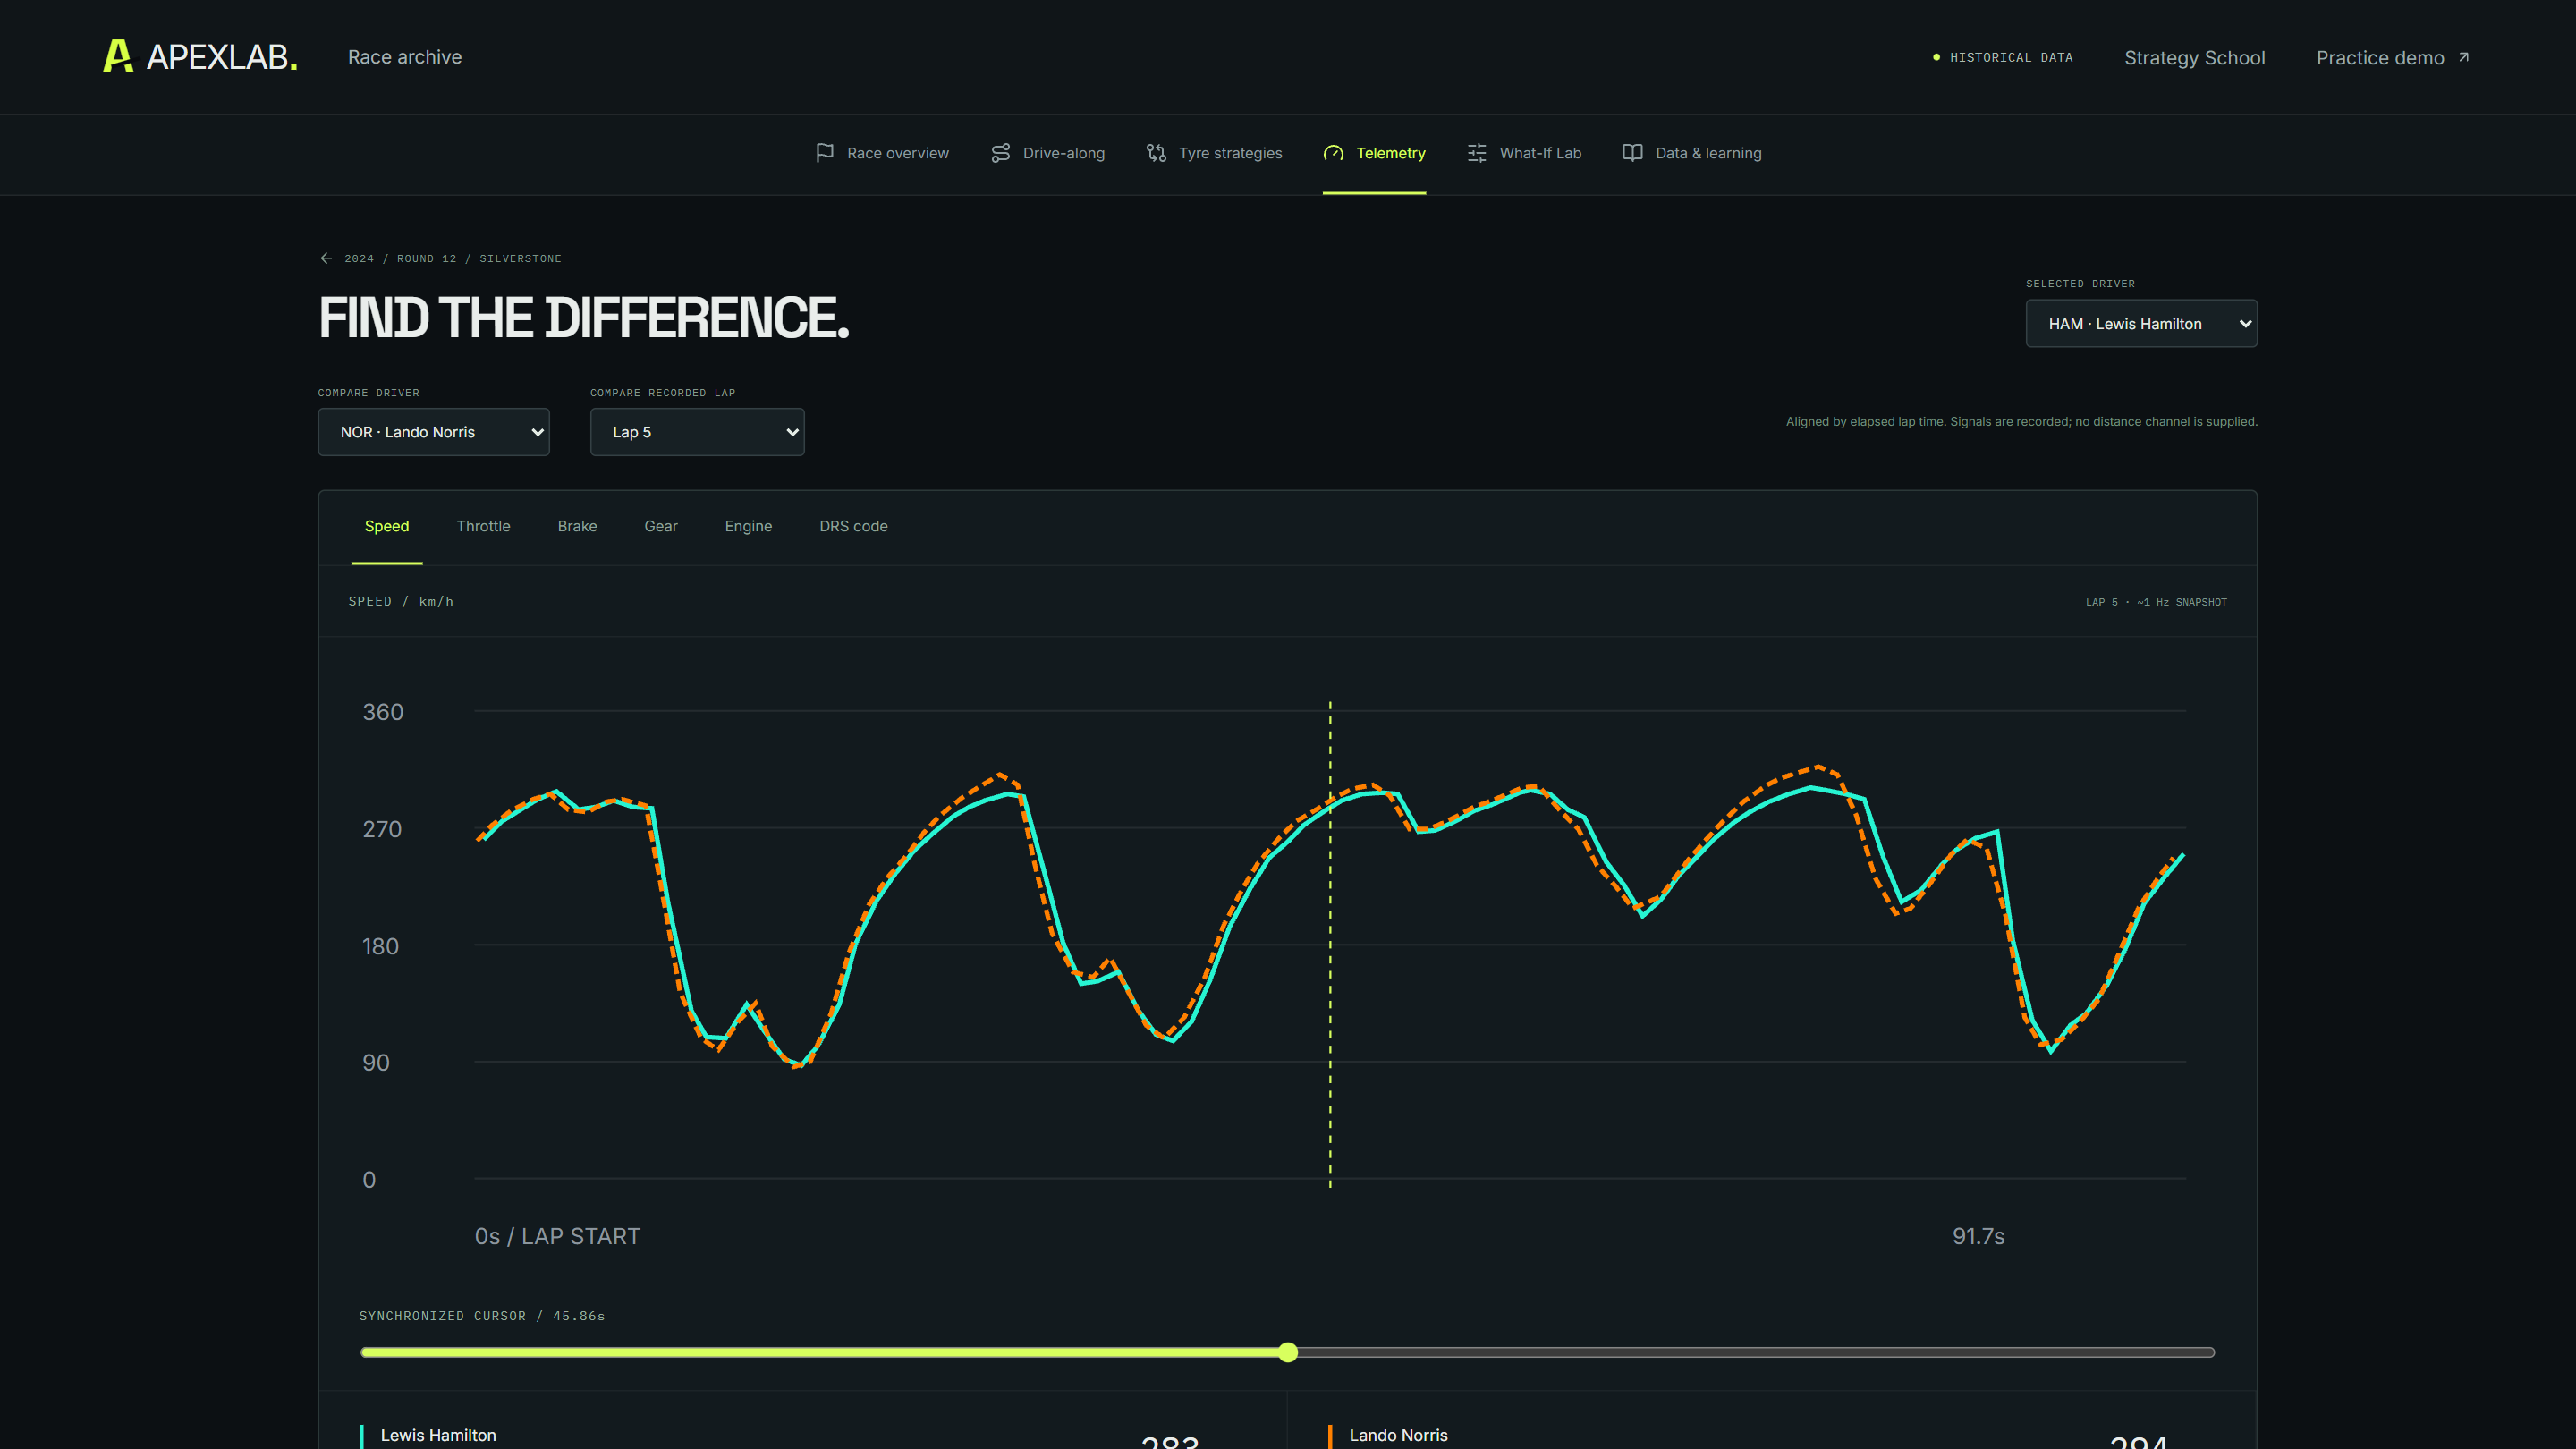
Synchronized panels display available timing and strategy information. Users can examine driver order, gaps, tyre choices, and pit-stop moments while following the timeline.
This connects visual action with evidence: a stop becomes more than an animation when users can inspect the associated tyre change and timing information.
Explore an alternative decision
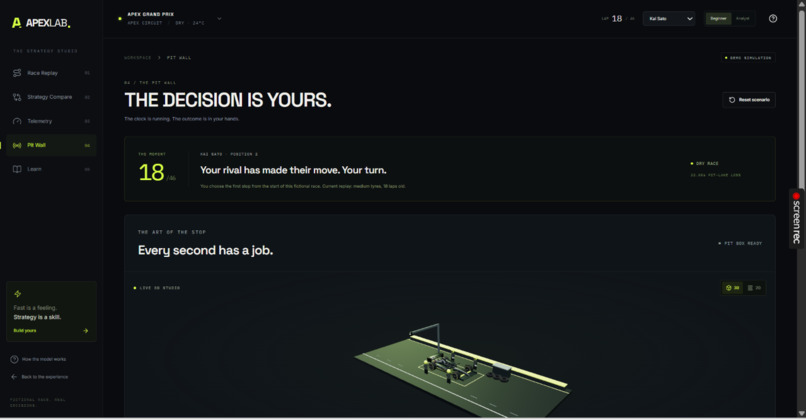
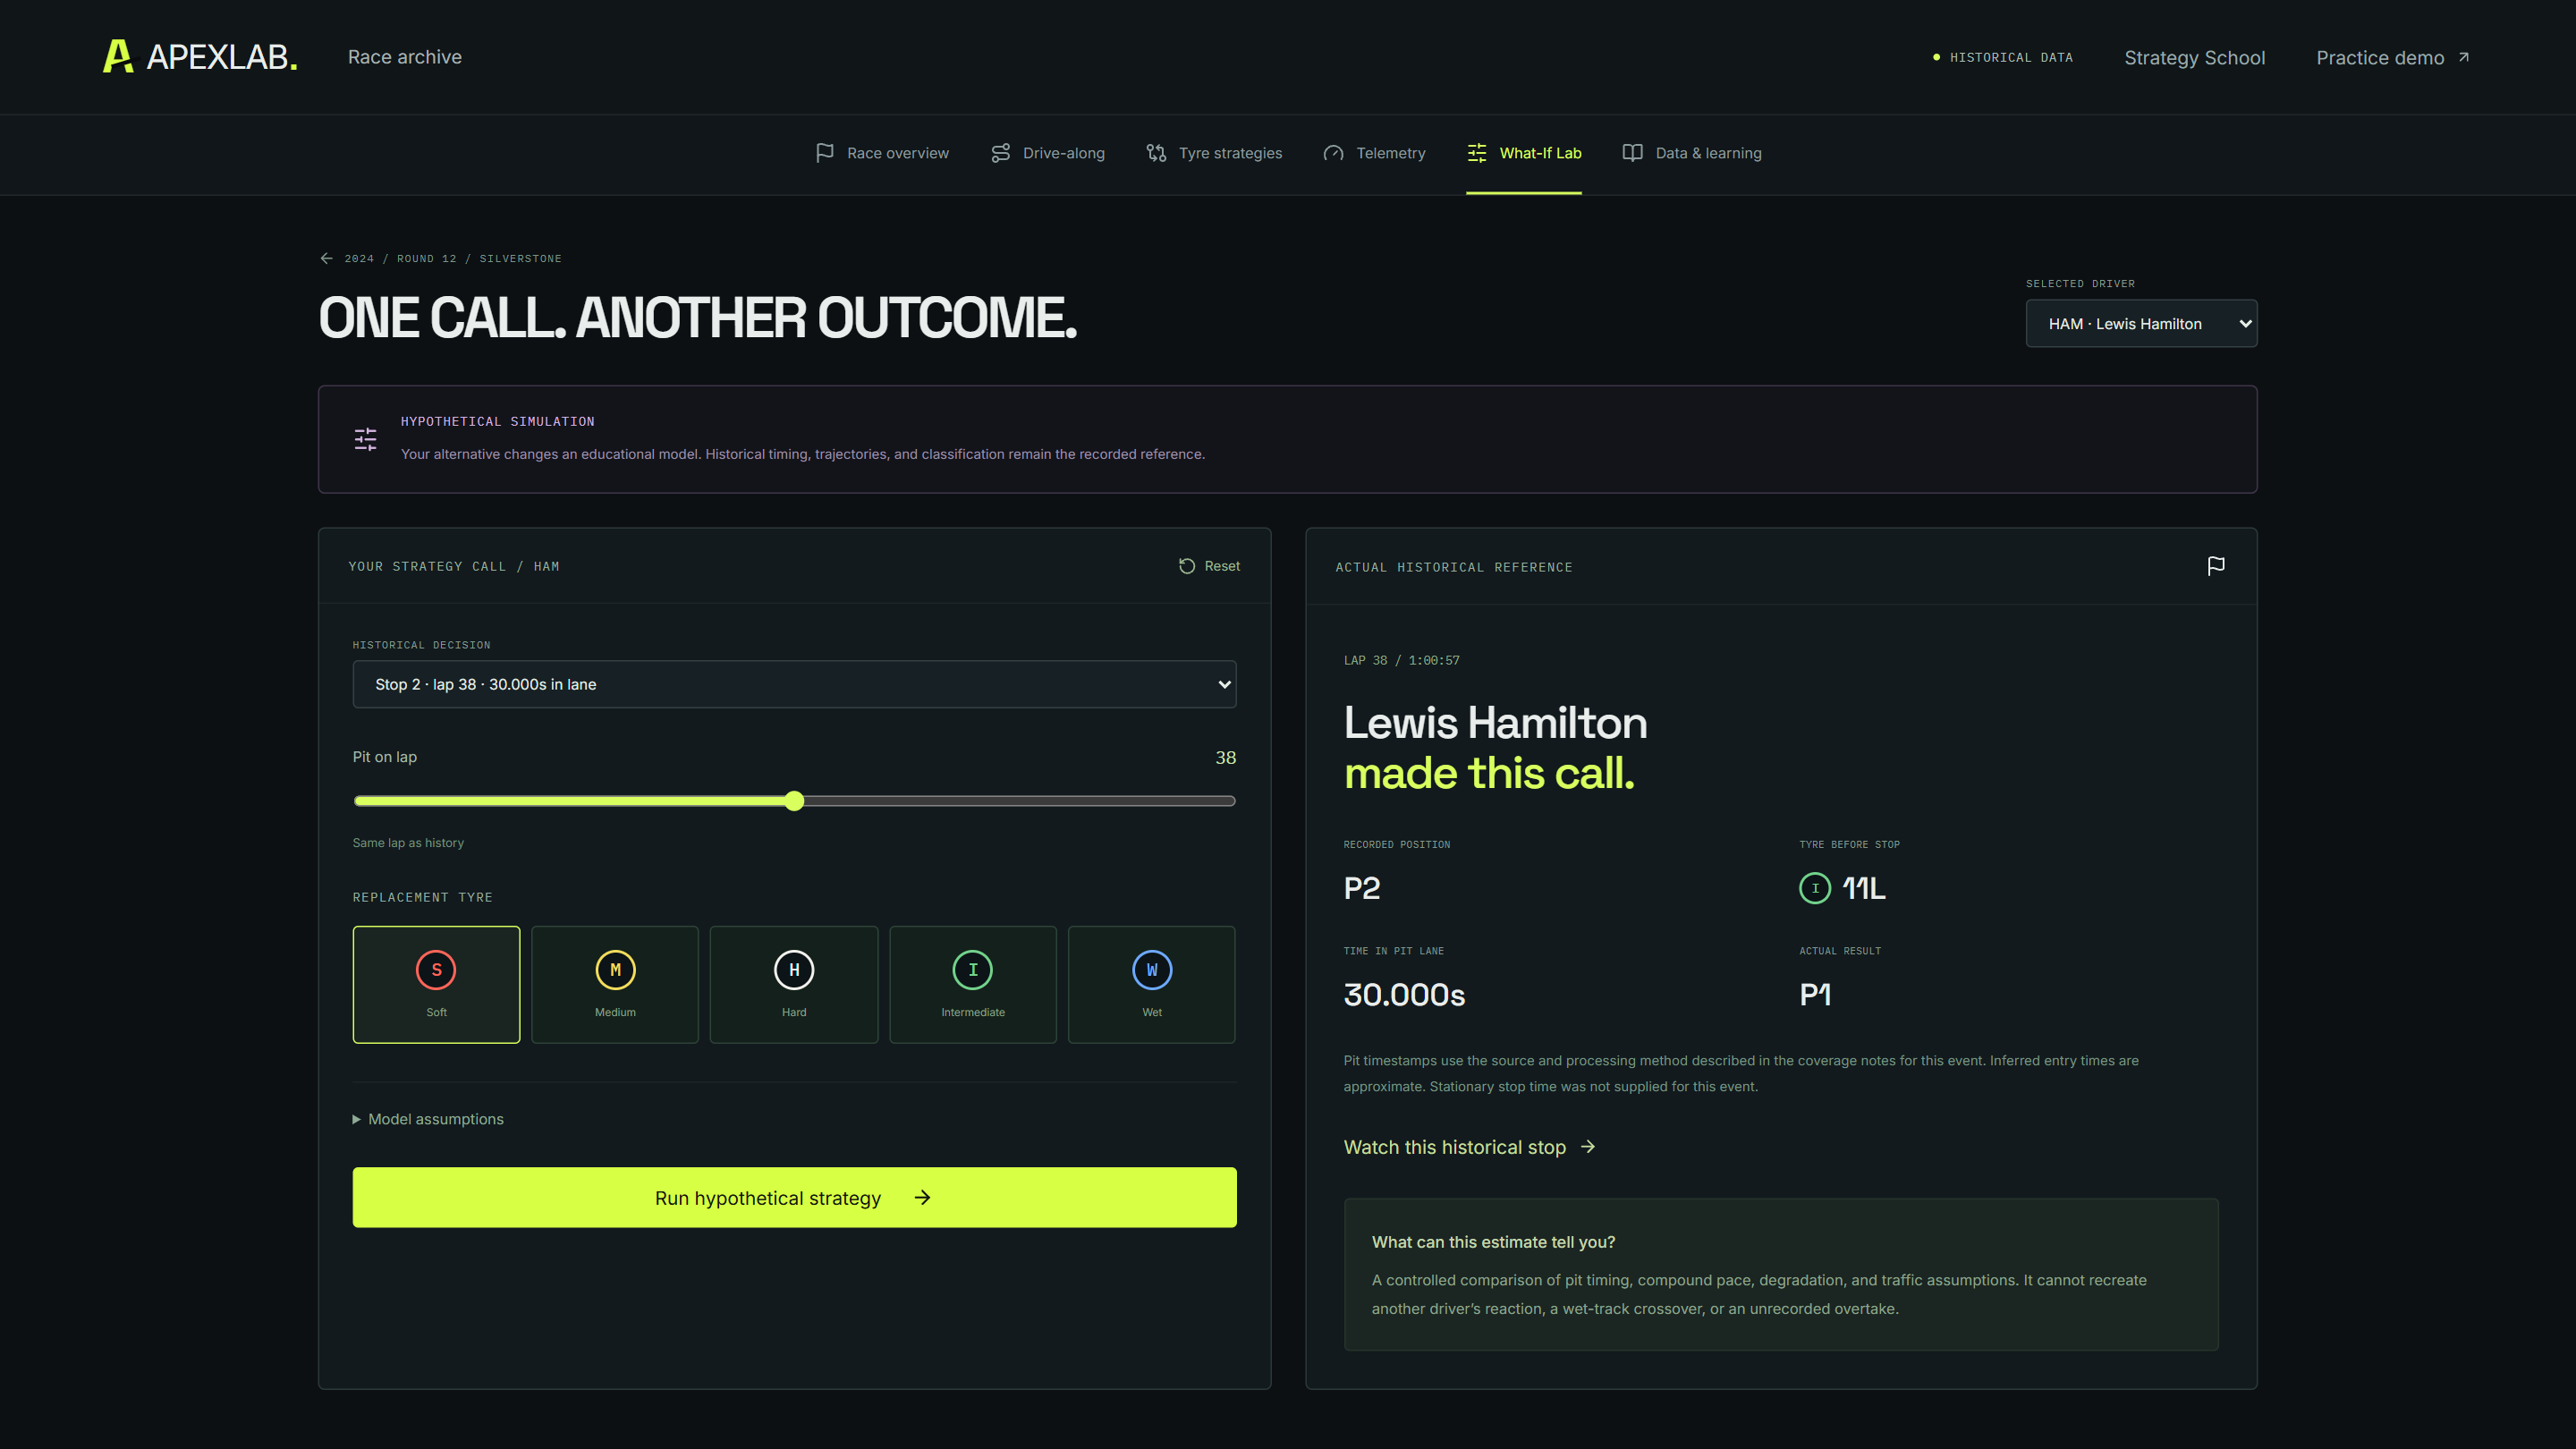
The What-If Lab allows supported changes around an eligible historical pit stop. Users can adjust stop timing, choose a supported dry compound, and change assumptions about wear, net pit loss, and rejoin traffic.
The result is a local hypothetical comparison anchored to the historical baseline. It remains separate from the recorded replay.
Learn the language of strategy
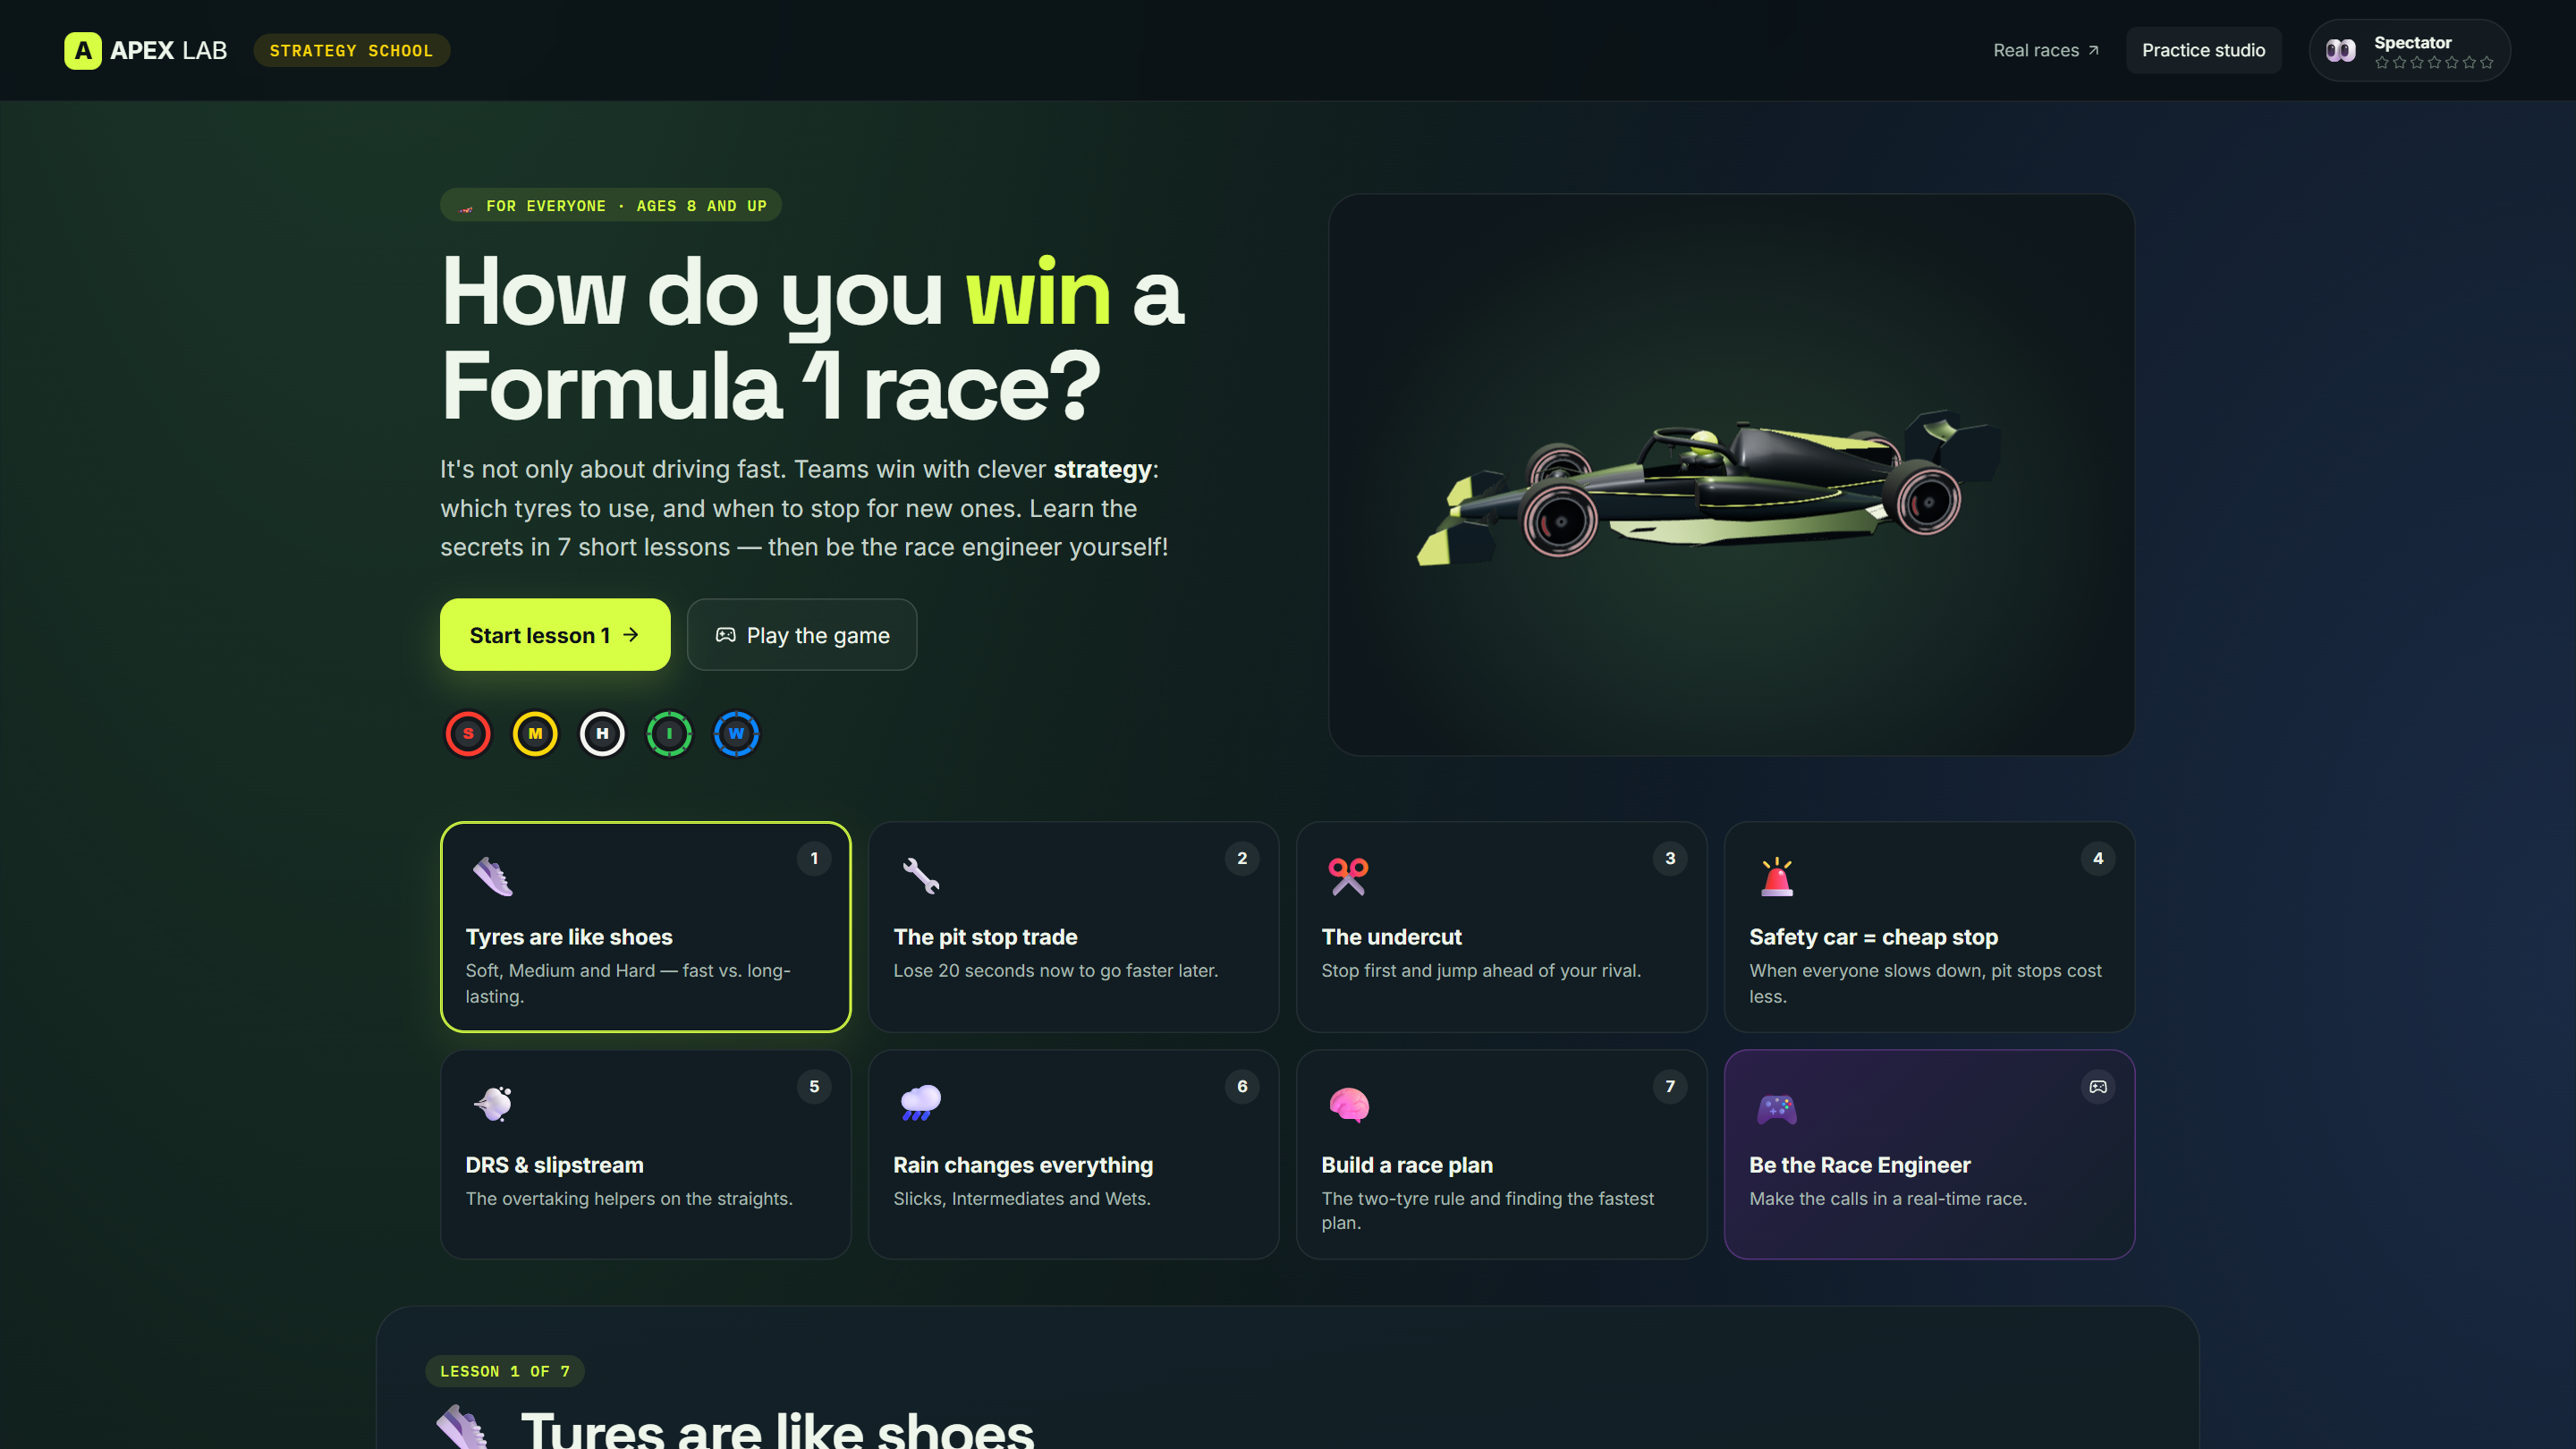
Strategy School explains concepts such as undercuts, overcuts, tyre degradation, and safety-car opportunities through lessons and interactive activities.
It provides a starting point for users who enjoy racing but are unfamiliar with its strategic vocabulary.
How we built it
Interface and visualization
We developed the application with React, TypeScript, and Vite.
Three.js, React Three Fiber, and Drei power the interactive 3D environments, vehicle presentation, lighting, and camera perspectives.
The architecture separates historical data, playback state, rendering, and strategy calculations. That separation helps keep the recorded race consistent as users change views or investigate hypothetical scenarios.
Historical information
The project uses records from Jolpica and OpenF1, according to their availability and usage terms.
Import scripts convert historical records into structured JSON datasets served with the application. Supported events can also request additional positional recordings and car telemetry directly from OpenF1.
The current application does not require a separate custom backend or database. Data loading, replay processing, and scenario calculations run in the browser.
Replay calculations
To estimate a position between valid neighboring samples, the recorded-position sampler uses:
fraction = (replayTime - firstTimestamp) / (secondTimestamp - firstTimestamp)
position = firstPosition + fraction × (secondPosition - firstPosition)
Interpolation is restricted to valid sample intervals. The default maximum gap is three seconds; unsupported intervals are marked instead of filled with invented recorded coordinates.
The visual layer also uses track-guided reconstruction to produce smoother movement around circuit bends. This remains distinguishable from the original positional records.
An orientation estimate comes from the direction between samples:
heading = atan2(changeInY, changeInX)
Selected visual properties use frame-time-based smoothing:
blend = 1 - exp(-responseRate × frameTime)
updatedValue = previousValue + blend × (targetValue - previousValue)
These calculations support visual continuity without changing historical classification or timing records.
Strategy calculations
The historical What-If model estimates an initial wear coefficient from eligible consecutive lap-time differences:
observedChange = currentLapTime - previousLapTime
initialWear = clamp(median(eligibleObservedChanges), 0, 0.300)
When usable observations are unavailable, it uses an explicit fallback of 0.050 seconds per additional tyre-age lap.
Compound offsets are calibrated from eligible observations matched by race lap. For a supported dry compound, the simplified pace contribution is:
tyreContribution = compoundOffset + wearRate × max(0, tyreAge - 1)
The scenario compares candidate and baseline contributions:
paceChange = candidateContribution - baselineContribution
Pit-stop accounting uses an explicit baseline net-loss assumption of 22 seconds, rather than treating recorded pit-lane duration as net race-time loss.
For each lap:
lapChange = paceChange + pitCostChange + assumedTrafficPenalty
The final estimate is:
totalChange = sum(allLapChanges)
estimatedRaceTime = recordedClassificationTime + totalChange
A negative total change indicates a faster result under the selected assumptions. A positive value indicates a slower result.
This is a deterministic local comparison. Other drivers retain their historical times, and the model does not simulate their reactions, overtaking, or a complete alternative race.
Release pipeline
The application is hosted on Microsoft Azure Static Web Apps.
GitHub Actions installs dependencies, runs tests, builds the production version, and deploys successful updates. The deployed release passed 75 automated tests, followed by live checks of routing, race-data access, and 3D rendering.
Challenges we ran into
Different datasets tell different parts of the story
Results, lap timing, pit records, and positional samples do not always share the same completeness or precision. Combining them required careful handling of timestamps, missing values, and source coverage.
We avoided treating a complete results table as proof that a complete spatial replay was available.
Smooth visuals can suggest false precision
An animated car can look exact even when its underlying samples are approximate. We needed to make reconstruction useful without allowing presentation quality to obscure data limitations.
This influenced our interpolation limits, source notes, and distinctions between recorded information and rendered movement.
Close camera views expose small problems
Cockpit-inspired perspectives made car overlap, clipping, and visibility issues more noticeable. We worked on camera behavior and presentation adjustments to improve the experience.
Those adjustments support readability; they do not establish exact historical lateral placement or collision physics.
Rich scenes must remain responsive
Rendering a field of cars, circuit scenery, overlays, and animated pit crews creates competing demands on the browser.
We balanced detail with performance through reusable visual structures and efficient updates.
A strategy result needs an explanation
A number alone does not explain whether a decision was sensible. We needed to show which assumptions contributed to a result and keep the hypothetical calculation separate from history.
Observed lap-time changes also include factors beyond tyre wear, making clear labeling essential.
Accomplishments that we're proud of
We turned separate racing records and visualization tools into a connected application that users can explore at their own pace.
Our key accomplishments include:
- An organized five-season archive containing 114 Grands Prix.
- Interactive 3D replay for supported positional datasets.
- Multiple camera perspectives for examining individual drivers and the wider field.
- Timing and strategy information connected to playback.
- A What-If Lab with reproducible calculations and explicit assumptions.
- Educational content that makes racing strategy more approachable.
- Automated testing and deployment to Microsoft Azure.
We are particularly proud of giving users a path from observation to understanding: inspect a moment, examine its context, and explore a nearby alternative.
What we learned
The project taught us that replay systems need a shared understanding of time. Car presentation, timing panels, race events, and user controls must remain aligned as playback moves forward or jumps to another moment.
We learned to treat data quality as part of the interface. Missing records, approximate coordinates, and reconstructed scenery affect what users can reasonably conclude, so those distinctions need to be visible.
Strategy modeling also sharpened our understanding of assumptions. A measured lap-time trend is influenced by several factors, and a recorded pit-lane duration is different from net time lost against a car staying on track.
We found that accessible explanations improve technical features. Users gain more from a comparison when they understand its inputs, scope, and limitations.
Finally, a repeatable test-and-deploy process helped us improve the application while maintaining confidence in the release.
What's next for GridLens — 3D Race Replay & Strategy Studio
More detailed race environments
We want to improve circuit geometry, vehicle assets, cockpit presentation, and camera transitions while keeping playback responsive.
Clearer coverage before playback
We plan to make each event's data capabilities easier to inspect, including whether it supports positional replay, telemetry, tyre information, and detailed timing.
Better uncertainty analysis
The next step for strategy exploration is to show how results vary across plausible assumptions.
Circuit-specific pit-loss estimates and sensitivity comparisons would help users understand which inputs matter most and how stable a conclusion is.
Lessons connected to real examples
We want to connect educational concepts directly to historical moments, allowing users to move from an explanation of an undercut to a recorded example.
A more accessible experience
Future improvements include keyboard navigation, reduced-motion options, clearer smaller-screen layouts, and controls that work well for users with different levels of motorsport knowledge.
GridLens aims to make historical racing something users can investigate: an experience that combines visual exploration with understandable evidence and transparent calculations.
Links
The current implementation is published under its original name, ApexLab.

Log in or sign up for Devpost to join the conversation.