-
-
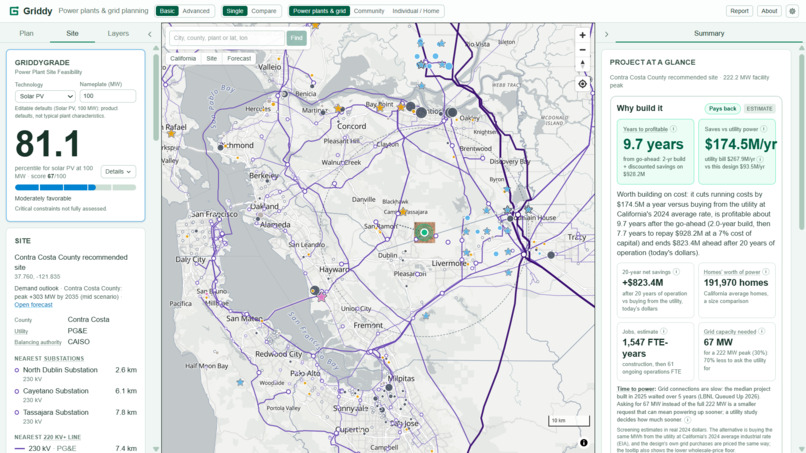
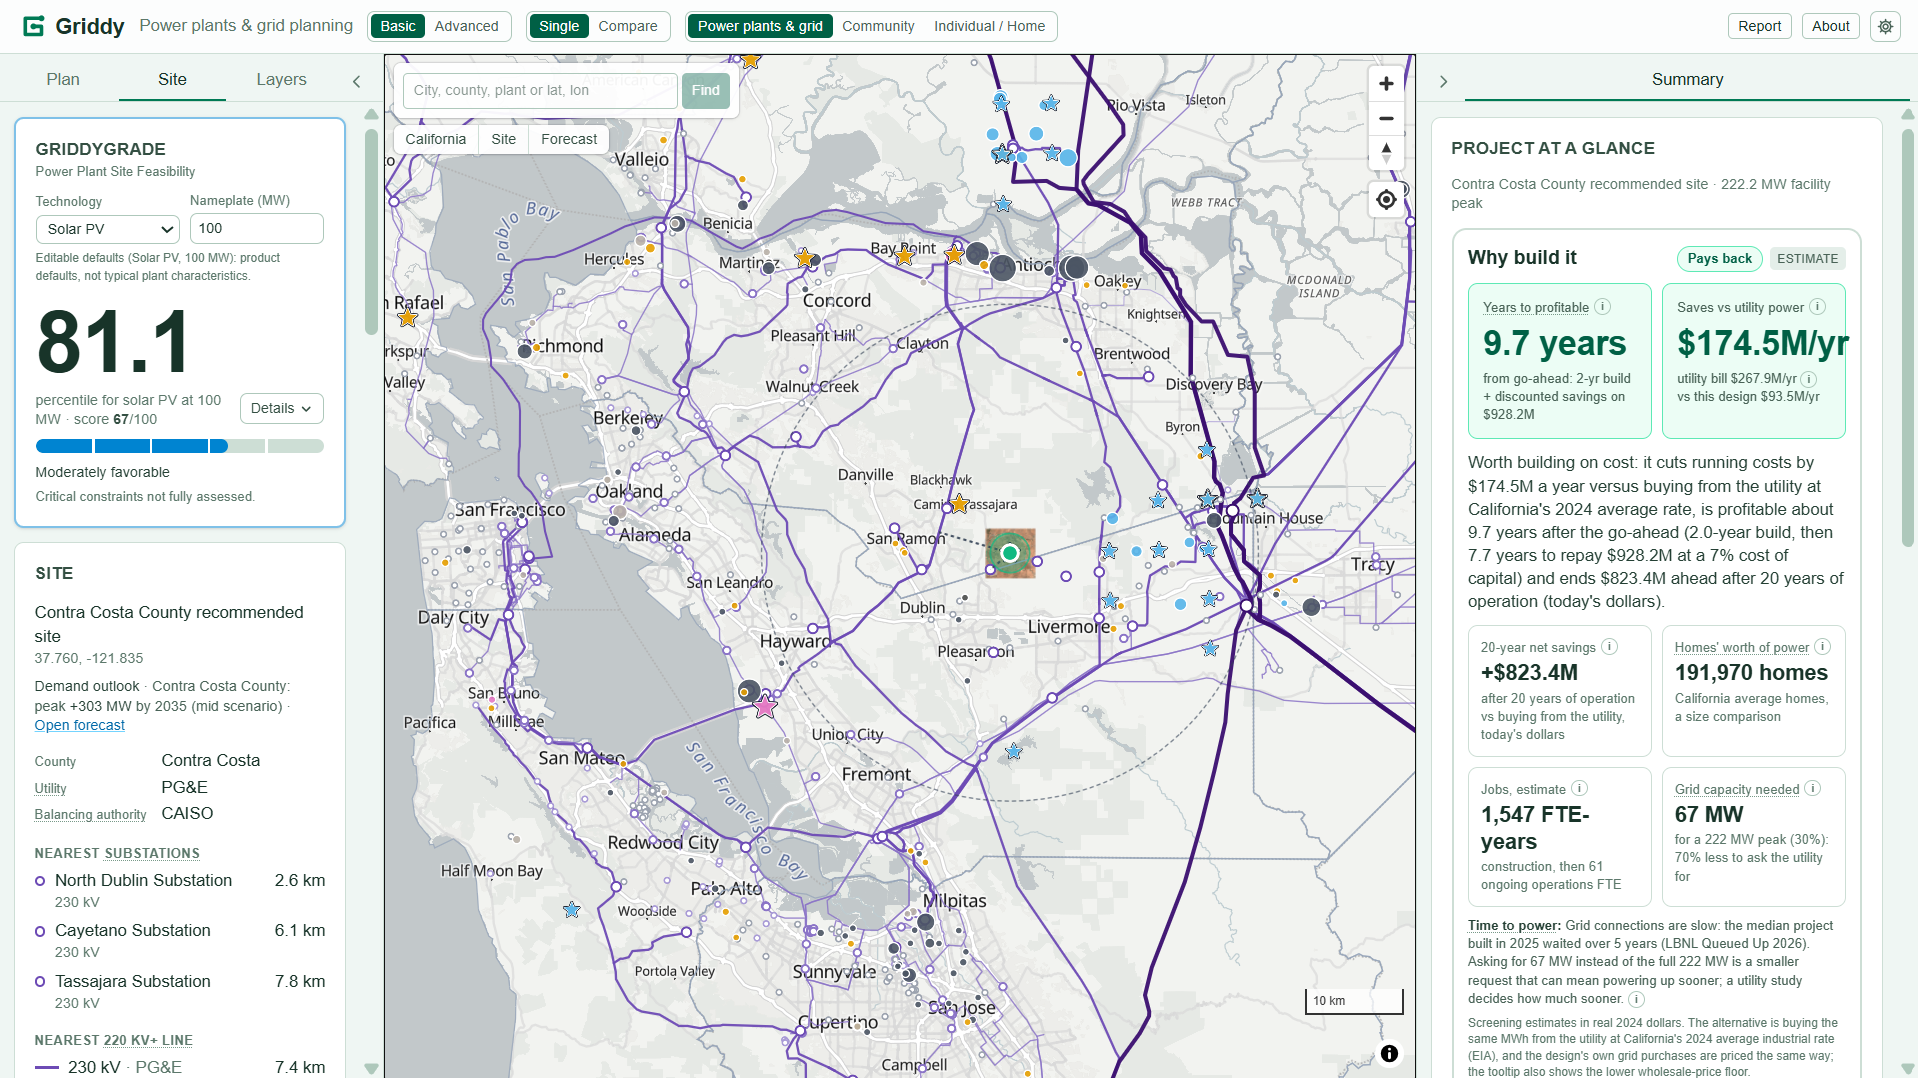
Example GriddyGrade 1 - industrial power plant
-
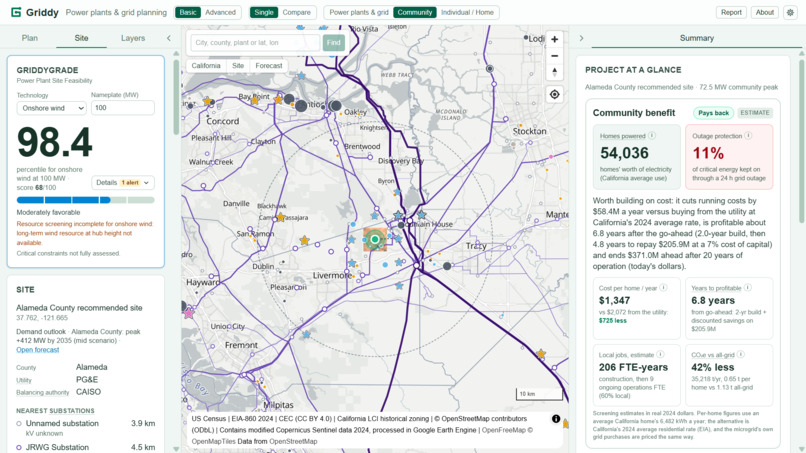
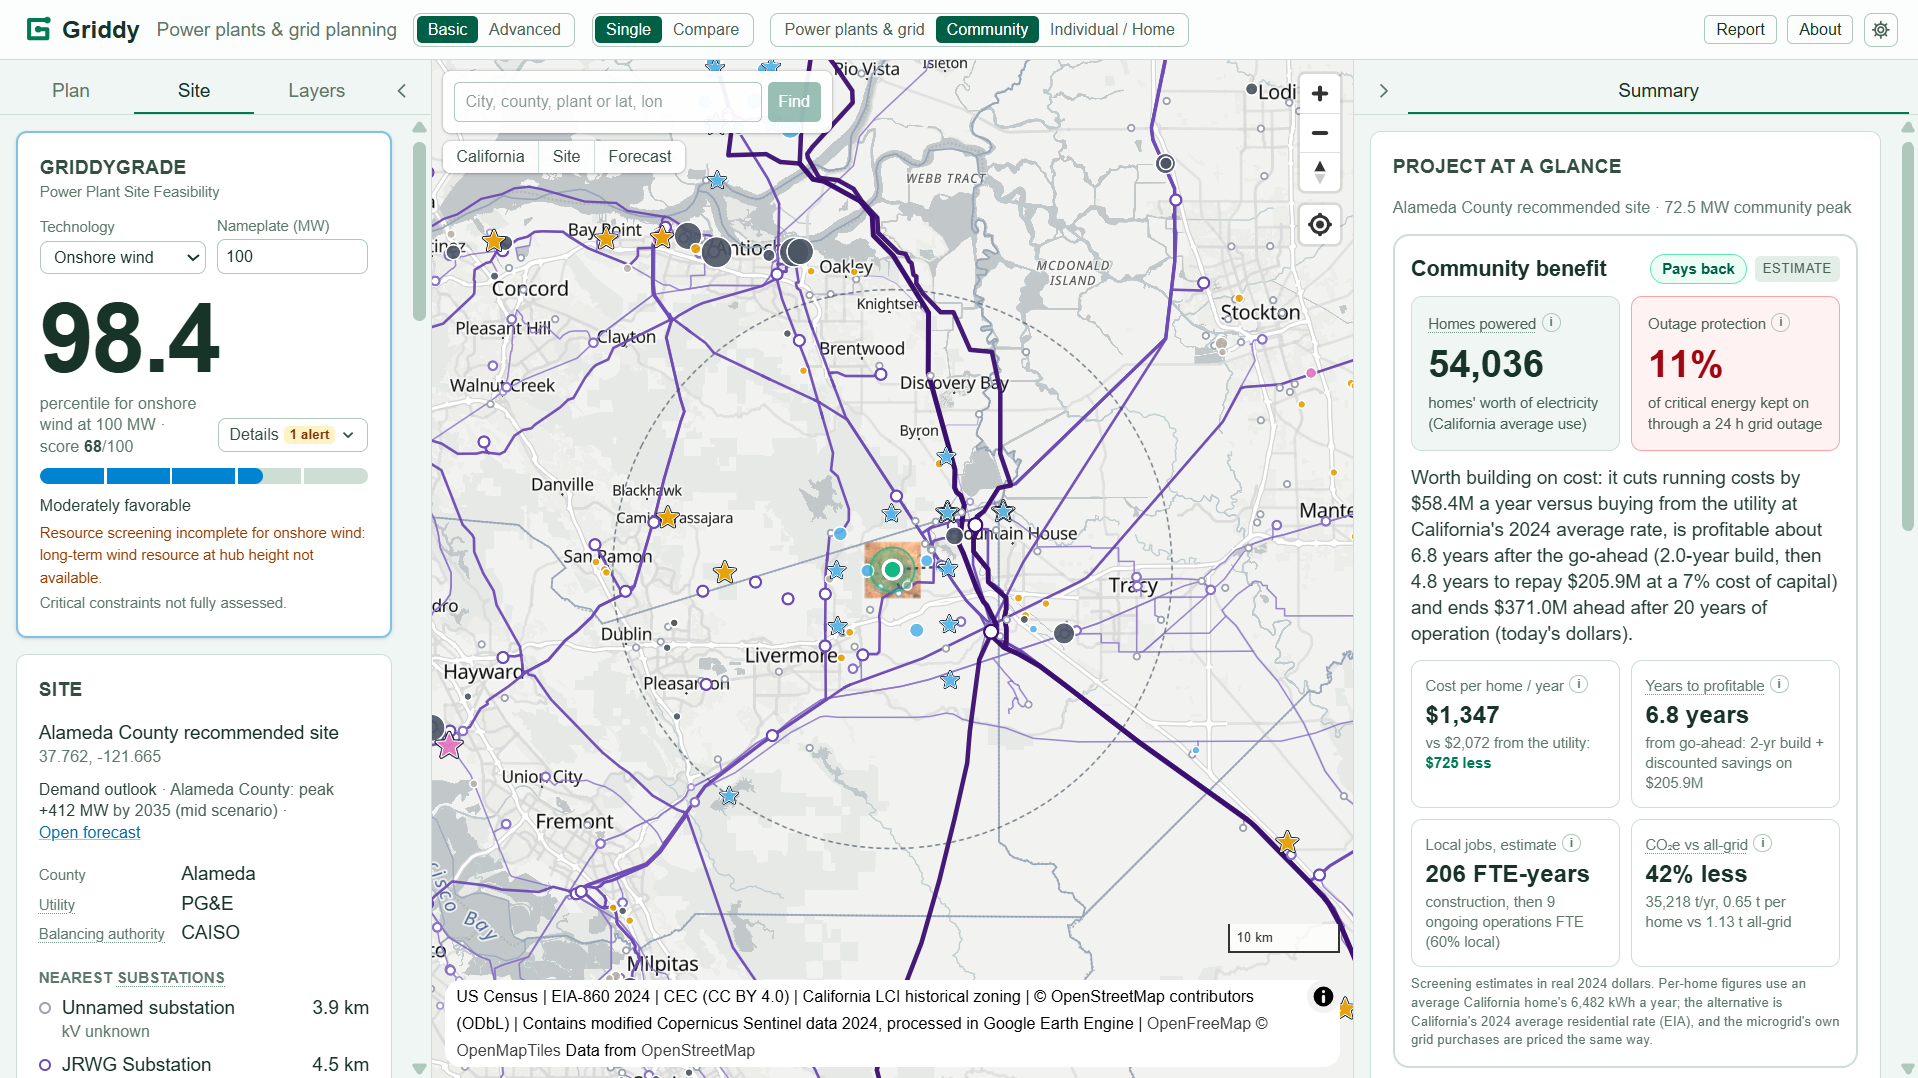
Example GriddyGrade 2 - community microgrid
-
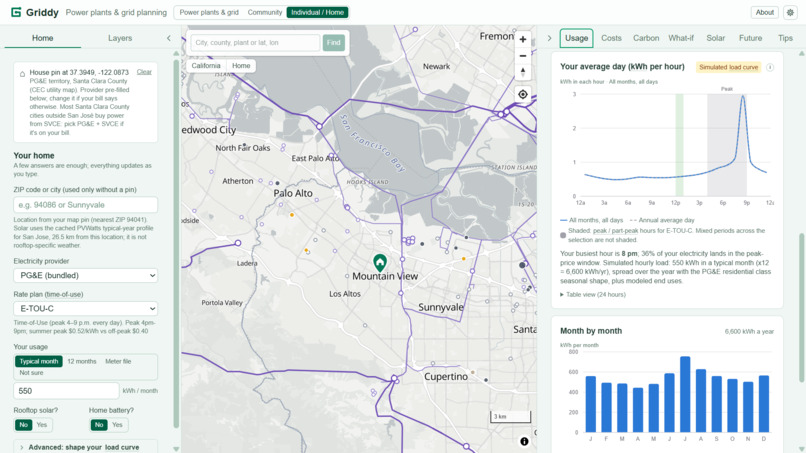
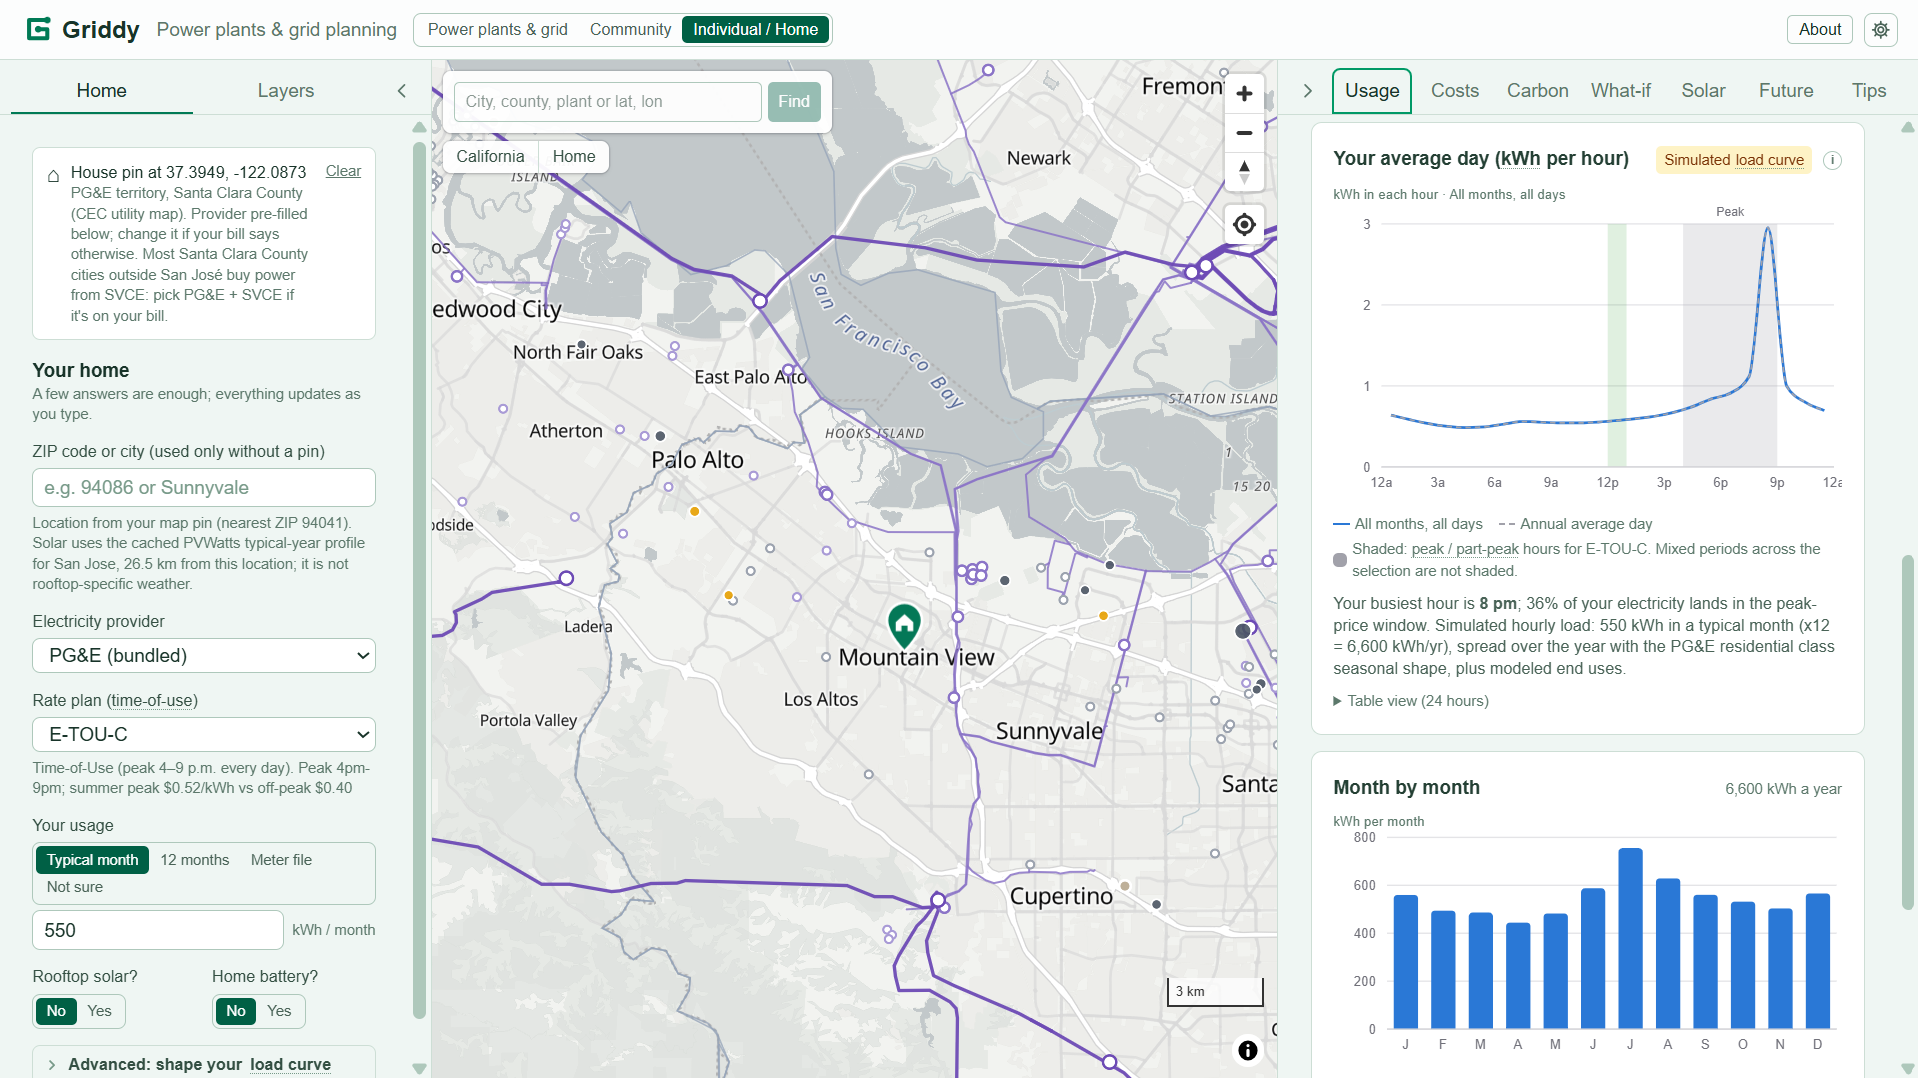
Example GriddyHome - monthly consumption
-
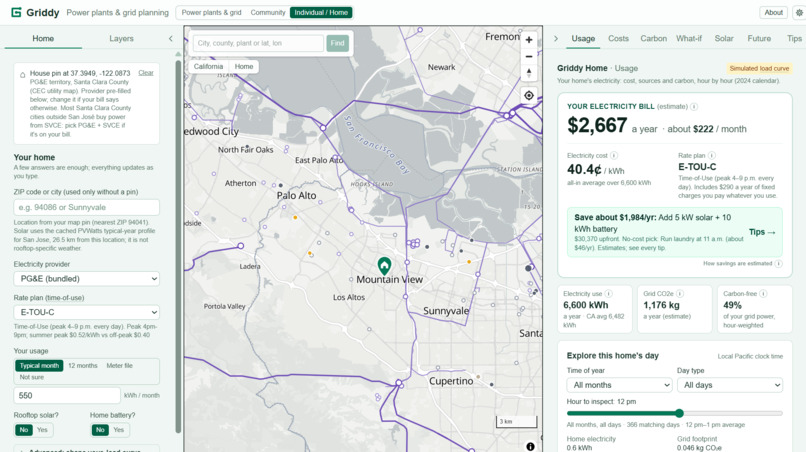
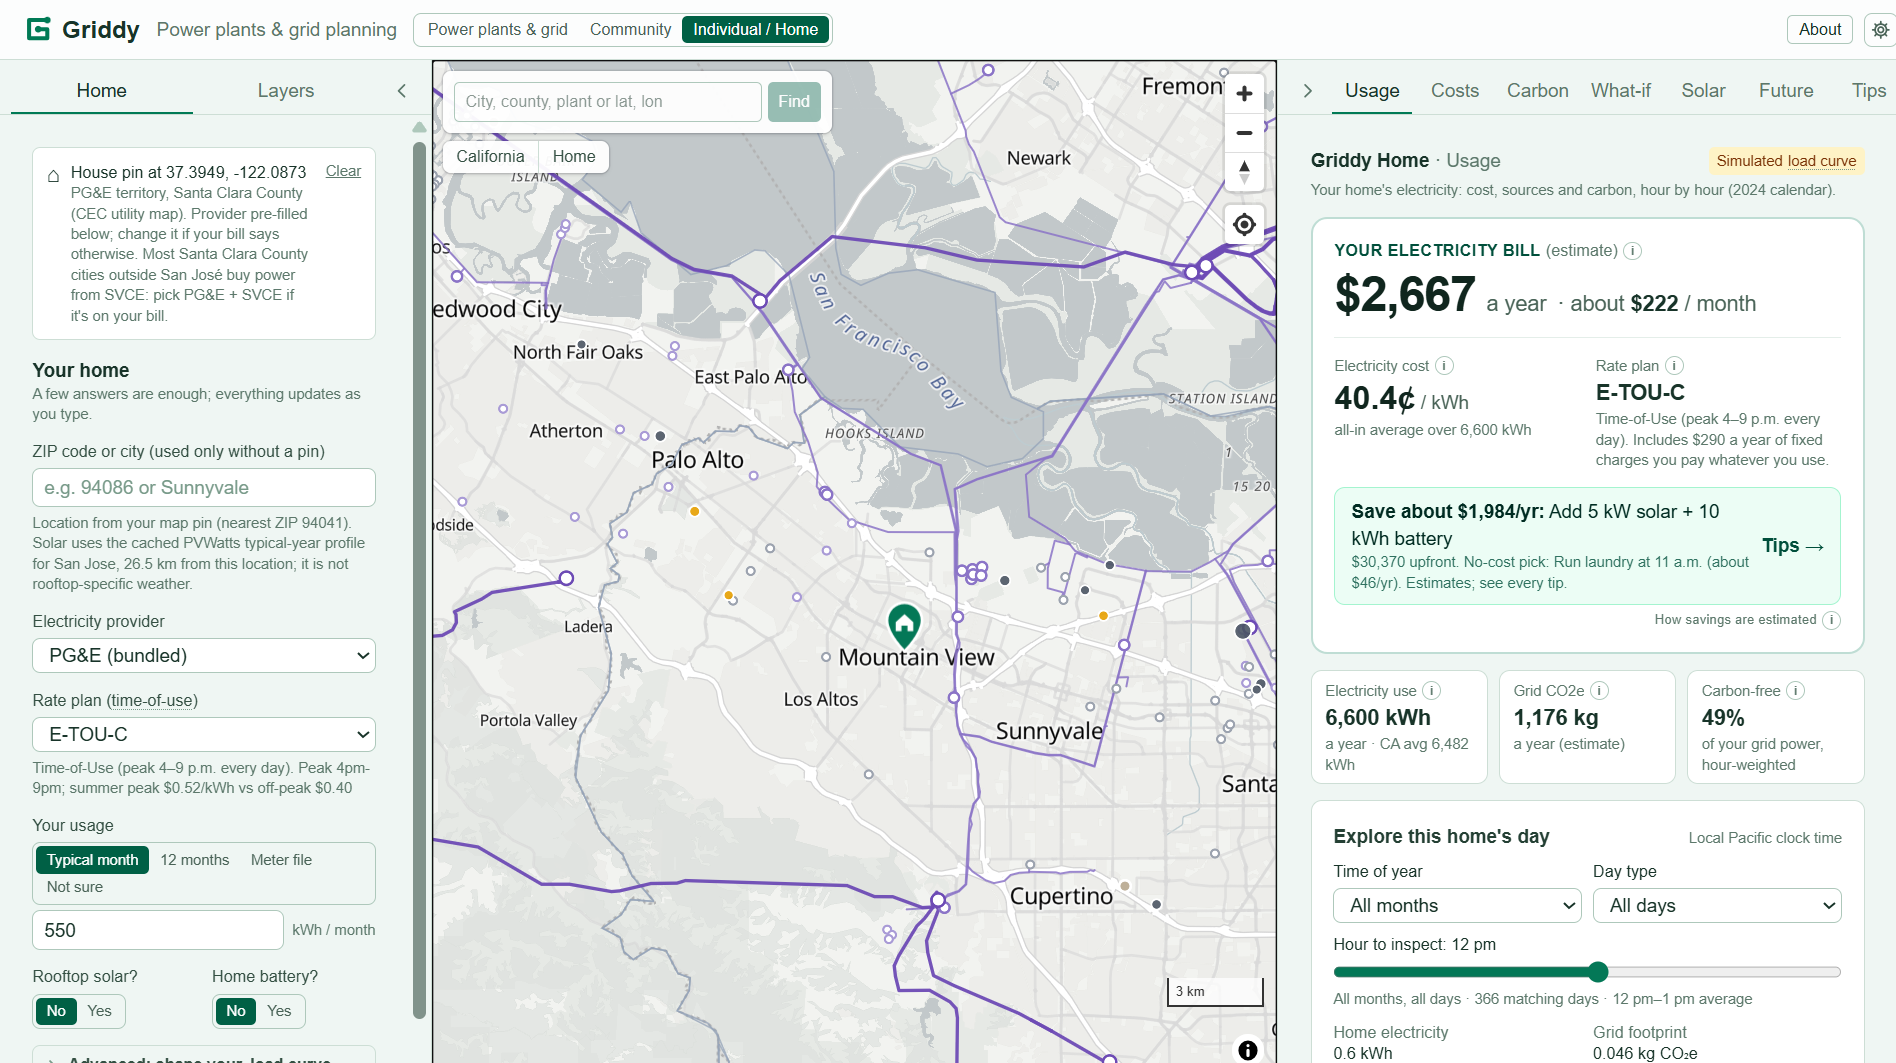
GriddyHome electric bill
-
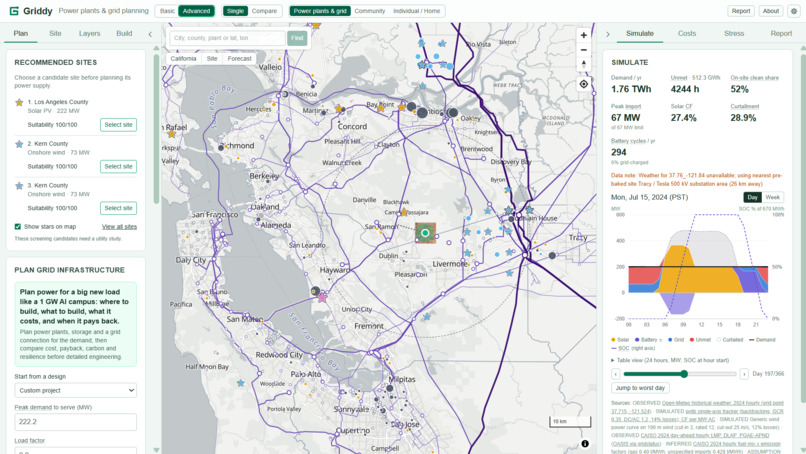
Power plant prediction
-
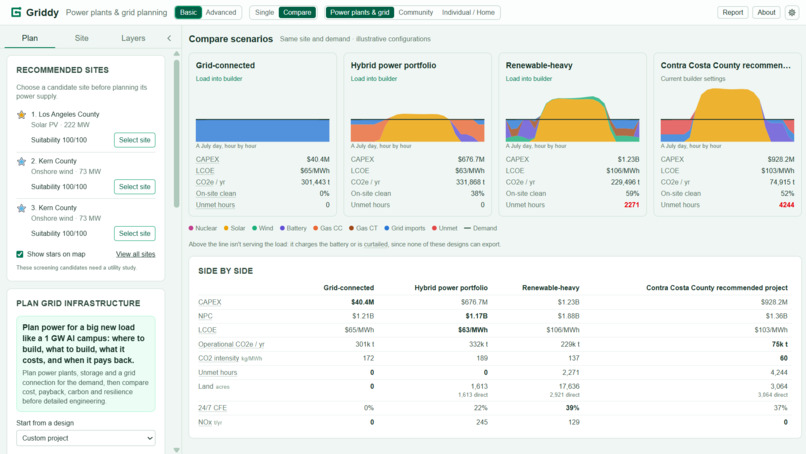
Comparison of power plant prediction models
-
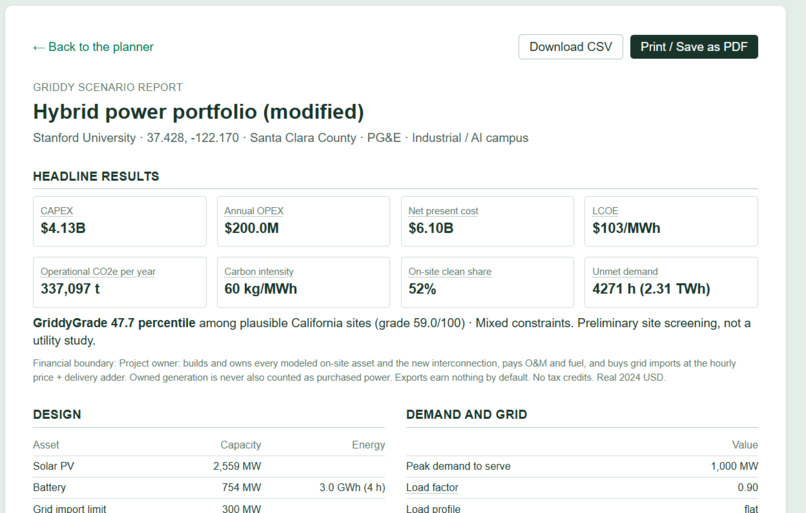
Example site report
-
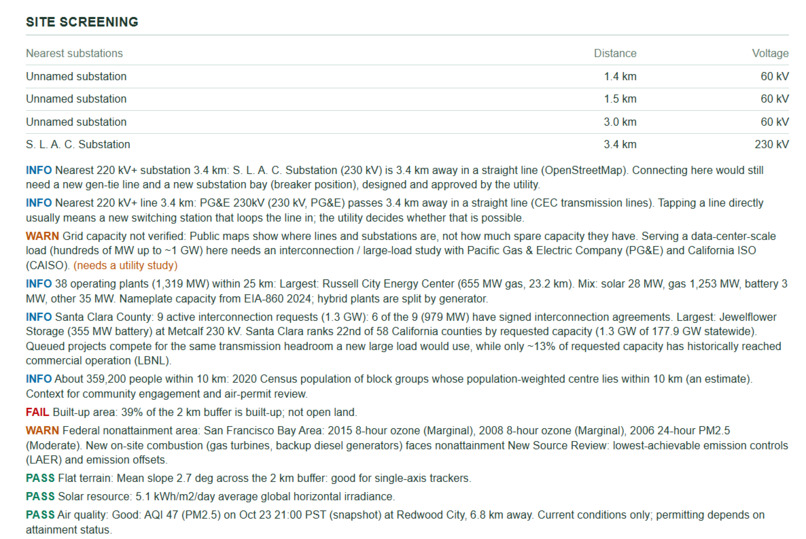
Example site report continued
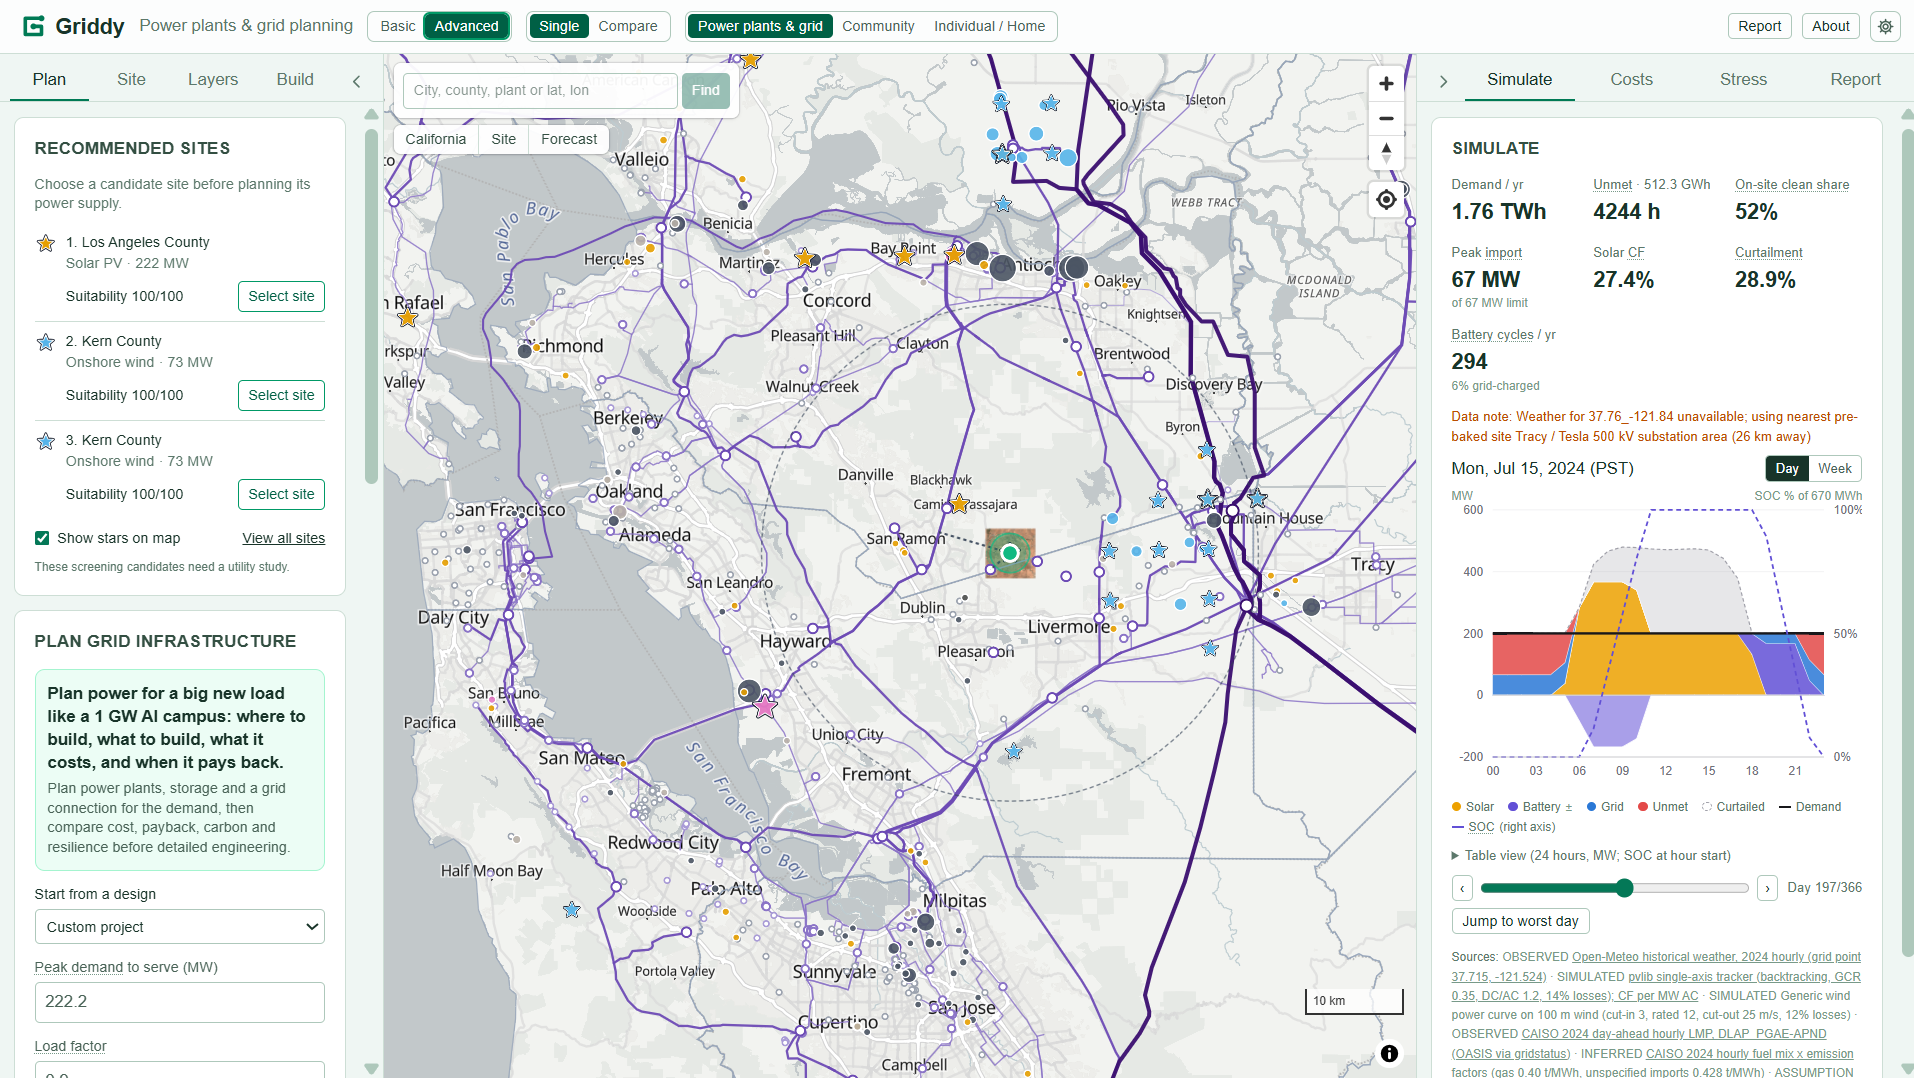
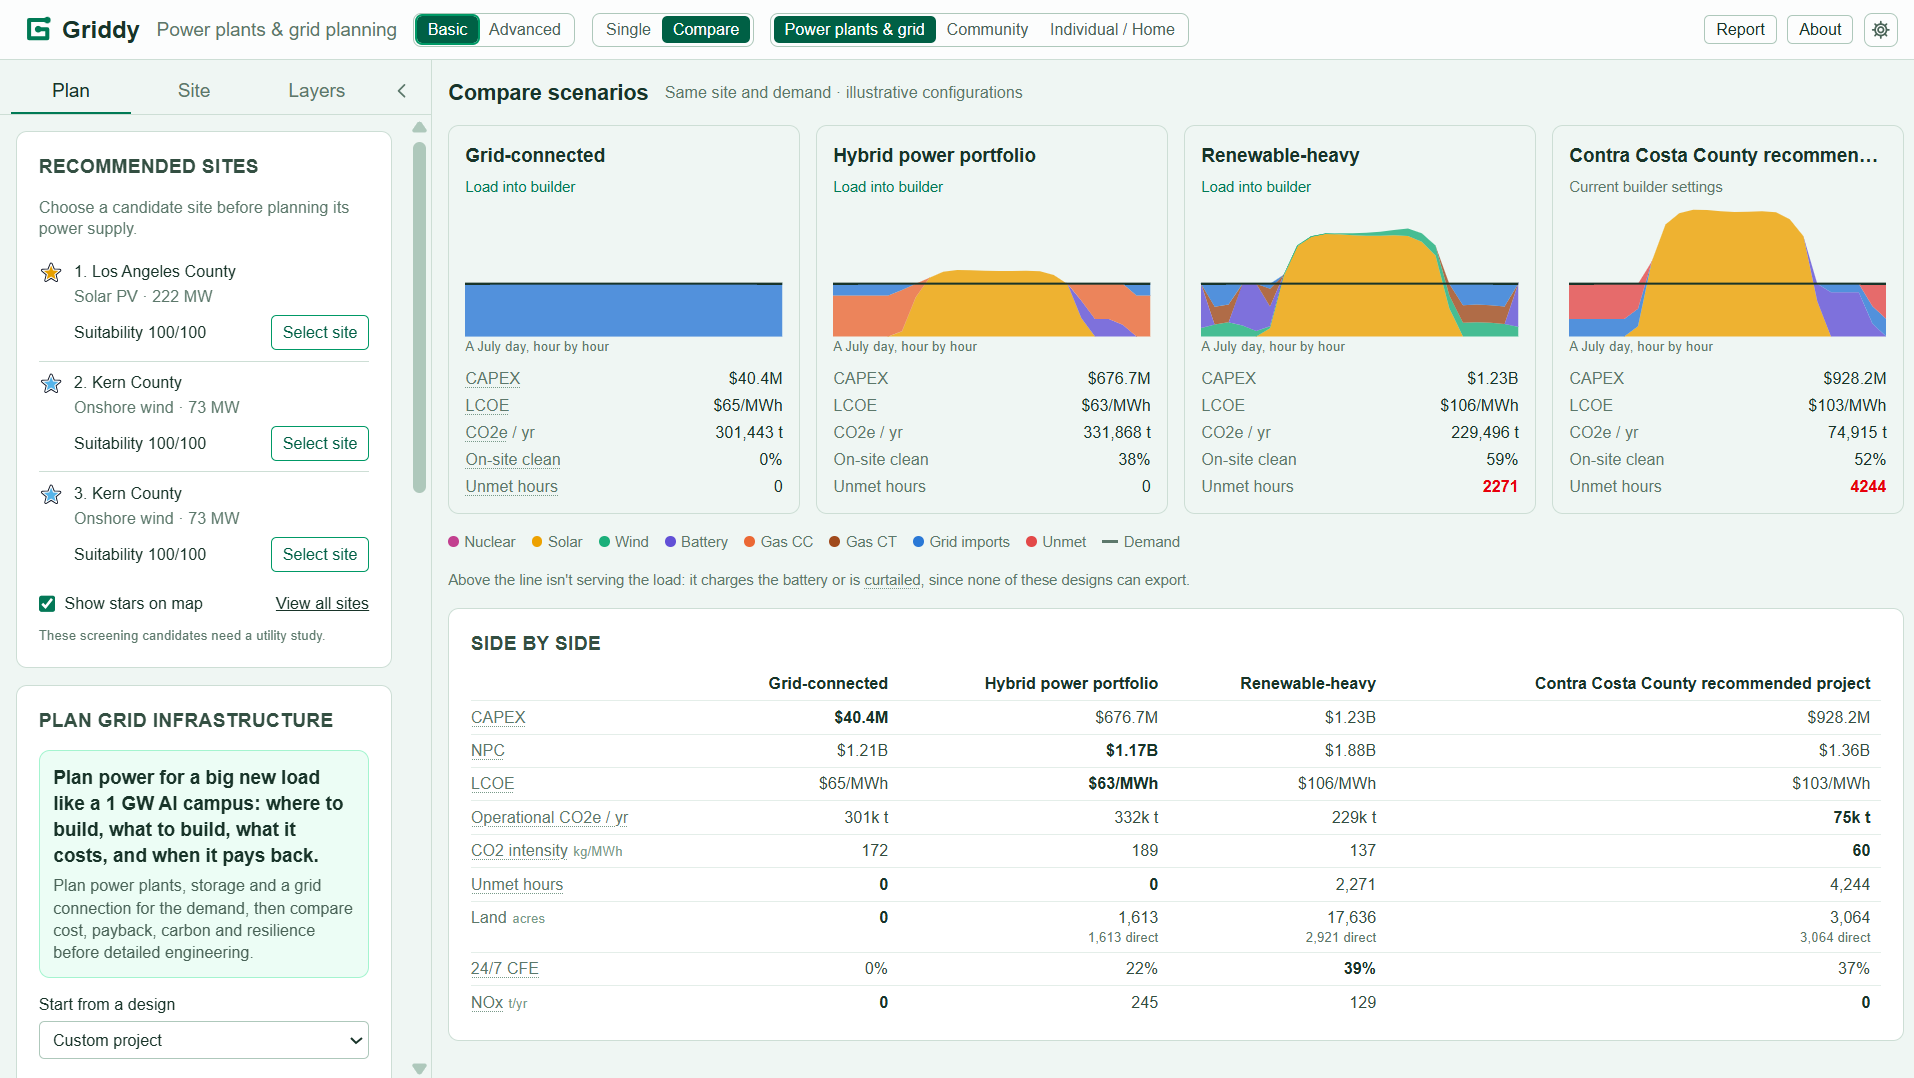
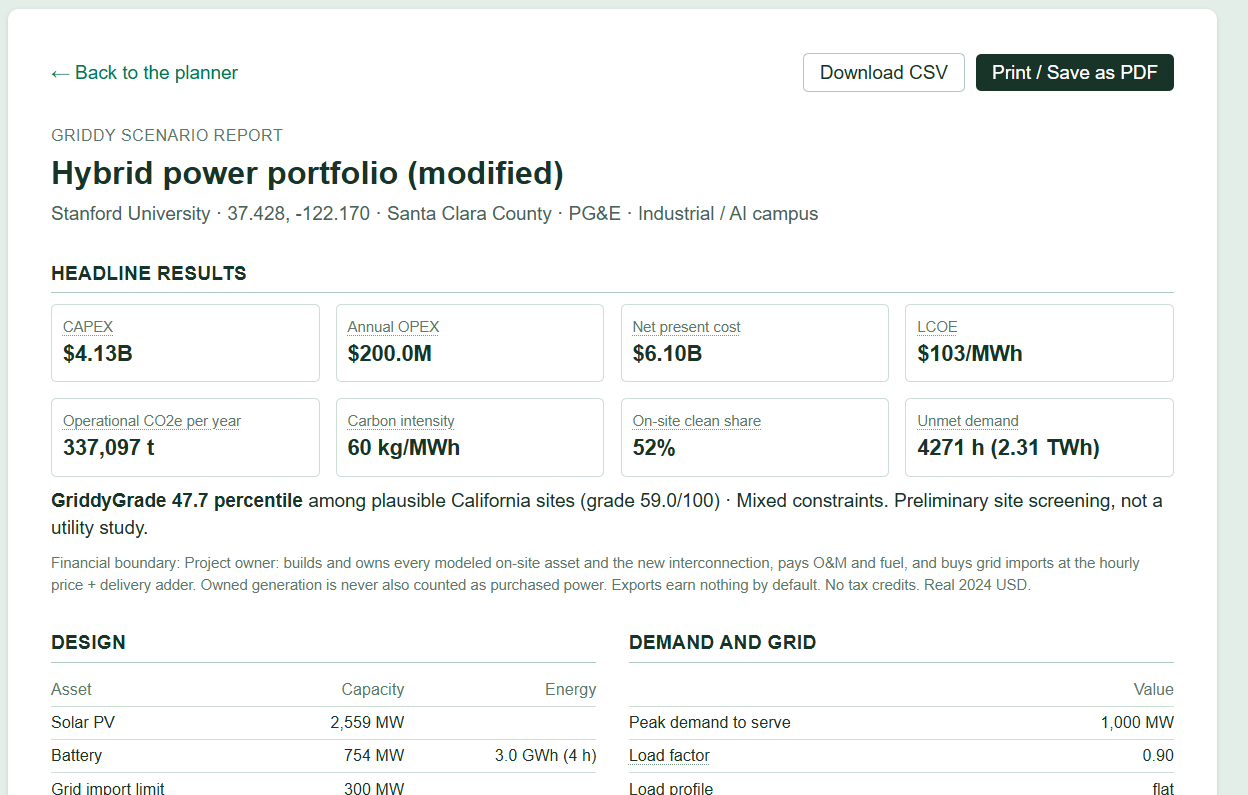
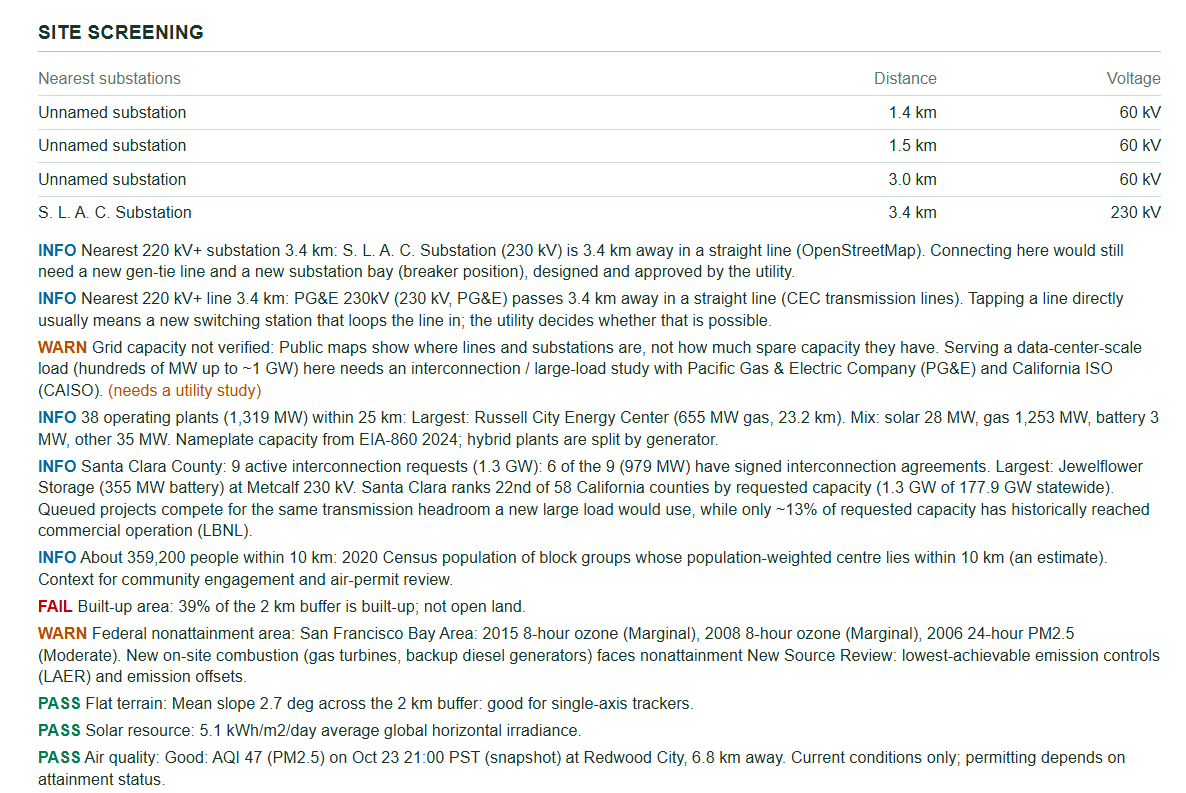
Griddy (getgriddy.app) turns one click on California's grid into a sourced, stress-tested first look at what to build there, and what it costs in dollars, carbon and clean air.
Sustainability impact
- Clean projects that actually get built. Only about 13% of the capacity that asks for a grid connection ever reaches commercial operation (LBNL, Queued Up). Most projects fail late, often because there's no high-voltage line nearby or the permit is denied. Griddy checks both on the first click, so time and money go to solar, wind and storage projects that can actually connect.
- Clean energy counted hour by hour. Griddy measures clean-energy share against hourly grid carbon across all 8,784 hours of 2024. An annual average can make a design look green while it leans on gas every night. Hourly numbers show when the grid is really clean.
- The climate cost of shortcuts, on screen. For a 1 GW AI campus near Stanford, gas lets the campus get by with a 300 MW grid connection instead of a full gigawatt. The cost is 1.32 Mt of CO₂ a year and a hard air permit in an ozone nonattainment area. Planners see that trade-off before they commit to it.
Creativity
- Every piece connected, from map to proposal. Today, demand forecasts, siting, reliability and costs live in spreadsheets, GIS portals and utility studies that rarely talk to each other. In Griddy they are linked, so changing a growth rate or a battery size updates the simulation, stress tests and cost projections at once. You can see how each design choice affects reliability and costs.
- Siting for future demand, not today's. Our demand forecast feeds straight into our site-location model. New capacity goes where demand will grow by 2040, close to existing high-voltage lines.
- A tool that fails its own designs. Griddy runs the tests a utility would ask for: outages, heat waves, and stretches without sun or wind. It looks for where a plan breaks and flags each problem for a utility study instead of hiding it.
Technical feasibility
- Live and working. Griddy is deployed at getgriddy.app. It runs on more than a dozen public datasets from EIA, CAISO, LBNL, NREL, EPA, the Census and Google Earth Engine. If a live data service goes down, the app falls back to saved data.
- Predictive machine learning, tested on unseen data. Griddy runs on two XGBoost models, trained offline on GPU, that work as a chain. The first predicts hourly electricity demand for California's 7 load regions from weather and calendar features. On 2025–26 data it never saw, its hourly error is 8.7%, against 11.2% for a baseline. The second takes that forecast and predicts where new solar, wind, battery and gas plants are most likely to succeed. It scores 0.92–0.96 ROC-AUC on whole regions held out from training.
- Profitability from real economic data. Griddy shows whether a power plant can make a profit and how long that will take. It uses real CAISO hourly prices and NREL's 2025 Annual Technology Baseline costs. Every number is labeled observed, assumed, simulated or inferred, and has a source, so anyone can check the math.
Pathways to scale and impact
- Three scales, one tool. Griddy works for individuals, communities and large industrial projects:
- Individuals can see what their power will cost.
- Communities can check whether new supply keeps up with local demand as it grows.
- Utilities, developers and data-center site selectors can plan projects as large as a 1 GW AI campus.
- A head start on the formal study. Users can compare sites and designs before paying for a months-long interconnection study. Griddy's report lists exactly which questions that study needs to answer, such as spare substation capacity.
- Built to travel. Most of our inputs are national or global. Expanding beyond California mostly means swapping in each region's grid prices, transmission map and population projections.
Inspiration
California's residential electricity prices have risen more than 85% in a decade. AI data centers now ask for hundreds of megawatts at a time, and state law targets 100% clean electricity by 2045. Wanting to build is the easy part. Knowing where to build, and what, is hard. Projects tend to fail late, on problems a first look could have caught. We wanted that first look to take minutes and to show its work.
What it does
Click any site on a map of California's grid to get:
- GriddyGrade: a 0–100 site score, ranked against 12,864 plausible California sites.
- Forecast and siting: each region's electricity demand through 2040, and the best places for new solar, wind, batteries and gas.
- Simulation and stress tests: your design run hour by hour through all of 2024, then tested against outages, heat waves and stretches without sun or wind.
- Exportable report: costs, LCOE, emissions and the hour-by-hour clean-energy share.
For the Stanford campus, a hybrid of solar, gas and batteries meets demand in every hour of the year. It costs $2.89B up front, at $61/MWh. Griddy also flags what a glossy proposal would hide:
- a firm capacity margin of only 2.7%
- 141 unmet hours if the largest gas unit trips
- NOx emissions in an ozone nonattainment area
How we built it
Five of us built Griddy in 24 hours. The backend is Python (FastAPI) and the frontend is Next.js/React. One shared definition of the data types kept our parts working together.
We trained two XGBoost models offline on GPU and chained them together:
- Demand forecast: predicts hourly demand for California's 7 load regions.
- Site-location model: scores 16,393 cells, each 5 km across, on how much they look like places where plants were actually built.
A linear program then places the new capacity the forecast calls for on the best cells. The GriddyGrade gives grid access the most weight (36%). Any site with no 220 kV+ line within 20 km is capped at 35.
Challenges
- The most important number isn't public. Utilities don't publish how much spare capacity a substation has. Griddy flags it for a utility study instead of guessing.
- Our AUC is flattered. Our random "no plant" examples are easy to tell apart from real plant sites, so part of the score comes from an easy task. We show that caveat next to the number in the app.
- Missing isn't zero. When data is missing, the GriddyGrade leaves that part out and reweights the rest.
What's next
- A least-cost optimizer that sizes the plant automatically
- Marginal grid emissions (the carbon of the next MWh)
- Utility data on spare grid capacity, where it's published
- A household mode for rooftop solar and batteries
- Regions beyond California
Built With
- eia
- maplibre
- ml
- nrel-atb
- pydantic
- python
- react
- typescript

Log in or sign up for Devpost to join the conversation.