-
GridCheck
Inspiration
Electricity in New England is not equally clean every hour. ISO New England’s mix of gas, nuclear, hydro, solar, and wind shifts with the hour, the day, and the season — so the same washer cycle can have a different carbon footprint depending on when it runs. As students with packed weeks, we kept noticing the same gap: climate advice tells people to “use less energy,” but almost nothing helps you time the energy you already use around class, work, sleep, and a deadline.
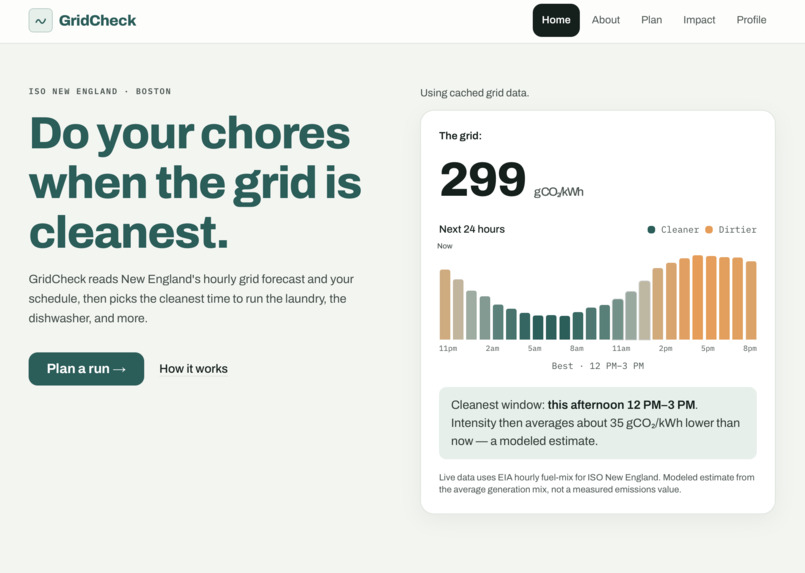
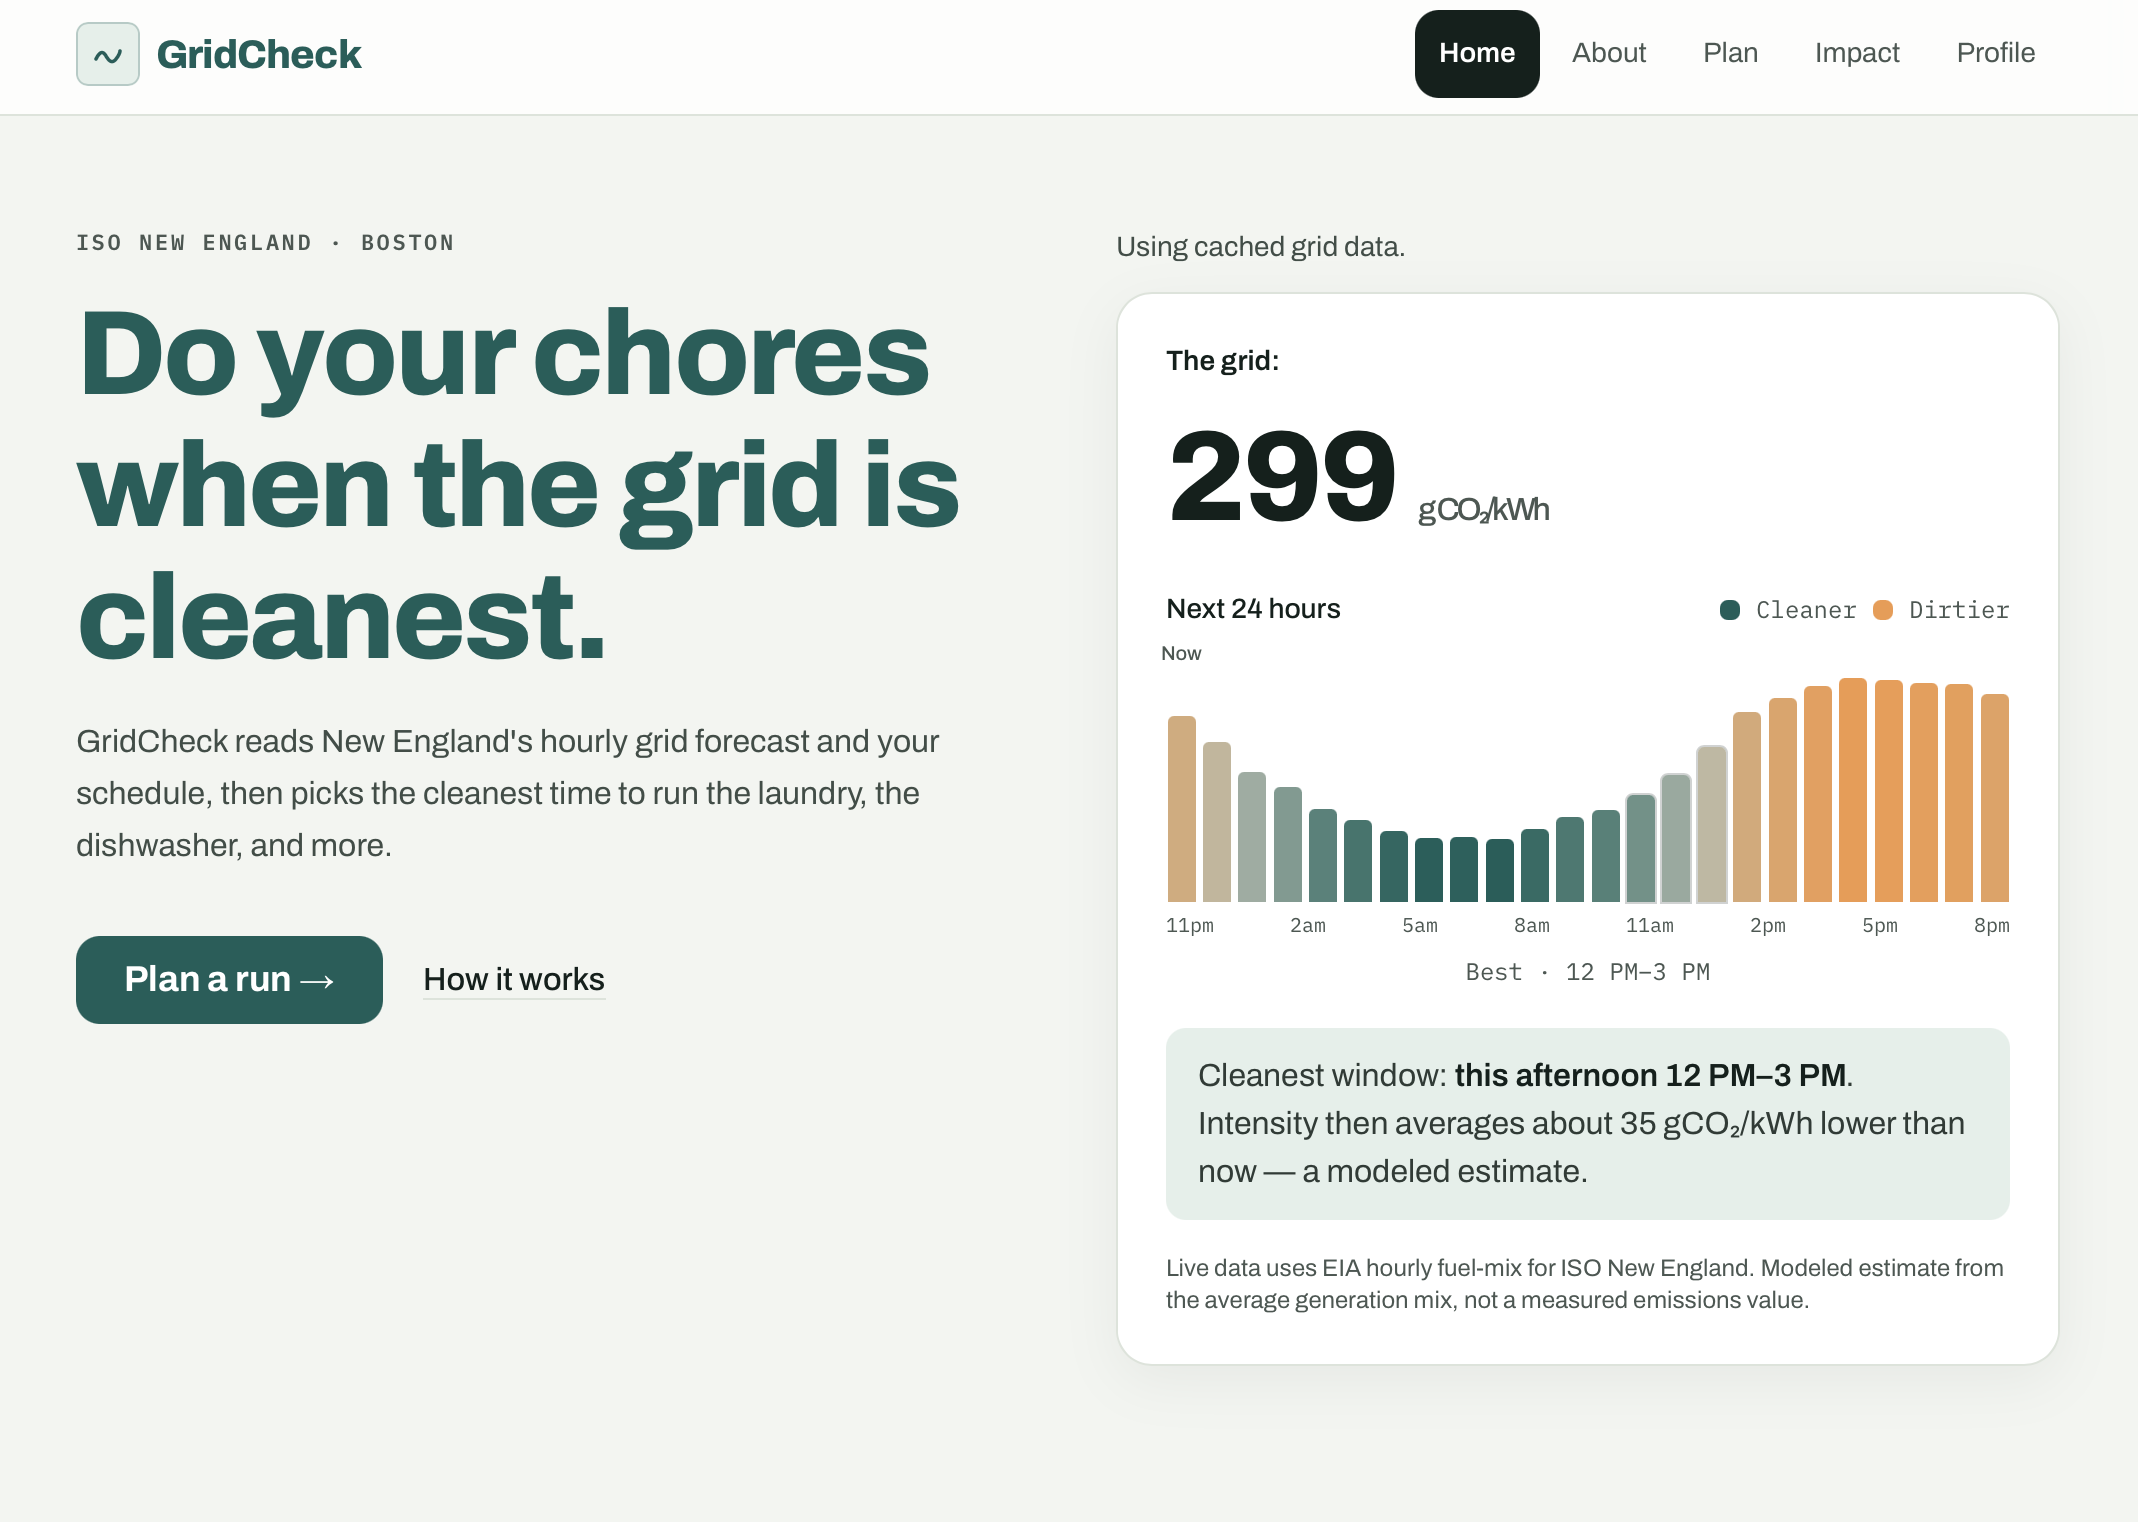
We built GridCheck for the ASUS “Save the Earth” track at HackHarvard 2026 because we wanted sustainability that fits real life instead of asking people to rearrange their lives around it. The core idea: show when the grid is cleaner, then recommend run times that also respect when you actually have to be there — load the dishwasher, empty the washer, plug in the EV.
What it does
GridCheck is a mobile-first web app for New England. You load a week from a calendar .ics file (parsed entirely in the browser — event titles never hit our server), pick appliances (washer, dryer, dishwasher, EV charging, laptop), set a deadline, and get labeled options — Recommended, Greenest, Soonest, and alternatives — on a 7-day intensity grid. Choose a run and track modeled CO₂ saved, per-run scores, and bands on an on-device Impact dashboard.
From Impact, The Invisible Campus (Reveal) is a three-scene cinematic story: the campus you see, the grid underneath, and how timing a load could work with that grid. The visuals are illustrative CSS/SVG art built for the demo — not live AI image generation.
Every emissions number is labeled as a modeled estimate. Our honesty line:
These are modeled comparisons based on the average generation mix, not verified avoided emissions, which would require marginal-emissions data.
Per-load savings for laundry are real and small. EV charging matters most: a Level 2 session in our catalog is 28.8 kWh vs 0.5 kWh for a washer — about 57.6× the energy, so shifting the EV moves far more carbon than shifting one load of laundry.
This weekend the 7-day outlook is a weekly pattern forecast, so Best equals Greenest; Recommended can still land on a near-tie so we don’t pile every user onto one “greenest” hour. Calendar export (download a chosen run as .ics with reminders) is not shown in the demo build.
How we built it
We split the work into three tracks under a shared TypeScript contract (lib/types.ts, lib/constants.ts):
- Grid data — Server-side EIA API v2 for ISO New England (
ISNE): hourly fuel mix → carbon intensity, a 168-hour pattern forecast from the last four weeks of the same weekday + hour, andGET /api/gridwith a one-hour cache plus a saved fallback snapshot so the demo survives bad Wi‑Fi. Home and Plan show “Using cached grid data” whensource === "fallback". - Scheduling logic — Pure functions: 15-minute slots, validity rules (deadline, busy/sleep, attention type, delay-start), modeled grams, and ranking (Soonest / Greenest / Best / Recommended / alternatives). Multi-appliance plans schedule the largest-energy load first and chain chosen runs as fixed blocks. Guest run history and scoring live in the browser only — no database.
- UI — Next.js + React + Tailwind: Home (purpose + live “grid right now”), Plan (
.icsbusy blocks + planner form + 7-day grid + option cards), Impact (history, scores, Invisible Campus), and About. Built mobile-first at 375px, then desktop.
Intensity for an hour is the generation-weighted average:
$$ I = \frac{\sum_f \left(E_f \cdot F_f\right)}{\sum_f E_f} \quad \left[\mathrm{gCO_2/kWh}\right] $$
where $$E_f$$ is MWh from fuel $$f$$ and $$F_f$$ is that fuel’s IPCC lifecycle factor. Modeled run emissions spread the cycle evenly across slots:
$$ \text{grams} = \sum_s \left(I_s \cdot \frac{E_{\text{cycle}}}{N}\right) $$
where $$N$$ is the number of slots in the run and $$I_s$$ is that slot’s hourly intensity. Details and factors: docs/METHODOLOGY.md.
Stack / Built With
- TypeScript, JavaScript (Next/React runtime)
- Next.js, React, Tailwind CSS, Vitest
- ical.js (browser-only
.icsimport for busy blocks) - Vercel (hosting)
- U.S. EIA API v2 (
api.eia.gov, respondentISNE) — server-only key - No database; guest history in browser
localStorageonly - Not included: calendar export download in the demo UI, xAI / Grok Imagine API, shared server accounts, analytics, other external APIs
Team: Miranda Liskov (frontend & product), Soumya Shelke (data & integration), Anish Pandey (scheduling & scoring) — UMass Amherst.
Challenges we ran into
- EIA as a demo dependency. Live fuel-mix data can time out or fail on bad Wi‑Fi. We treated fallback as a first-class path: cache for an hour, serve a re-aligned snapshot with
source: "fallback", and surface “Using cached grid data” in the UI. - Fitting chores into a real week. Busy blocks, sleep, and “when am I needed?” interact in subtle ways — e.g. an unattended middle of a dishwasher cycle can overlap class, but delay-start loading cannot fall during sleep. Encoding those rules as tests before wiring the UI kept the planner honest.
- Calendar privacy under a late start. Full Google free/busy sync stayed stretch. We shipped browser-only
.icsimport instead: the file is parsed on-device, titles never leave the browser, and busy intervals feed the same schedule rules as manual blocks. - Honesty under time pressure. It’s tempting to inflate impact or claim AI visuals we didn’t wire. We kept the pitch and Devpost tied to what’s on screen: modeled estimates, small laundry savings, EV as the load that matters, ISO New England only, guest history on-device, illustrative campus scenes.
- Integration under a late start. Shared types first, then parallel UI / grid / logic against mocks, then wire-up. The hard part wasn’t any one module — it was getting Home → Plan → Choose → Impact to feel like one product before feature freeze.
Accomplishments that we're proud of
- Real public data, end to end. GridCheck turns EIA fuel-mix data for ISO New England into hourly carbon intensity and a 7-day pattern forecast — no hard-coded “clean hours.”
- A demo that survives bad Wi‑Fi. The cached fallback snapshot means the full Home → Plan → Choose → Impact flow works even when the live API doesn’t.
- Scheduling that respects real life. Recommendations account for class, sleep, deadlines, and when an appliance actually needs you, with those rules covered by tests — including multi-appliance plans that re-rank after you Choose.
- Private calendar input.
.icsimport runs entirely in the browser; busy times hit the planner without sending event titles to our API. - Load-sharing without a server. The seeded Recommended pick spreads users across near-equal hours instead of piling everyone onto one “greenest” slot.
- Honest numbers + a story judges can feel. Every emissions figure is labeled as a modeled estimate, and The Invisible Campus makes the “grid under everyday life” idea tangible without overselling generative art.
- Privacy by default. No server database — run history and scoring stay on the user’s device.
What we learned
- Average ≠ marginal. Using the average generation mix is honest and computable from public EIA data, but it is not the same as verified avoided emissions. Saying that clearly made the product stronger for a sustainability track, not weaker.
- Constraints beat “greenest hour.” The cleanest slot is useless if you’re in class or asleep when the washer needs you. Attention type (
start/startEnd/throughout) and delay-start loading windows mattered as much as the intensity series. - Near-ties need diversity. If everyone always picks the single Greenest hour, you risk a new peak. Recommended is a seeded pick among runs within 3% of Best so near-equal hours can share load — without a coordination server.
- Cut early, demo hard. We cut demand-based forecasting and early Google calendar sync so the 60-second phone demo could work. Pattern forecast only means Best equals Greenest this weekend; we say that up front instead of overselling confidence-aware ranking. Shipping CSS/SVG campus scenes under a Grok label would have been dishonest — so we didn’t.
- Wire the path judges will tap. Choose → guest history → Impact scores mattered more than unfinished “nice” buttons like Add to calendar.
What's next for GridCheck
- Smarter forecasting: demand-based forecast + confidence-aware ranking, so Best can differ from Greenest
- Calendar export with reminders for the chosen run, and optional Google free/busy sync (so event titles never leave the browser)
- Optional accounts for history across devices (today everything stays on-device)
- Shared load balancing across users
- If we pursue generative art: a real Grok Imagine (or similar) pipeline behind The Invisible Campus with clear “illustrative / AI-generated” labeling
Built With
- claude
- cursor
- eiaapi
- grok
- ical.js
- javascript
- next.js
- react
- tailwindcss
- typescript
- vercel
- vitest

Log in or sign up for Devpost to join the conversation.