-
-
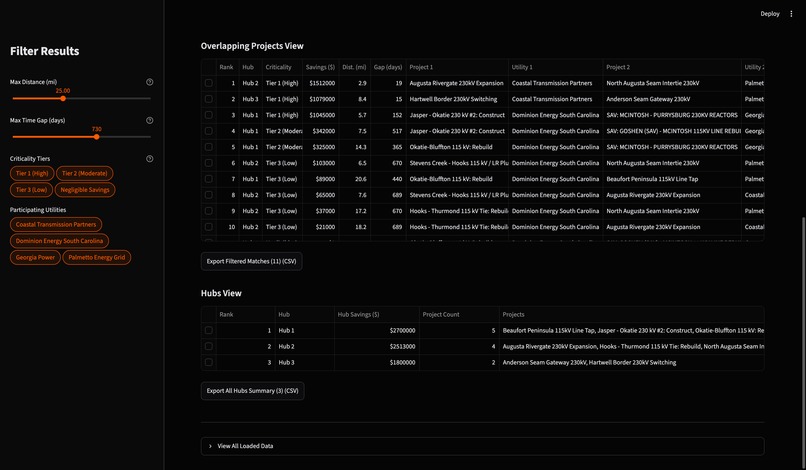
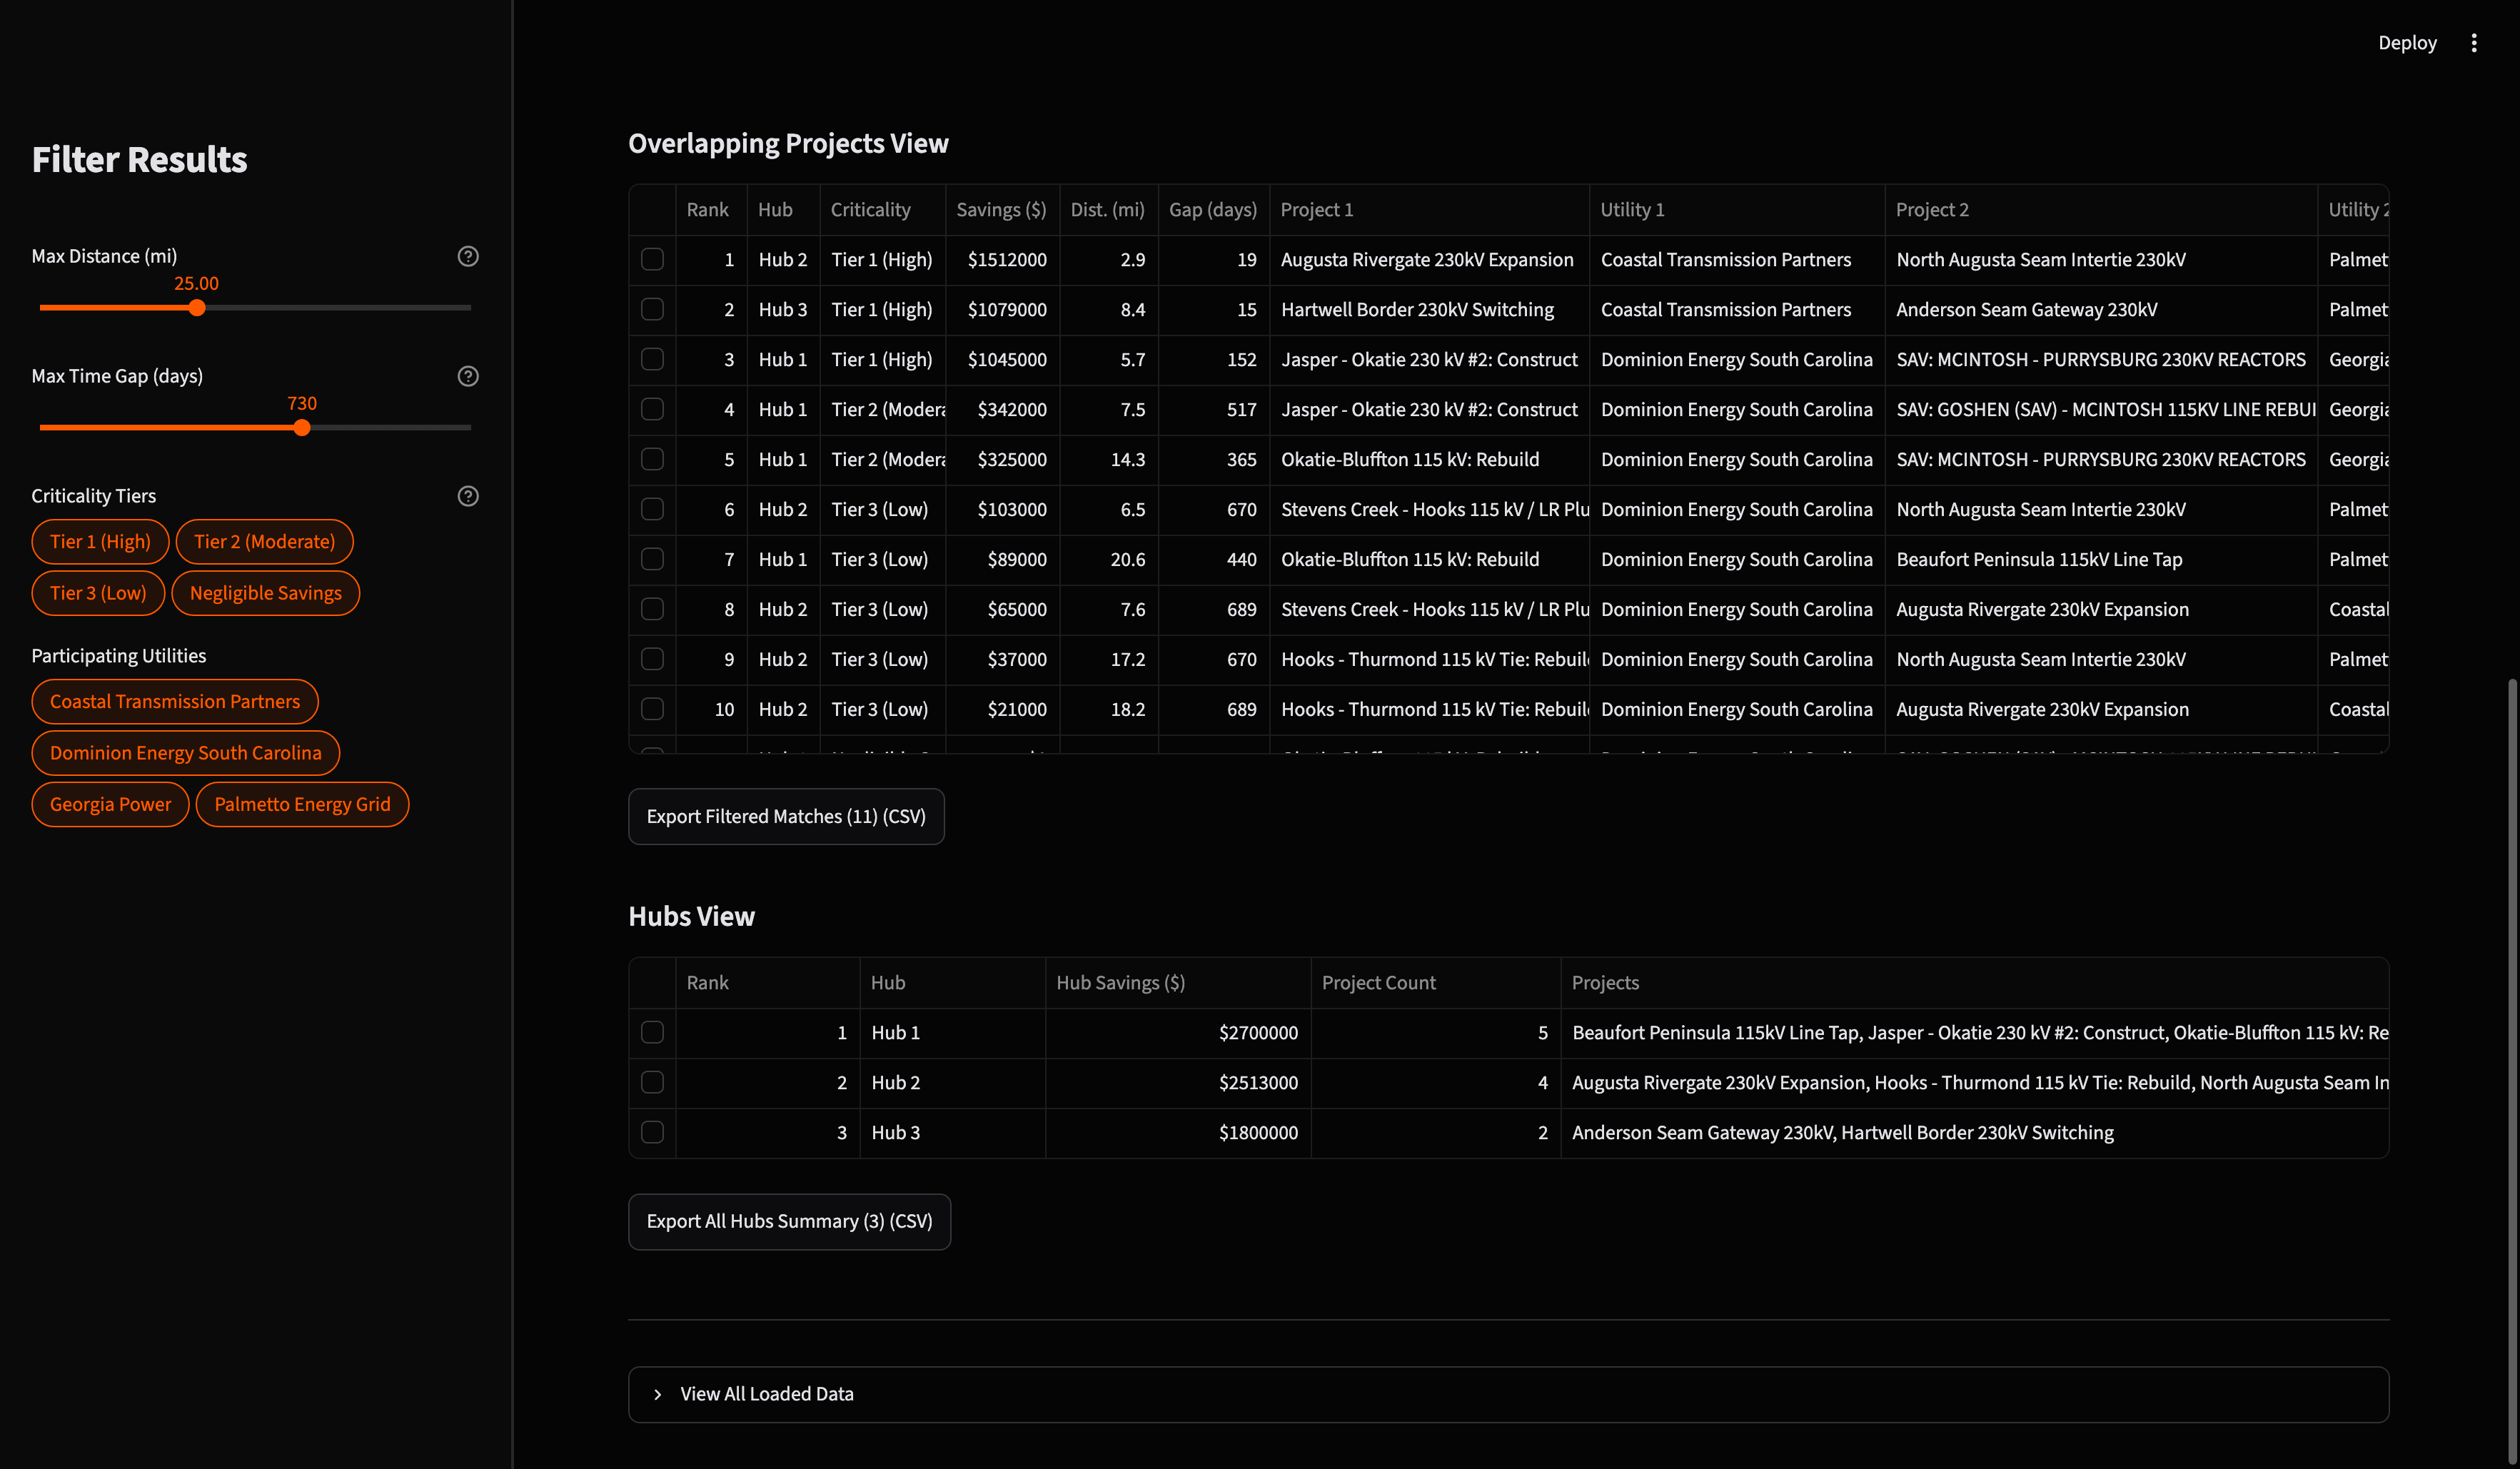
Projects and Hubs Views
-
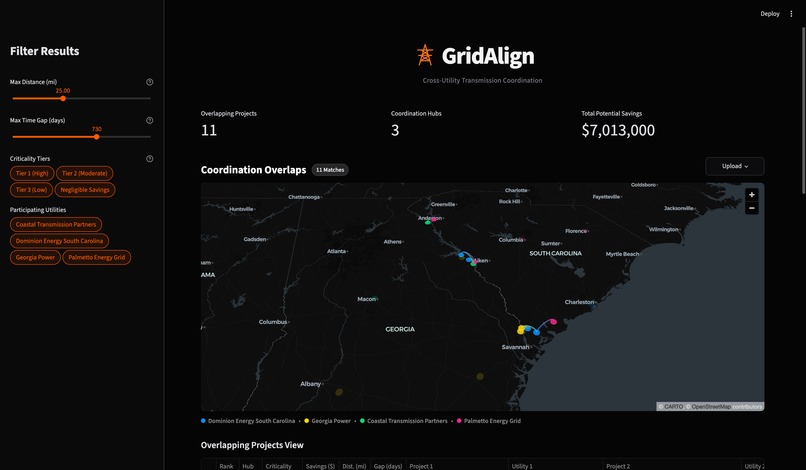
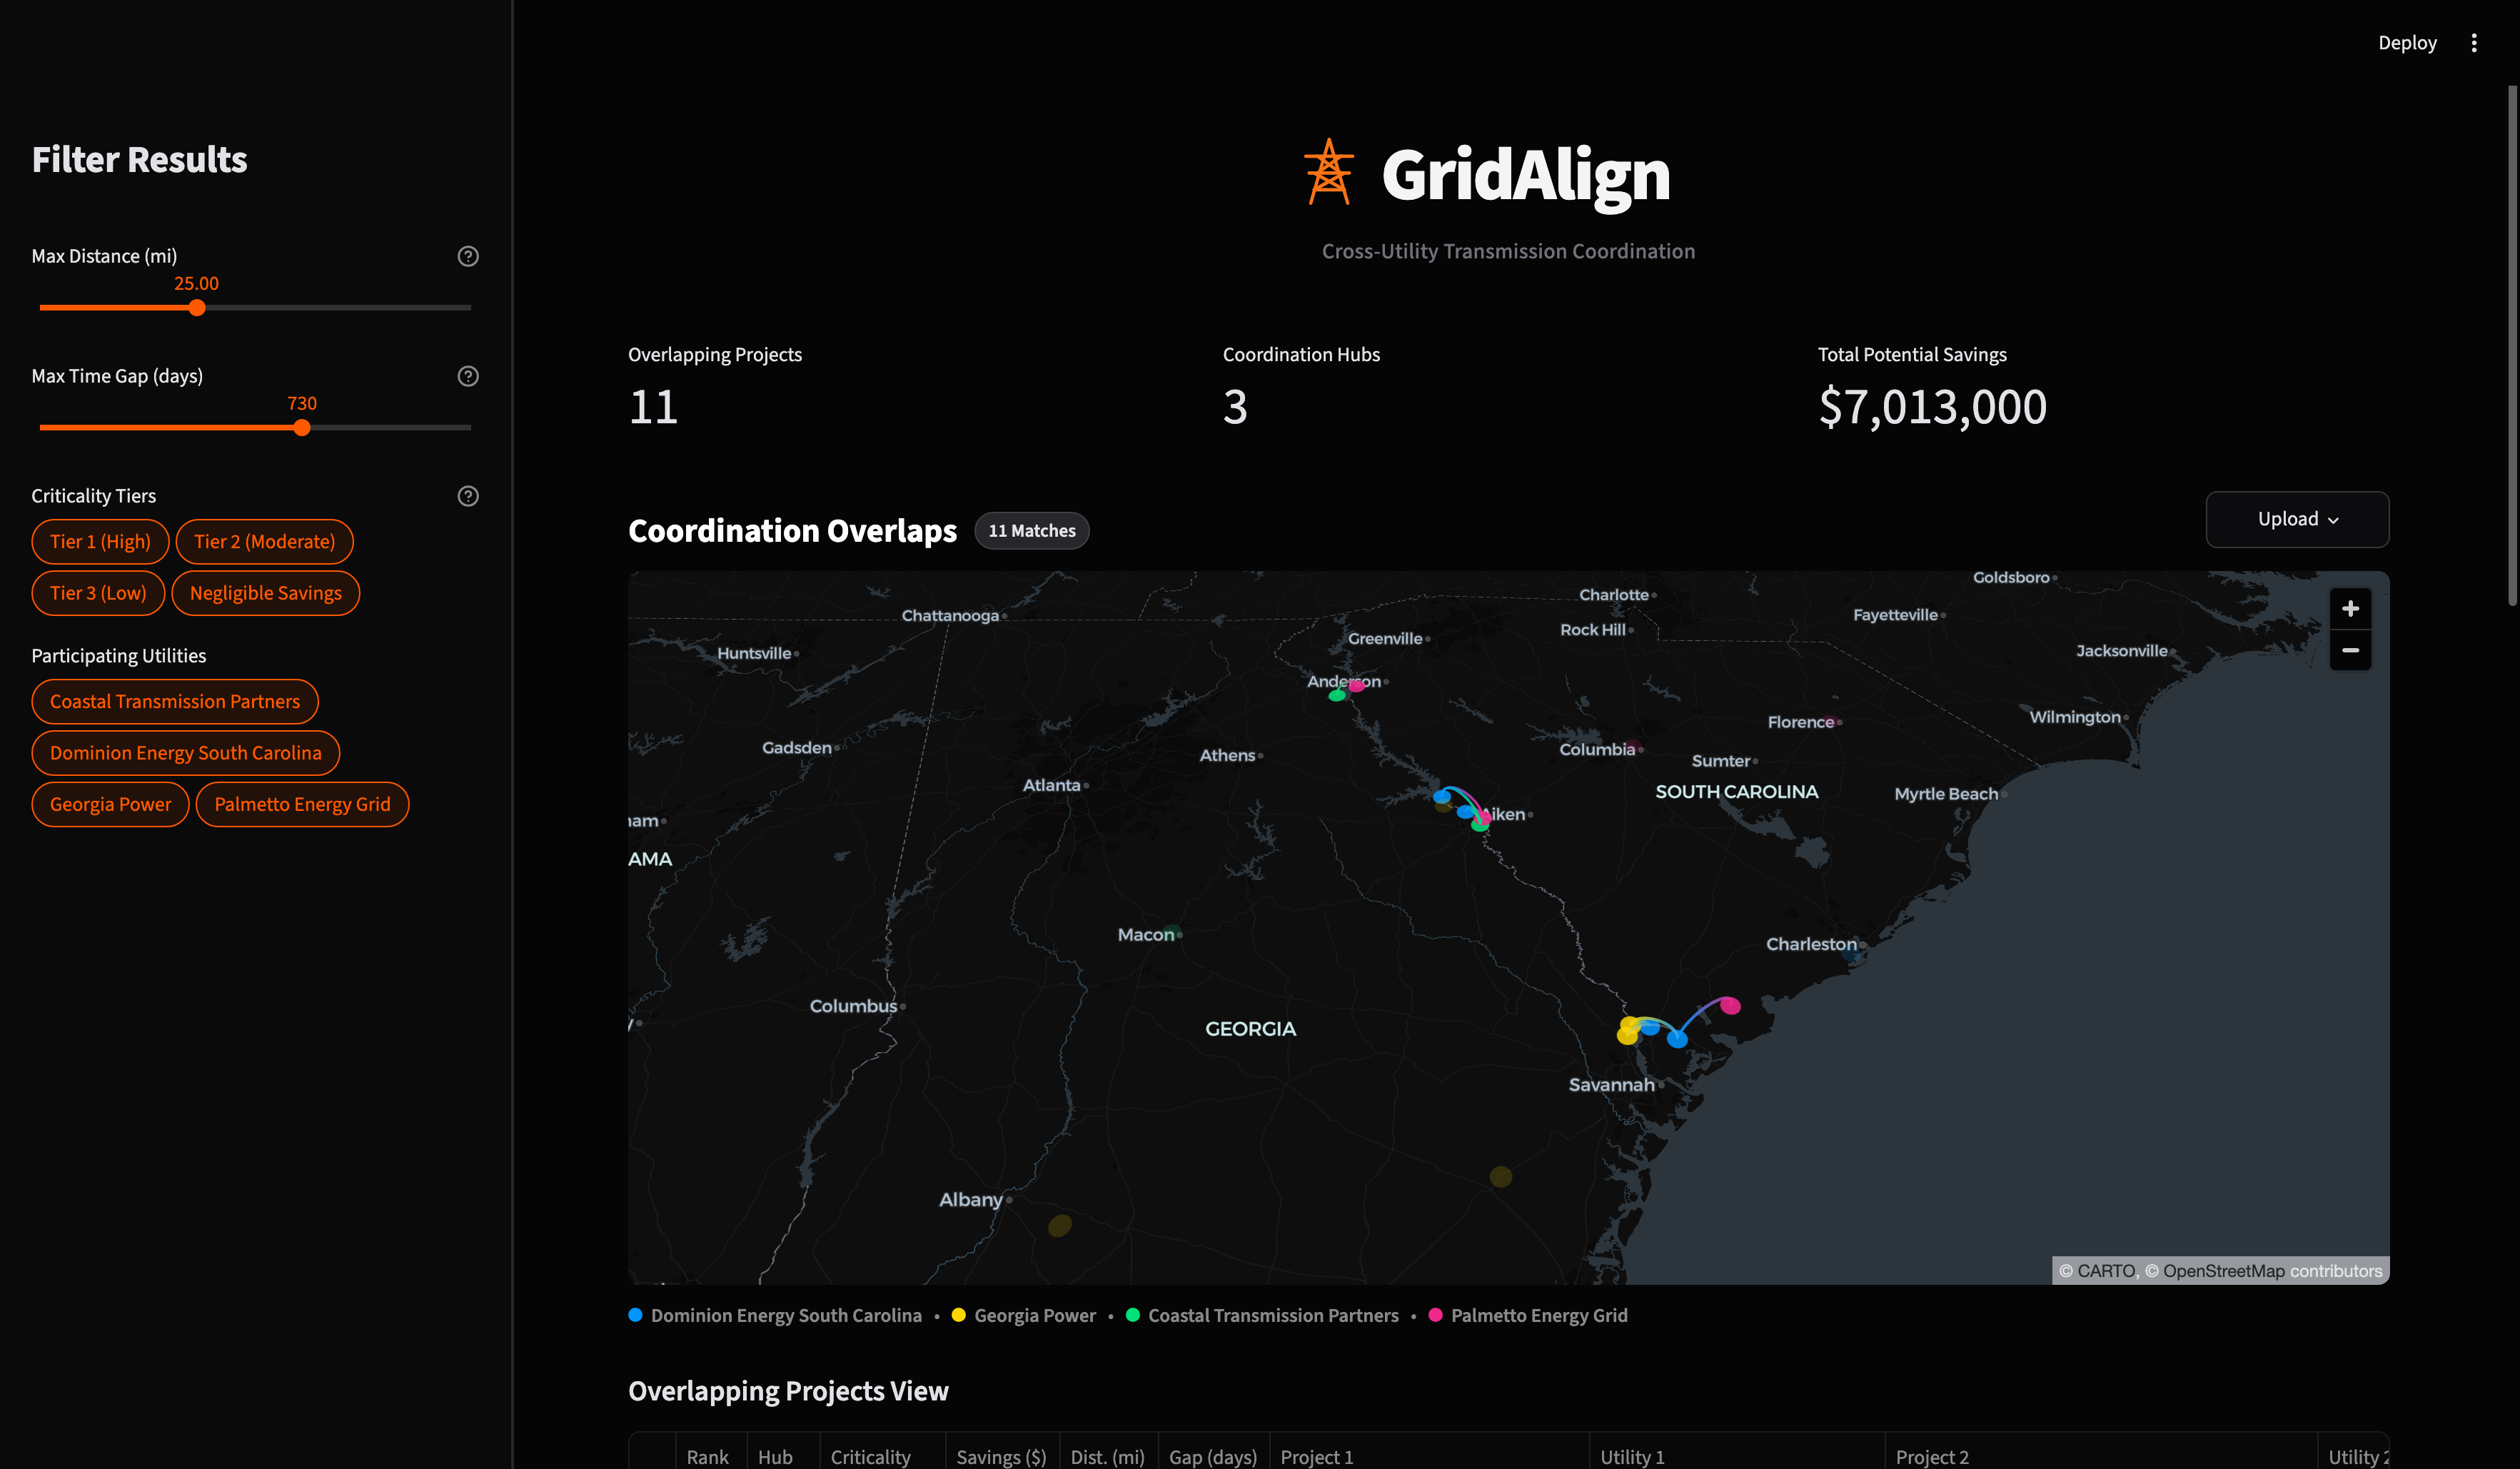
Interactive Map
-
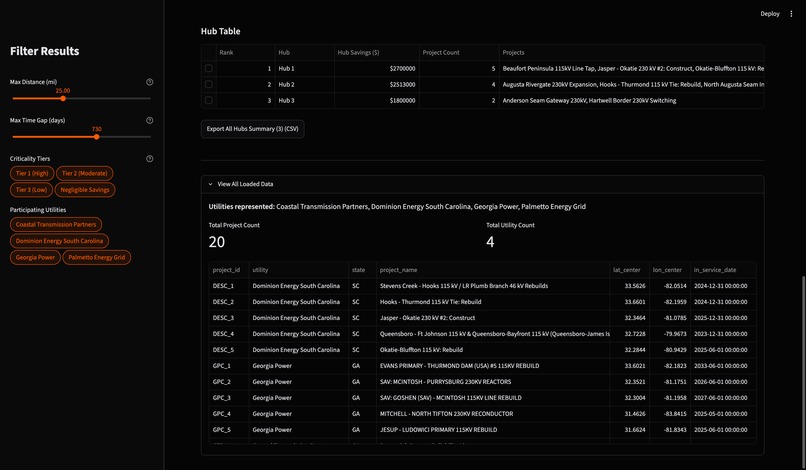
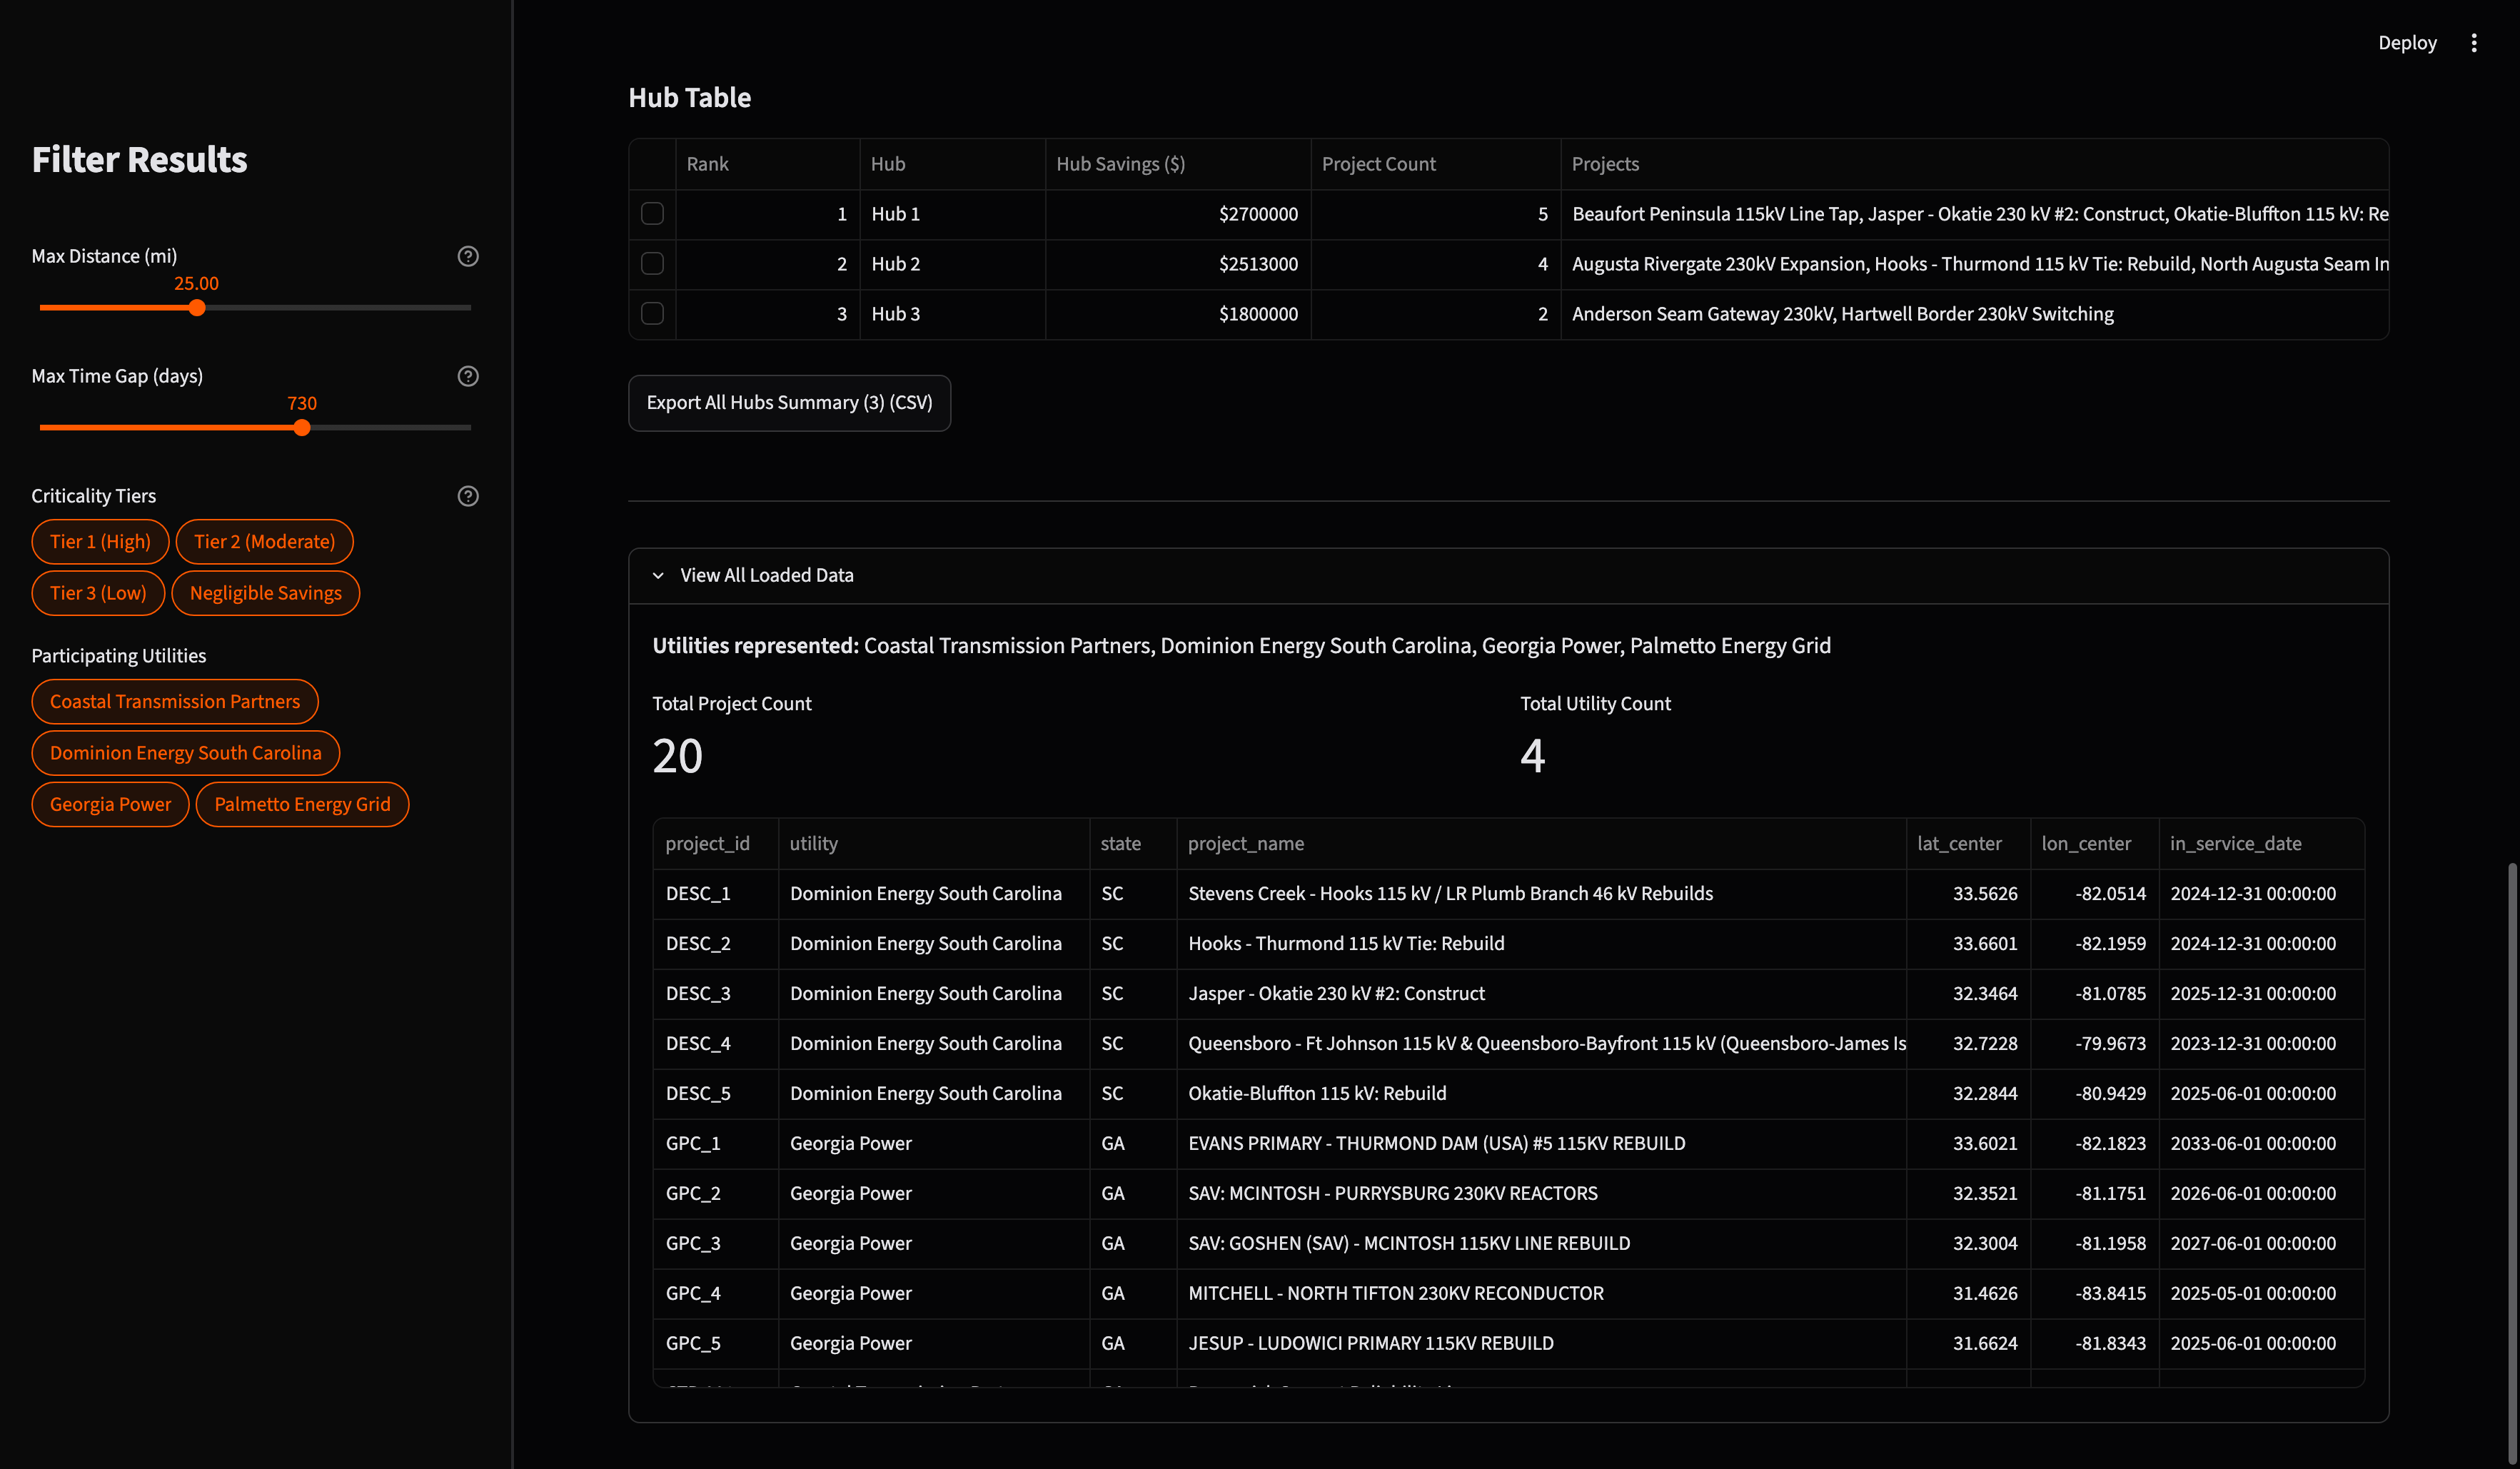
All Loaded Data View
Inspiration
The Sperry Tech sponsor challenge stood out to me because the problem is a real issue that directly affects many utility companies around the country, thus indirectly affecting millions of civilians. Additionally, the solution of the problem could lead to utilities and governments saving millions of dollars, which would get passed on eventually to the consumers. I saw this challenge as the perfect opportunity to streamline a massively inefficient system.
What it does
GridAlign identifies overlapping capital projects across neighboring electric utilities and calculates the cost savings from pooling staging yards, equipment, and labor. Key features include:
- Interactive Geospatial Map: Built with PyDeck to map transmission corridors across utility boundaries. Selecting a project or regional hub dynamically shifts the camera focus and isolates connected lines.
- Regional Hub Clustering: Groups applicable projects into regional clusters (3+ overlapping projects) so utilities can share resources across several projects to maximize savings.
- Cost-Savings Estimation: Determines the total amount saved from sharing equipment and labor from a baseline mobilization cost, decaying realistically across distance (up to 25 miles) and schedule separation (up to 2 years), with non-linear scaling for multi-project clusters.
- Custom Data Upload: Import datasets in CSV or Excel formats to immediately map and compare projects.
- CSV Export: One-click CSV export of hub groupings, project pairings, and cost breakdowns ready for project coordination.
How we built it
GridAlign is built with Python, with a responsive frontend designed with Streamlit. Additionally, PyDeck with custom PathLayer and ScatterplotLayer rendering was used for the interactive map which shows all project locations and shows matched overlapping projects. Pandas was used for data processing and engineering.
Challenges we ran into
- Creating functionality for clusters of 3 or more overlapping projects was difficult, since we needed to estimate the cost of sharing resources across multiple projects without double-counting. Then, deriving actionable insights for these clusters was initially challenging because we needed to create a system distinct from the one for pairs.
- Determining how to estimate cost was also challenging since these costs are not linear. With increasing distances and time gaps came decreased cost savings. This also applied to sharing resources for 3+ projects, since there are diminishing returns for increased project count.
Accomplishments that we're proud of
- Completing my first hackathon
- Building a full, functioning project that solves a real problem all in one day
- The estimation algorithms for cost savings that factored in diminishing returns and the non-linear nature of the costs.
What we learned
- Improved Python and Streamlit skills
- Learned how to use the PyDeck library
- The high costs and inefficiencies of electric utility operations
- How different factors affect cost savings in their each way
What's next for GridAlign
- Compatibility with more types of datasets
- Better actionable insights for utilities
- Improved verification of resource pooling-compatibility

Log in or sign up for Devpost to join the conversation.