Inspiration
Every day during peak demand windows (typically 4:00 PM–9:00 PM), electric utilities fire up high-emission fossil-fuel "peaker" plants to prevent brownouts, causing grid carbon intensity to surge. Despite this, millions of renters, apartment residents, and dorm students have zero real-time visibility into when their local grid is dirtiest—and existing utility demand-response programs require expensive smart-home hardware, take months to pay out, and exclude renters altogether.
On top of that, legacy payment rails like Stripe charge roughly $0.30 per transaction, making small, frequent behavioral rewards (such as a $0.15 energy-saving bounty) economically impossible. GridPulse started with a simple idea: turn any household or dorm room into a virtual power plant node that streams live telemetry, alerts users during dirty grid spikes, verifies real-time load reductions, and pays out instant sub-cent micro-bounties on Solana.
What It Does
GridPulse closes the loop between real-time grid carbon awareness and instant financial incentives:
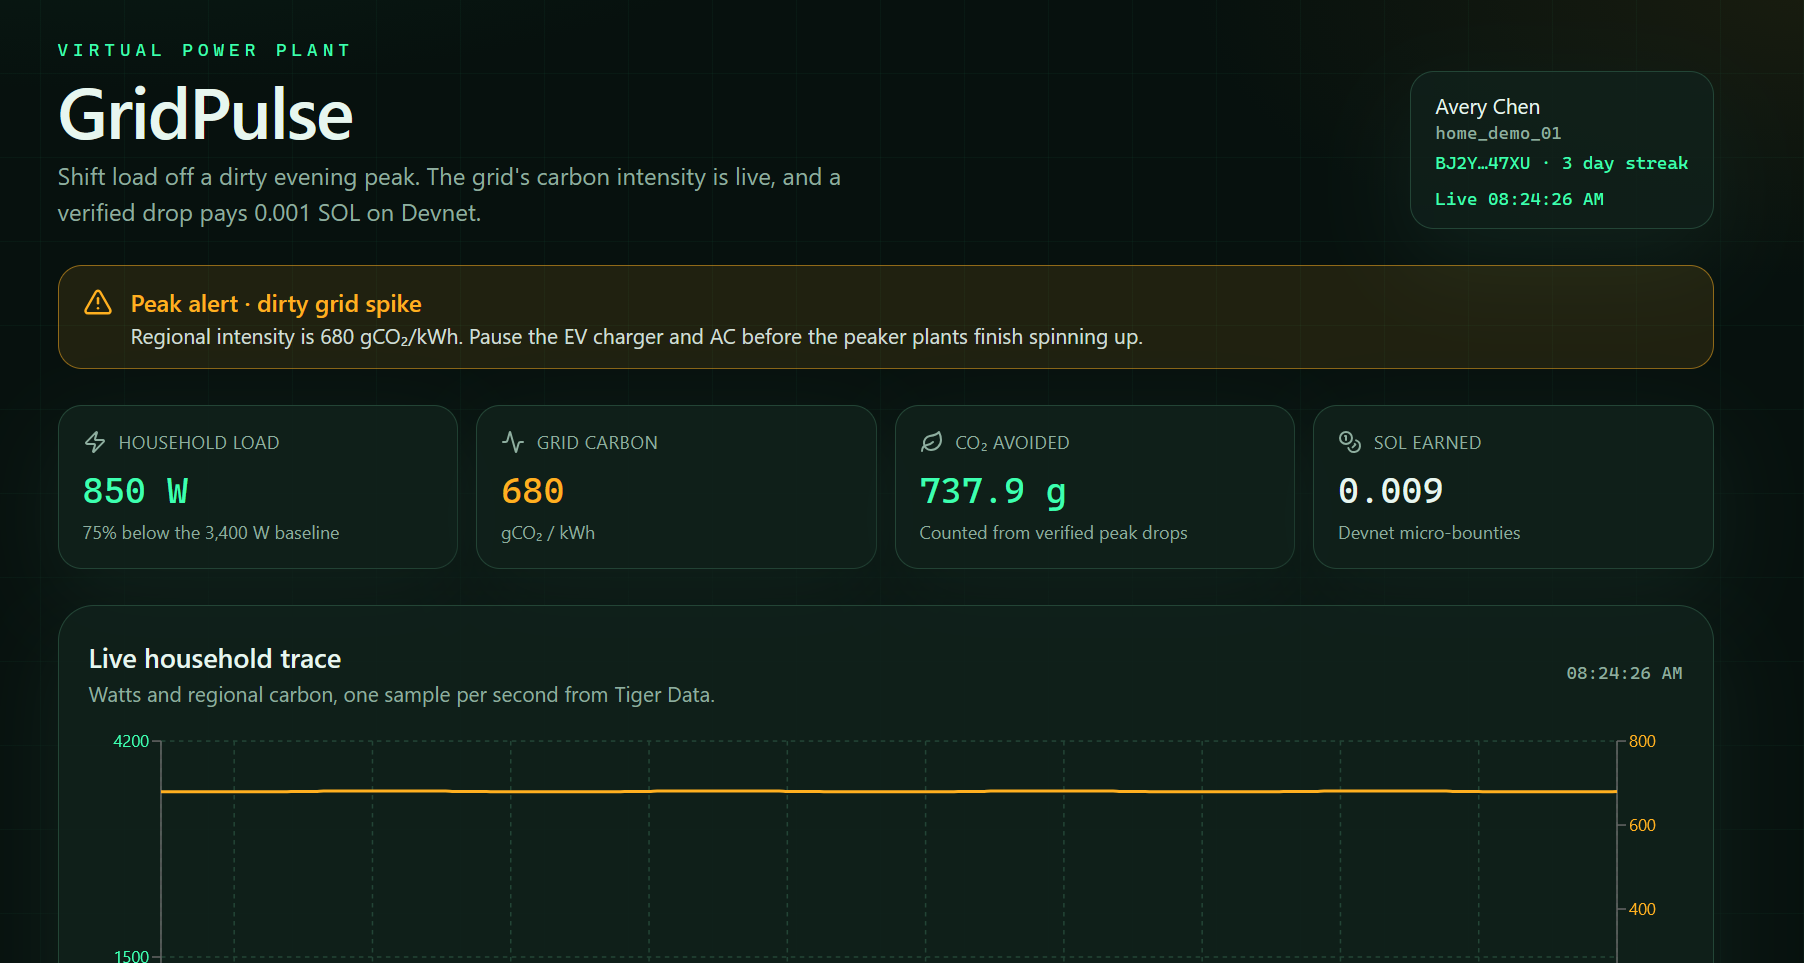
- Live Virtual Power Plant Telemetry: Streams 1-second household wattage and regional grid carbon intensity (gCO₂/kWh) into Tiger Data, powering lag-free real-time charts.
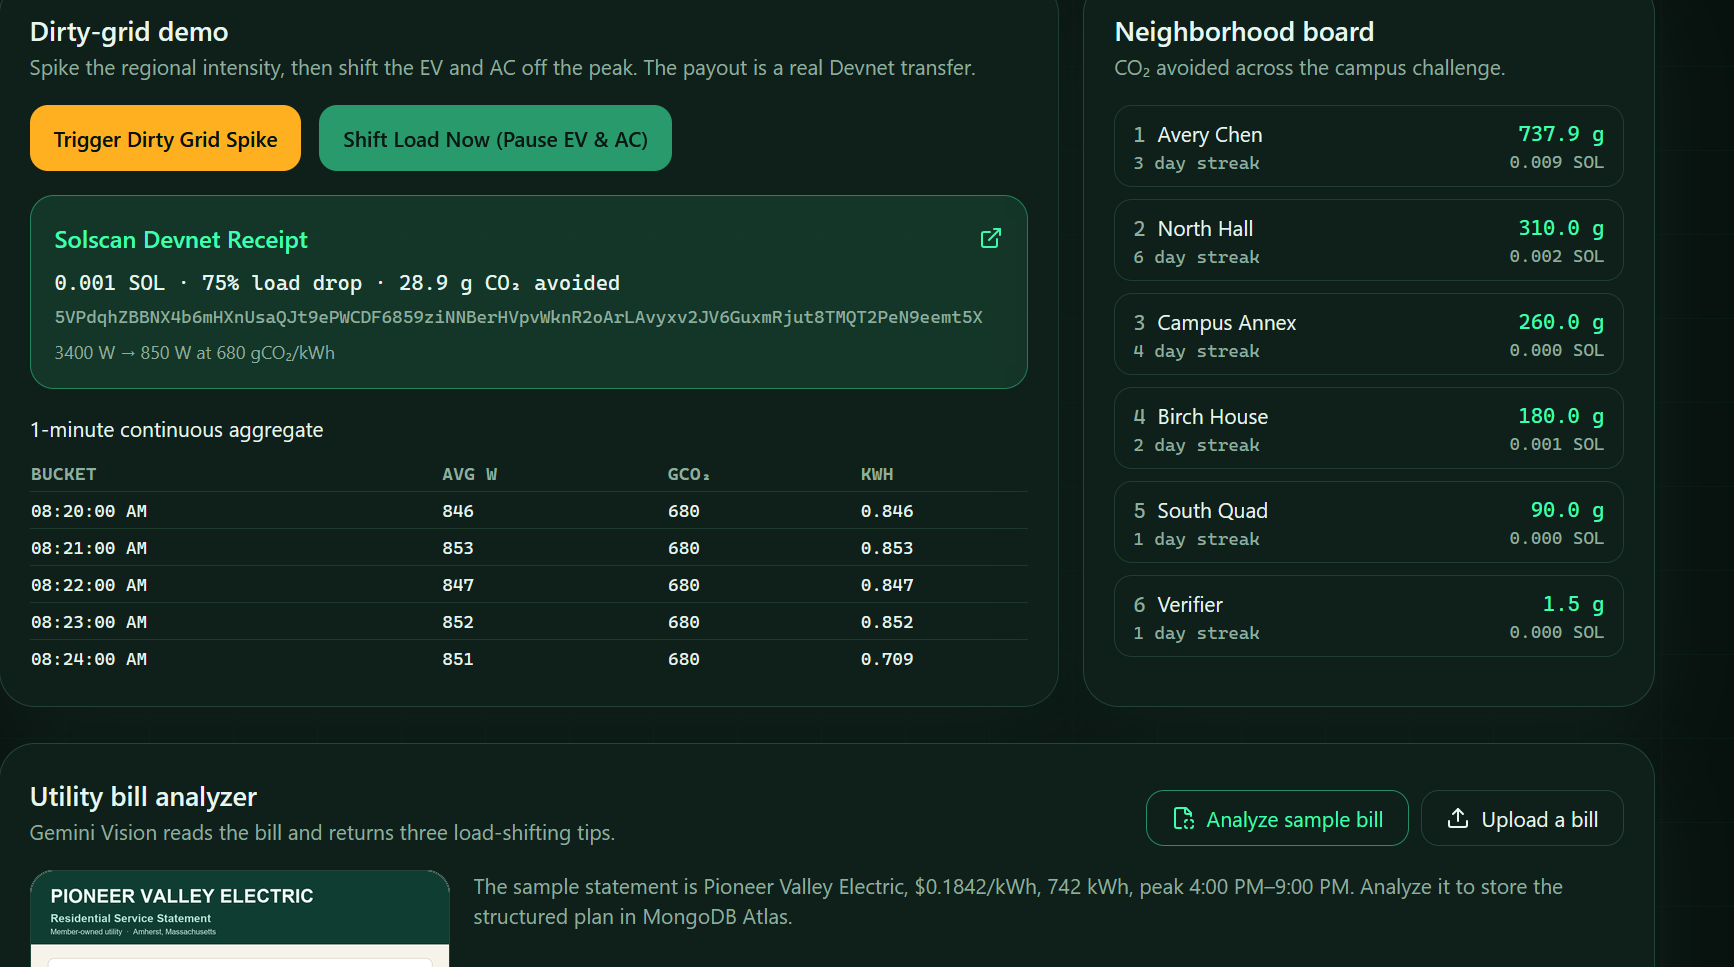
- AI Utility Bill & Appliance Coach: Users upload a photo of their electric bill (or test with a generated sample bill), and Google Gemini extracts their utility provider, kWh rate, peak hours, and three personalized load-shifting tips.
- One-Click Peak Reduction & Instant Solana Micro-Payouts: When a dirty grid spike hits (jumping from 210 to 680 gCO₂/kWh), users click Shift Load Now (Pause EV & AC) to drop household draw from ≈ 3,400 W to ≈ 850 W. GridPulse calculates the avoided CO₂, executes a real Solana Devnet micro-payout (0.001 SOL), stores the receipt in MongoDB Atlas, and displays a clickable Solscan Devnet proof link.
How I Built It
I built GridPulse as a containerized full-stack application with a Python 3.11+ FastAPI backend and a Next.js (App Router), TypeScript, and Tailwind CSS dashboard:
- Tiger Data (TimescaleDB): Using psycopg v3, my background simulator ingests per-second household wattage and carbon readings into a compressed PostgreSQL hypertable. Pre-computed Continuous Aggregates (1-minute time buckets with real-time aggregation) serve live dashboard charts with zero query lag.
- Google Gemini API: Using Gemini 3.6 Flash with structured JSON outputs via the official Google GenAI SDK, GridPulse parses utility bill images (including a generated sample bill for Pioneer Valley Electric at $0.1842/kWh and 742 kWh usage) into structured schedules and actionable energy-saving tips.
- Solana Devnet: Because Solana confirms transactions in seconds with near-zero fees, my backend sends real on-chain Devnet micro-bounties the moment a load drop is verified and surfaces a live Solscan explorer link for one-click verification.
- MongoDB Atlas: Stores asynchronous JSON documents across three collections—users (profiles, Solana wallets, cumulative CO₂ saved), parsed bills (Gemini Vision extractions), and payout receipts (verified wattage drops and Solana transaction signatures).
- Vultr & GoDaddy Registry: Deployed via Docker Compose (backend, frontend, and Caddy) on a Vultr Cloud Compute server (2 GB RAM) and served over automatic Let's Encrypt HTTPS at https://grid-pulse.garden, registered through GoDaddy Registry.
- Cursor + Grok Bot: I used Cursor (guided by SPEC.md, AGENTS.md, and an end-to-end verification script) alongside Grok 4.7 to build and test the repository. I also set up a Grok Bot GitHub automation routine triggered on pull requests and pushes to main that continuously audits commits against my spec, checks for leaked secrets or missing environment variables, and opens PRs to keep CI checks green.
Modeling Load Reduction & Carbon Impact
During a peak grid event where regional carbon intensity rises from 210 gCO₂/kWh to 680 gCO₂/kWh, shifting high-draw appliances reduces household power demand from initial draw to curtailed draw:
$$\Delta P = P_{\text{before}} - P_{\text{after}} \approx 3,400\text{ W} - 850\text{ W} = 2,550\text{ W} = 2.55\text{ kW}$$
Over an event duration Δt (in hours), total energy curtailed and avoided carbon emissions
Built With
- caddy
- climate-tech
- cursor
- docker
- fastapi
- gemini
- godaddy
- grok-bot
- mongodb
- mongodb-atlas
- nextjs
- postgresql
- python
- recharts
- solana
- sustainability
- tailwindcss
- tiger-data
- timescaledb
- typescript
- vultr
- web3
