Inspiration
I started with a surprisingly simple question:
Does it matter when we use electricity, not just how much we use?
That question came from something extremely familiar: screen time.
Our phones already tell us how long we've been using them. But electricity is also changing around us throughout the day. The sources supplying a regional power grid can change, which means the carbon intensity of that electricity can change too.
I found that large-scale technology systems already respond to this idea. For example, flexible computing workloads can be shifted toward times or locations where cleaner electricity is available.
That made me wonder:
What if ordinary people could understand those changing conditions too?
I didn't want to build another carbon calculator that gives someone a number and sends them away.
I wanted to turn an invisible environmental signal into a decision people could actually interact with.
That's where GridGuardian came from.
What it does
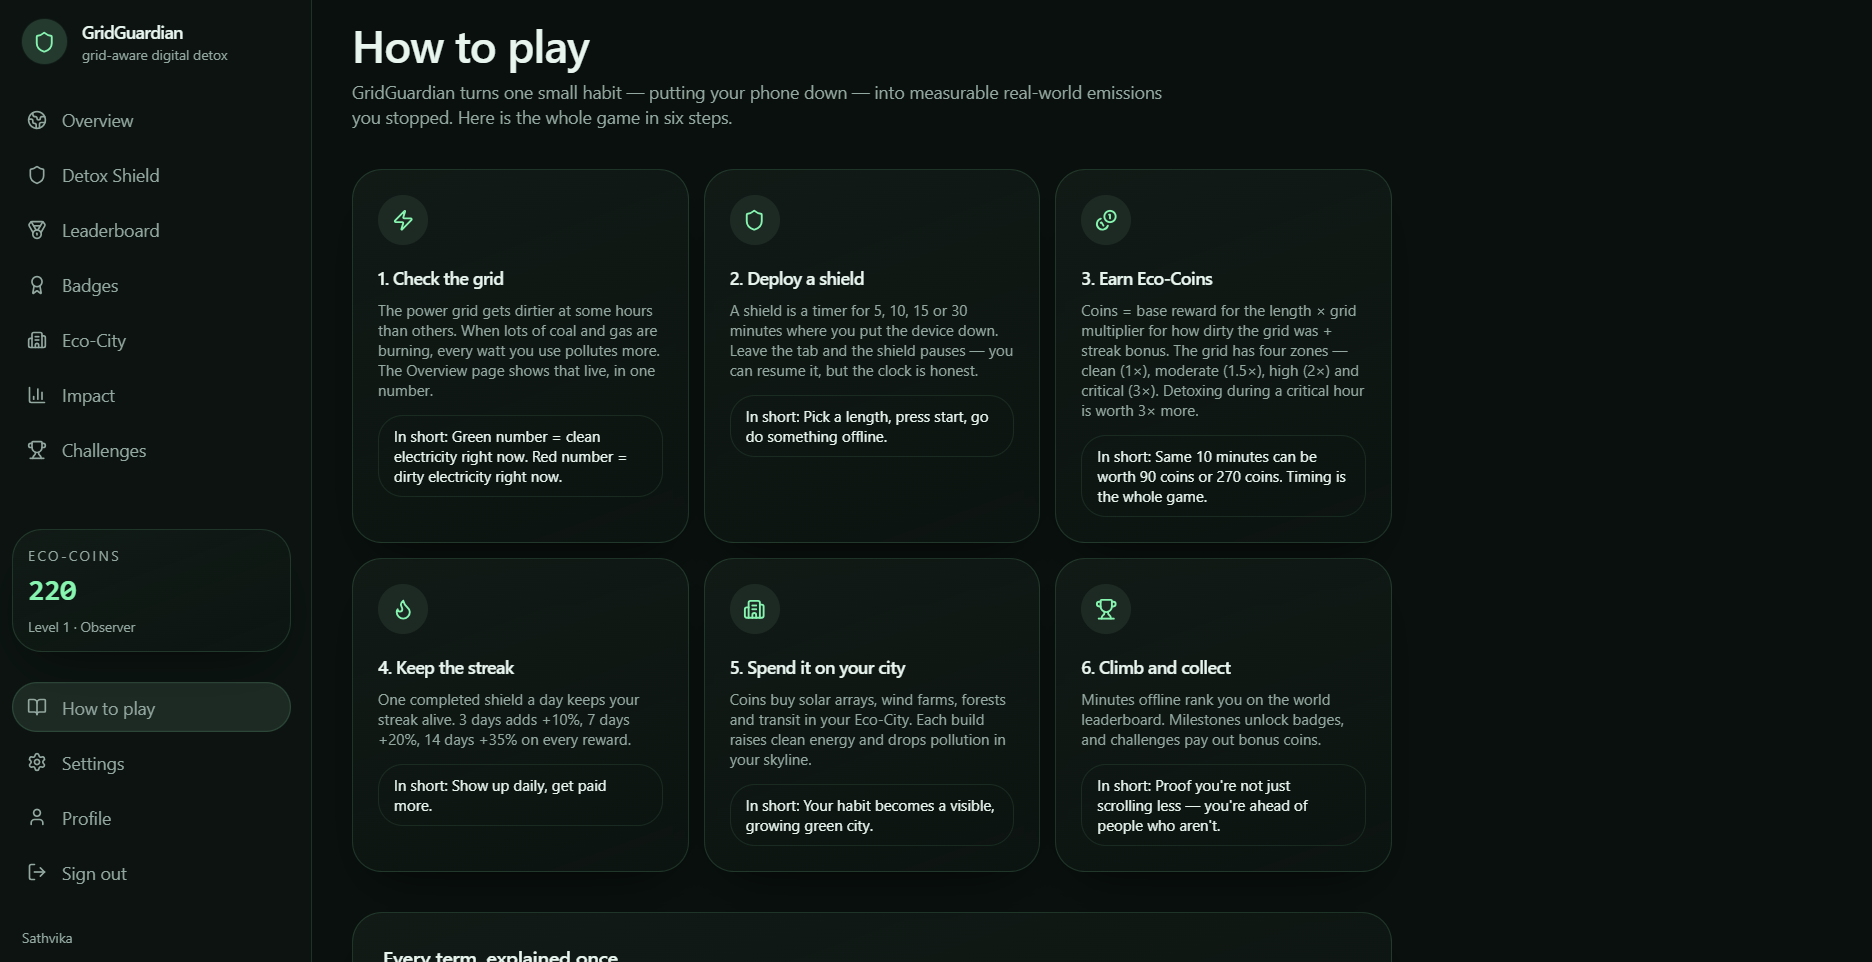
GridGuardian connects digital wellbeing with changing electricity conditions.
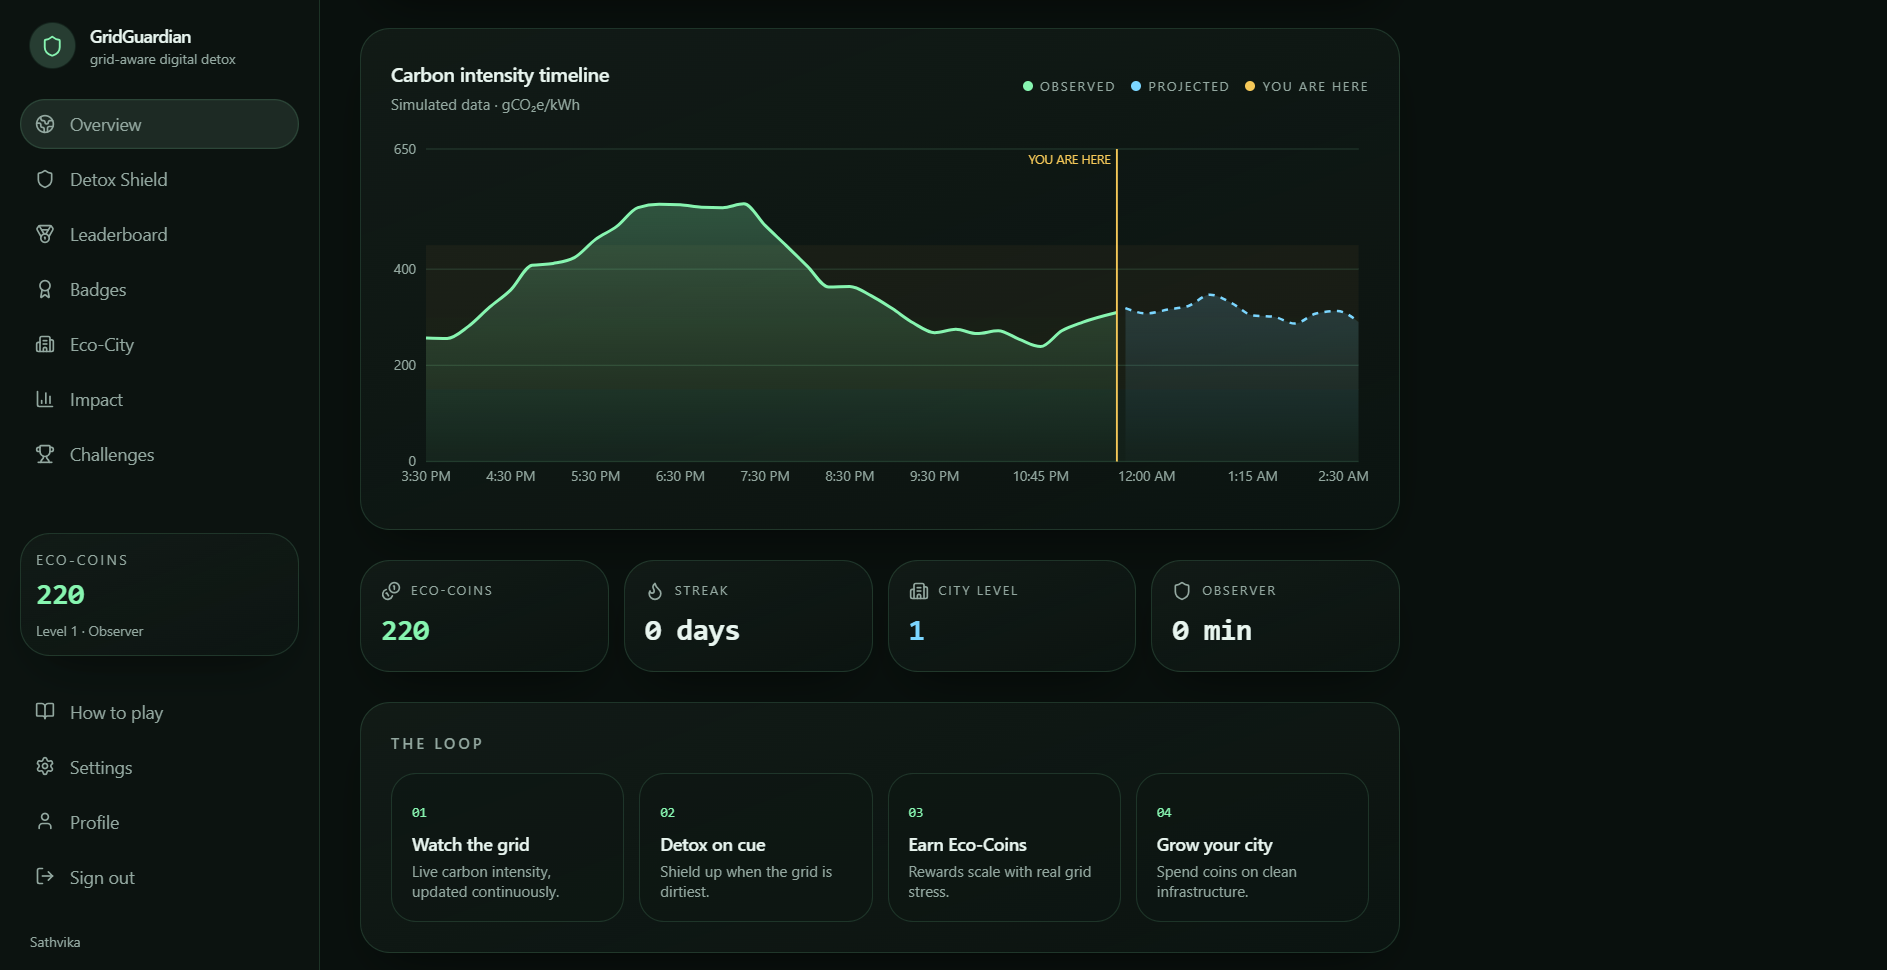
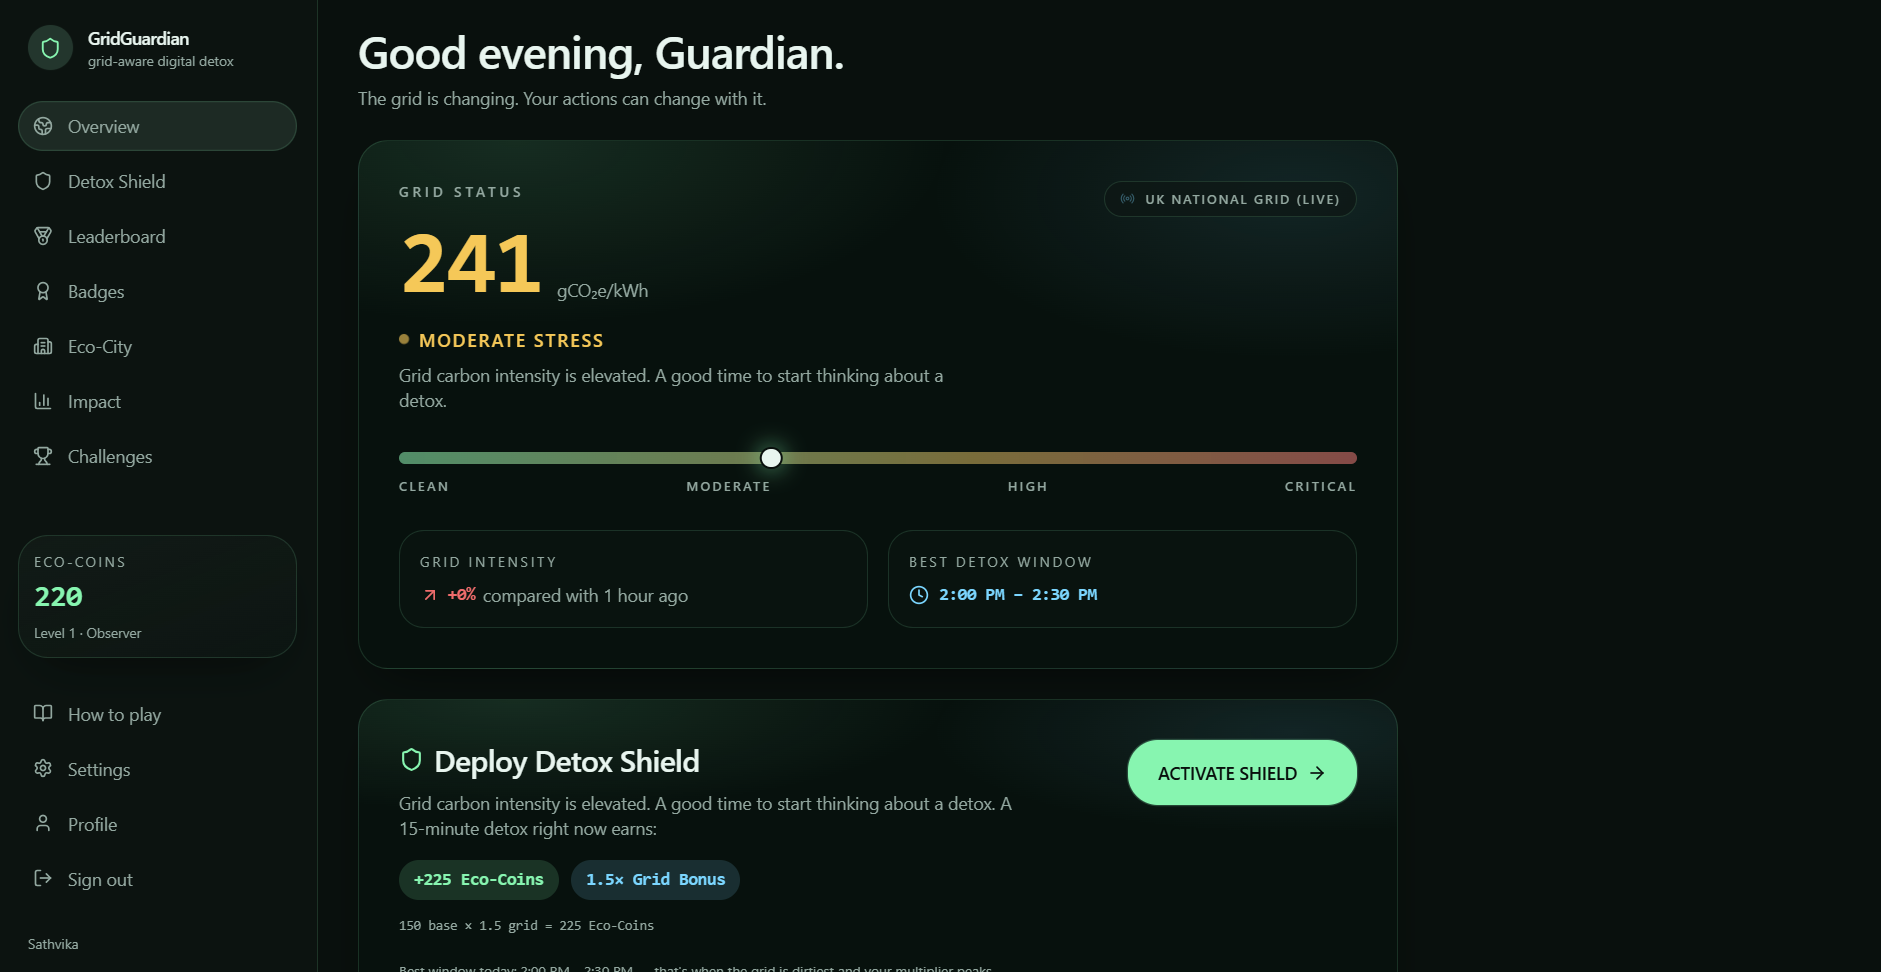
The experience begins with a simple dashboard showing the current carbon-intensity signal and its trend.
Instead of overwhelming users with energy data, GridGuardian translates that information into an understandable recommendation.
For example:
“This could be a good time for a short break.”
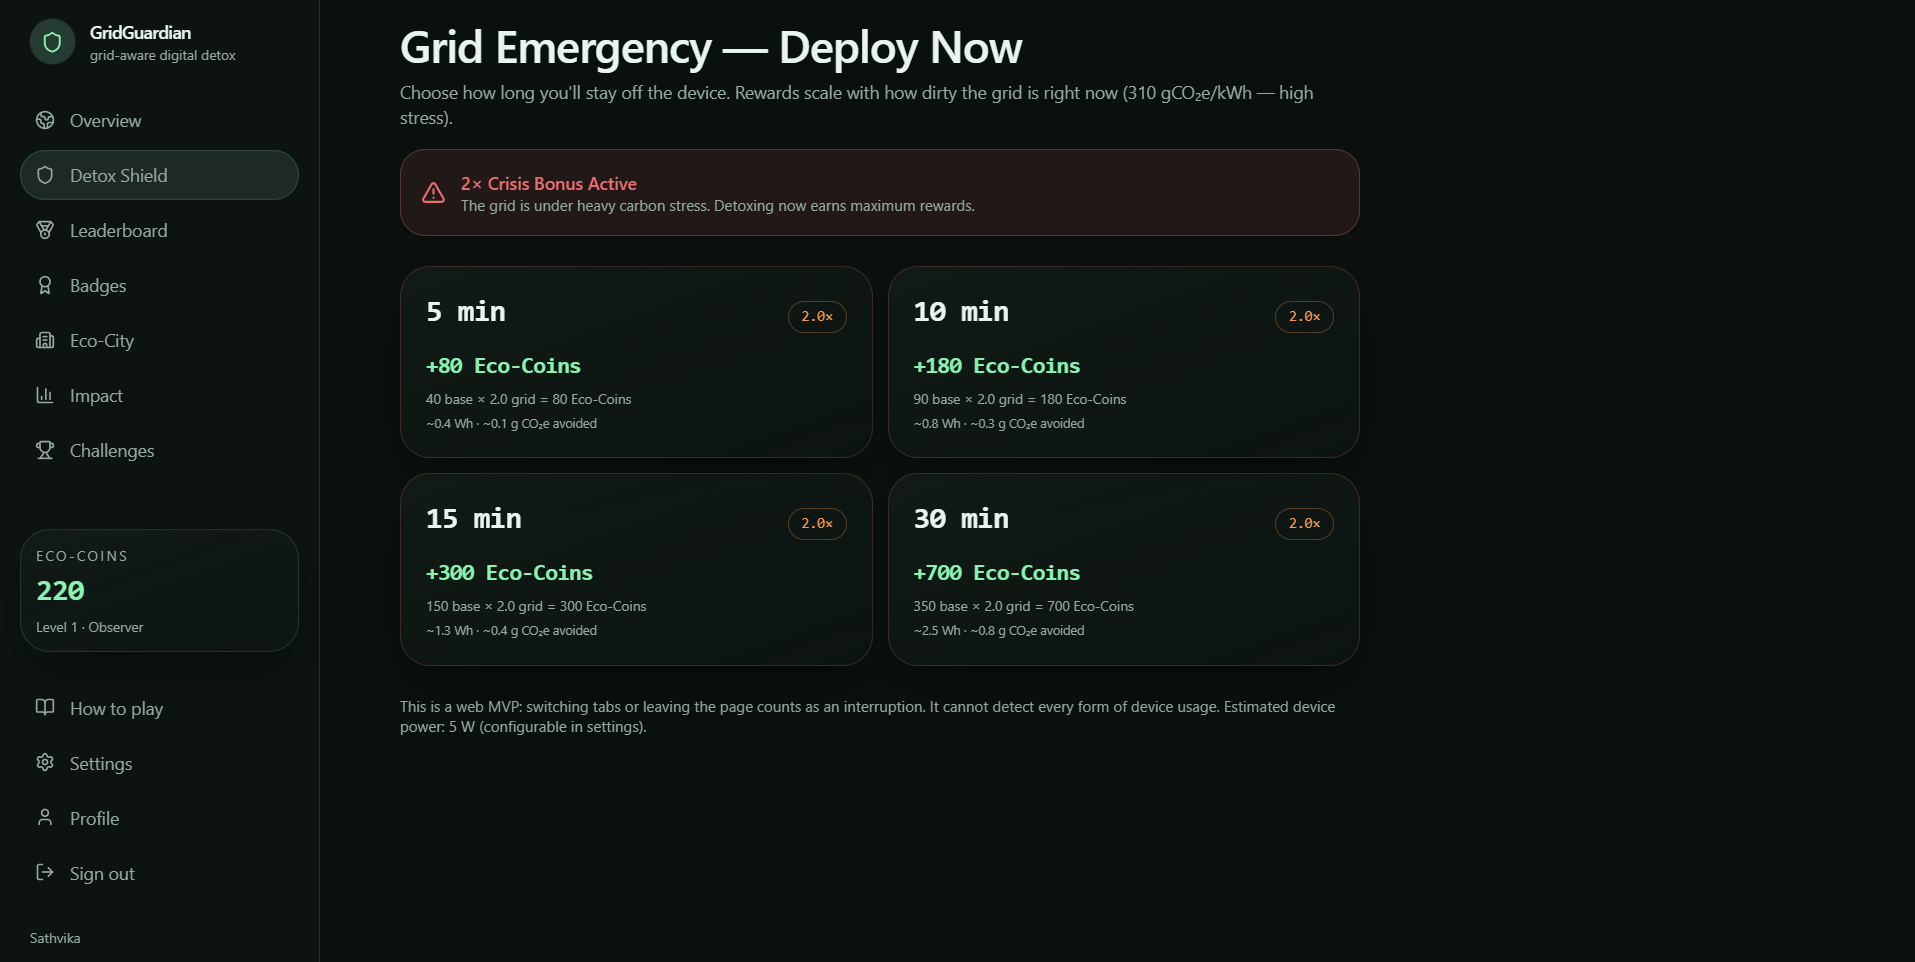
Users can then activate a Detox Shield and choose a duration.
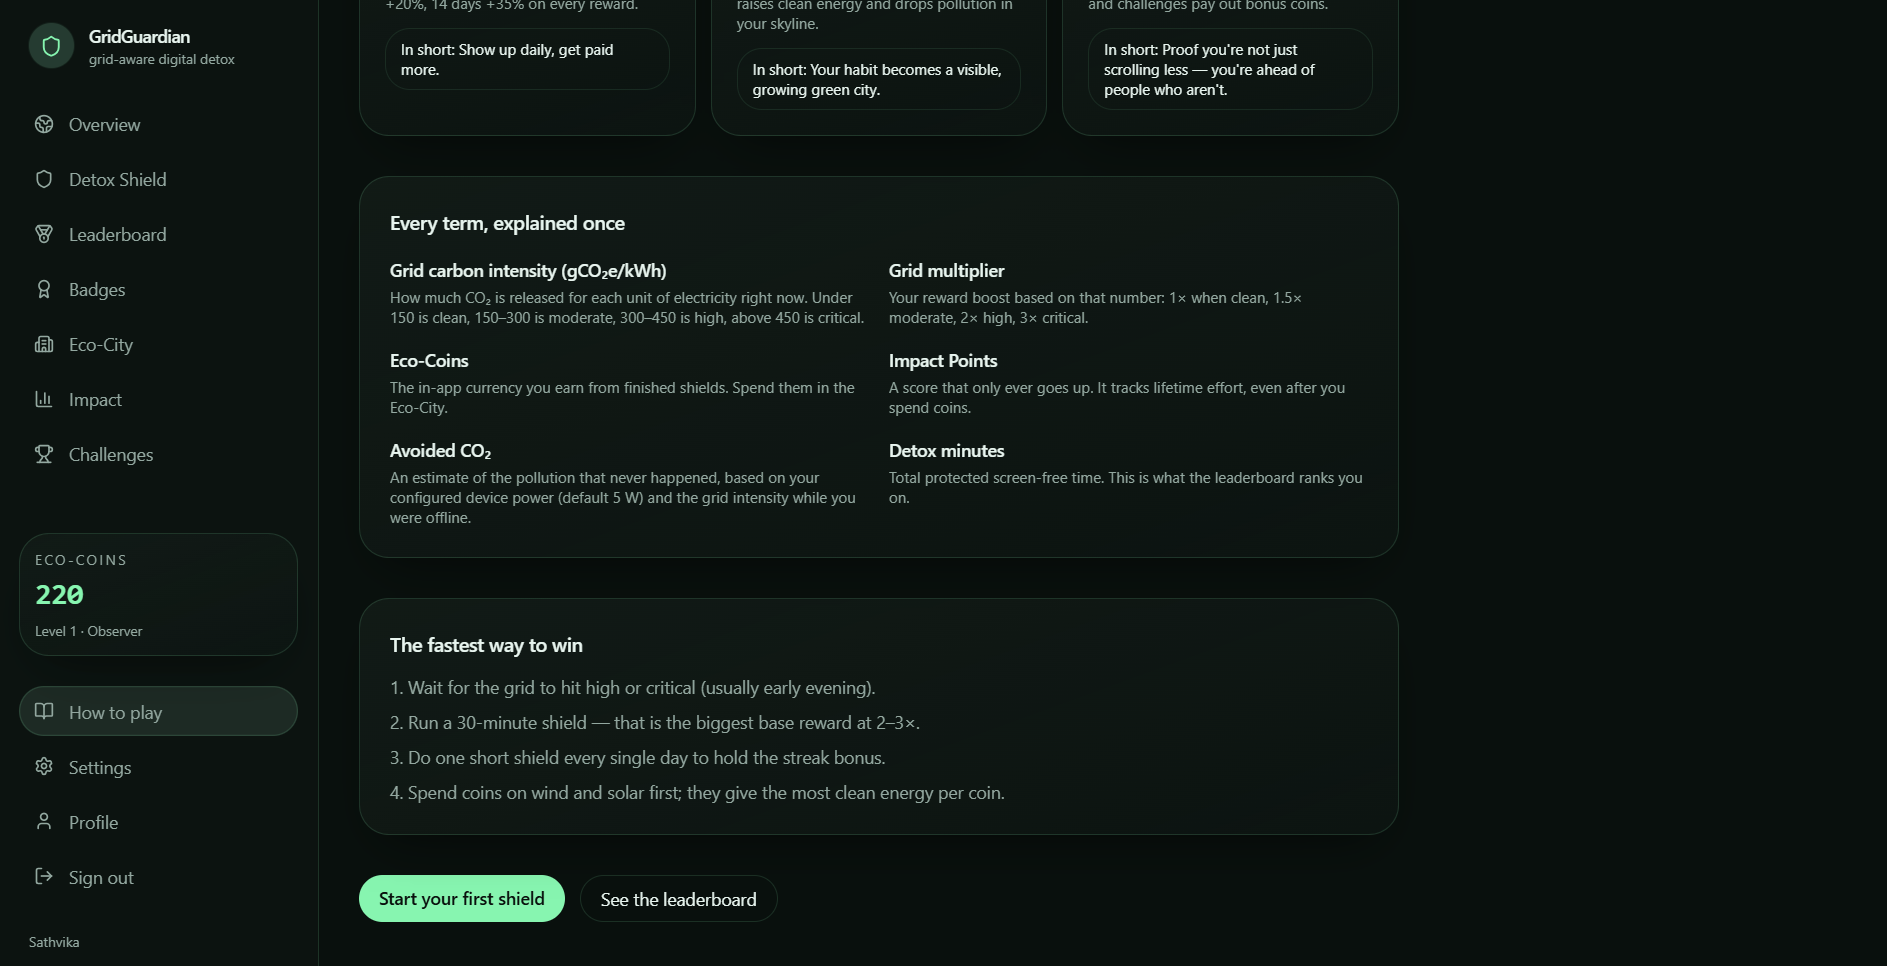
During the session, GridGuardian runs a countdown and tracks the detox session. Completing the session earns Eco-Coins, with rewards determined by the session duration and the application's grid-condition model.
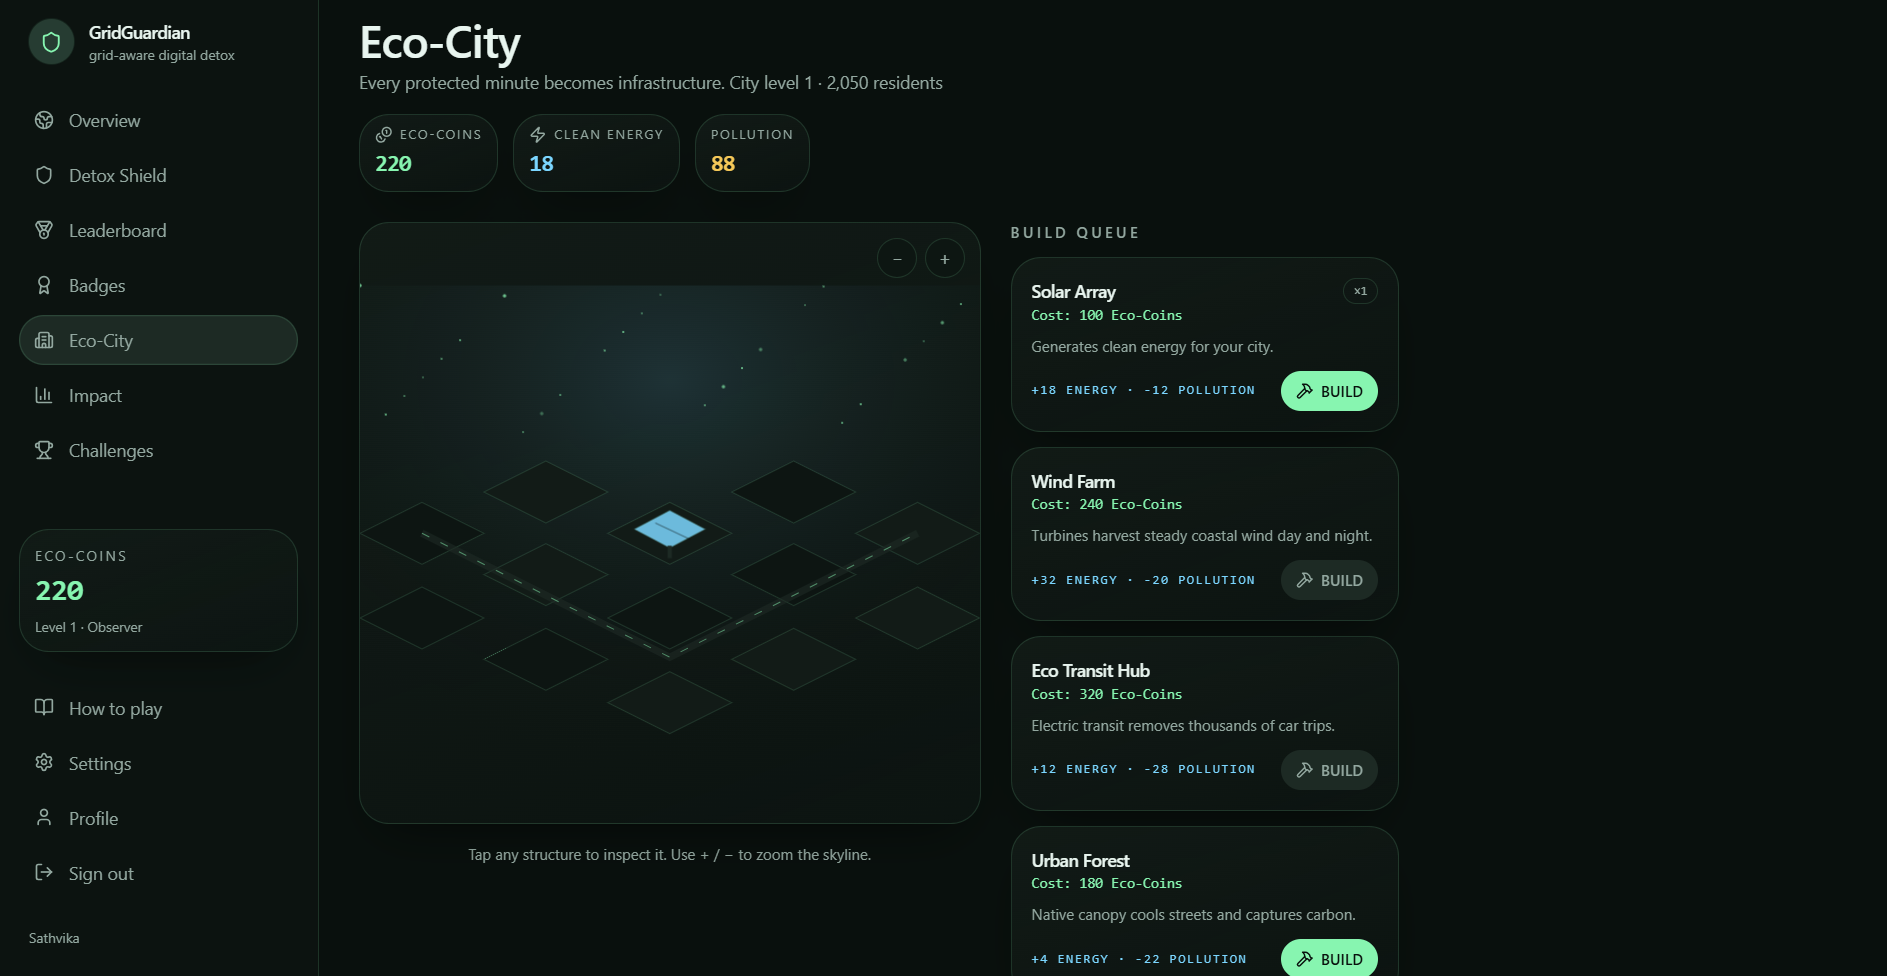
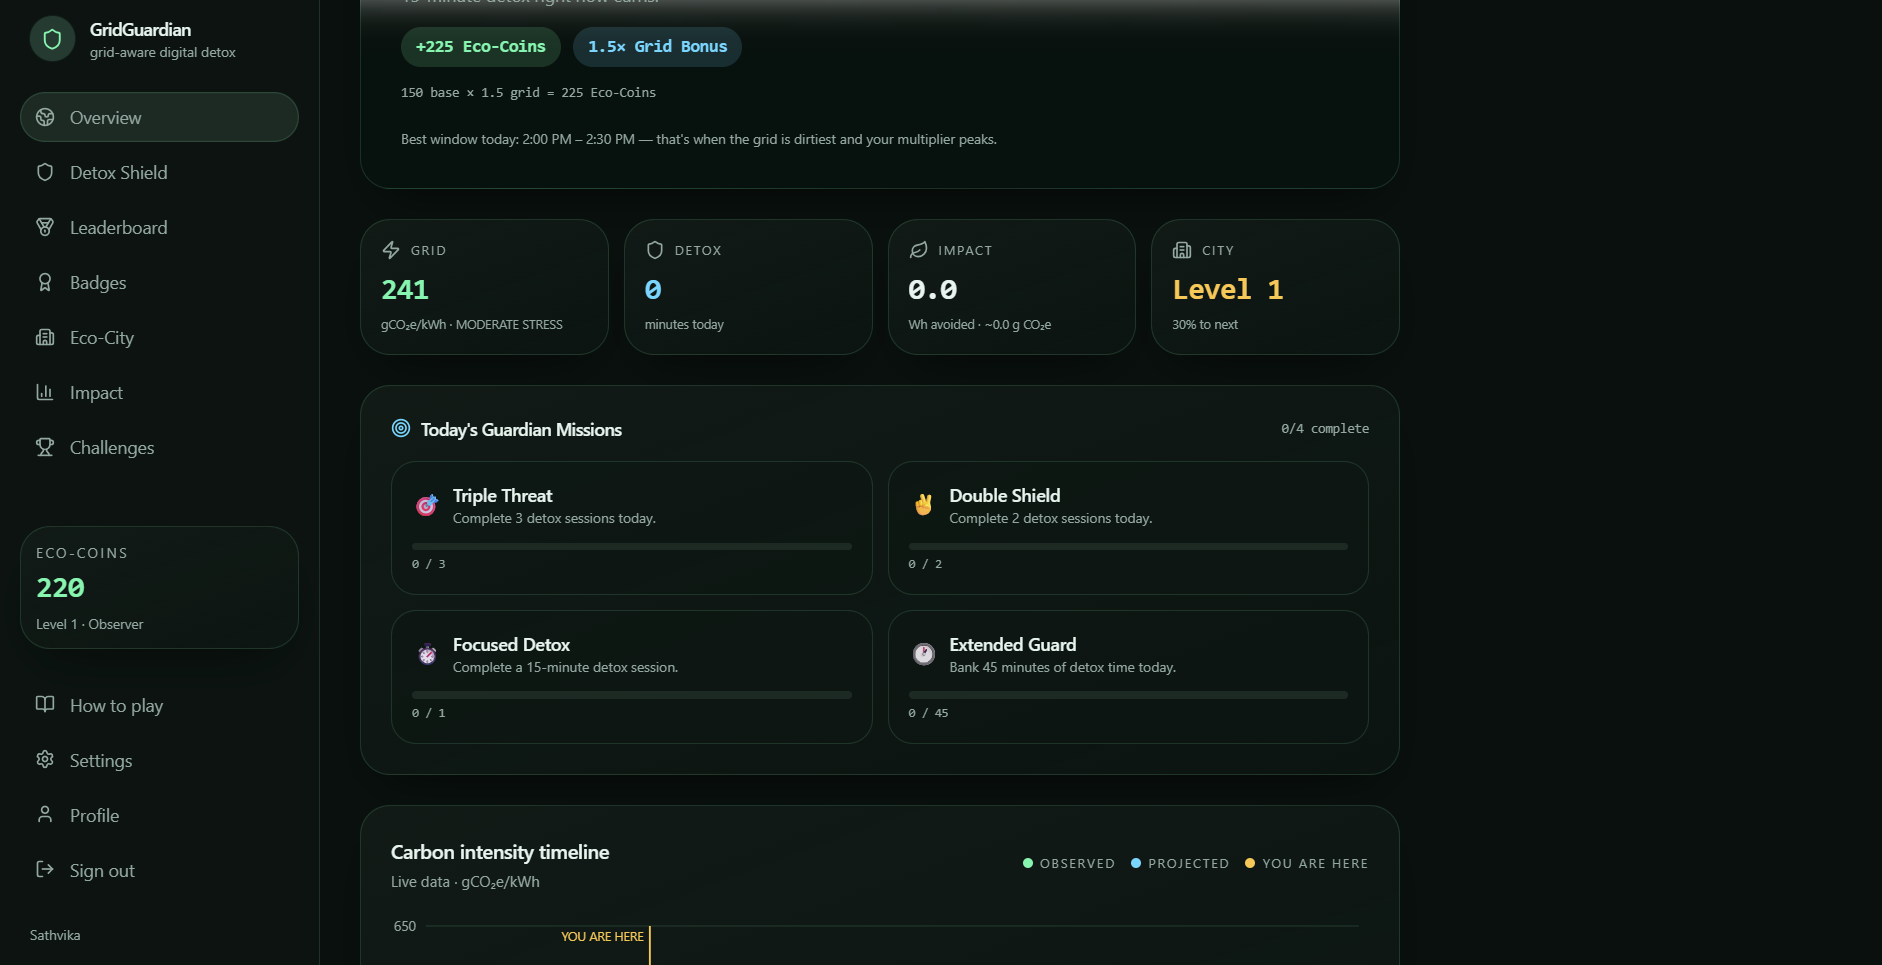
Those Eco-Coins can then be used inside the Eco-City, where users build virtual sustainable infrastructure such as:
- Solar farms
- Wind turbines
- Green spaces
- Sustainable buildings
- Clean transportation
GridGuardian also tracks:
- Detox time
- Completed sessions
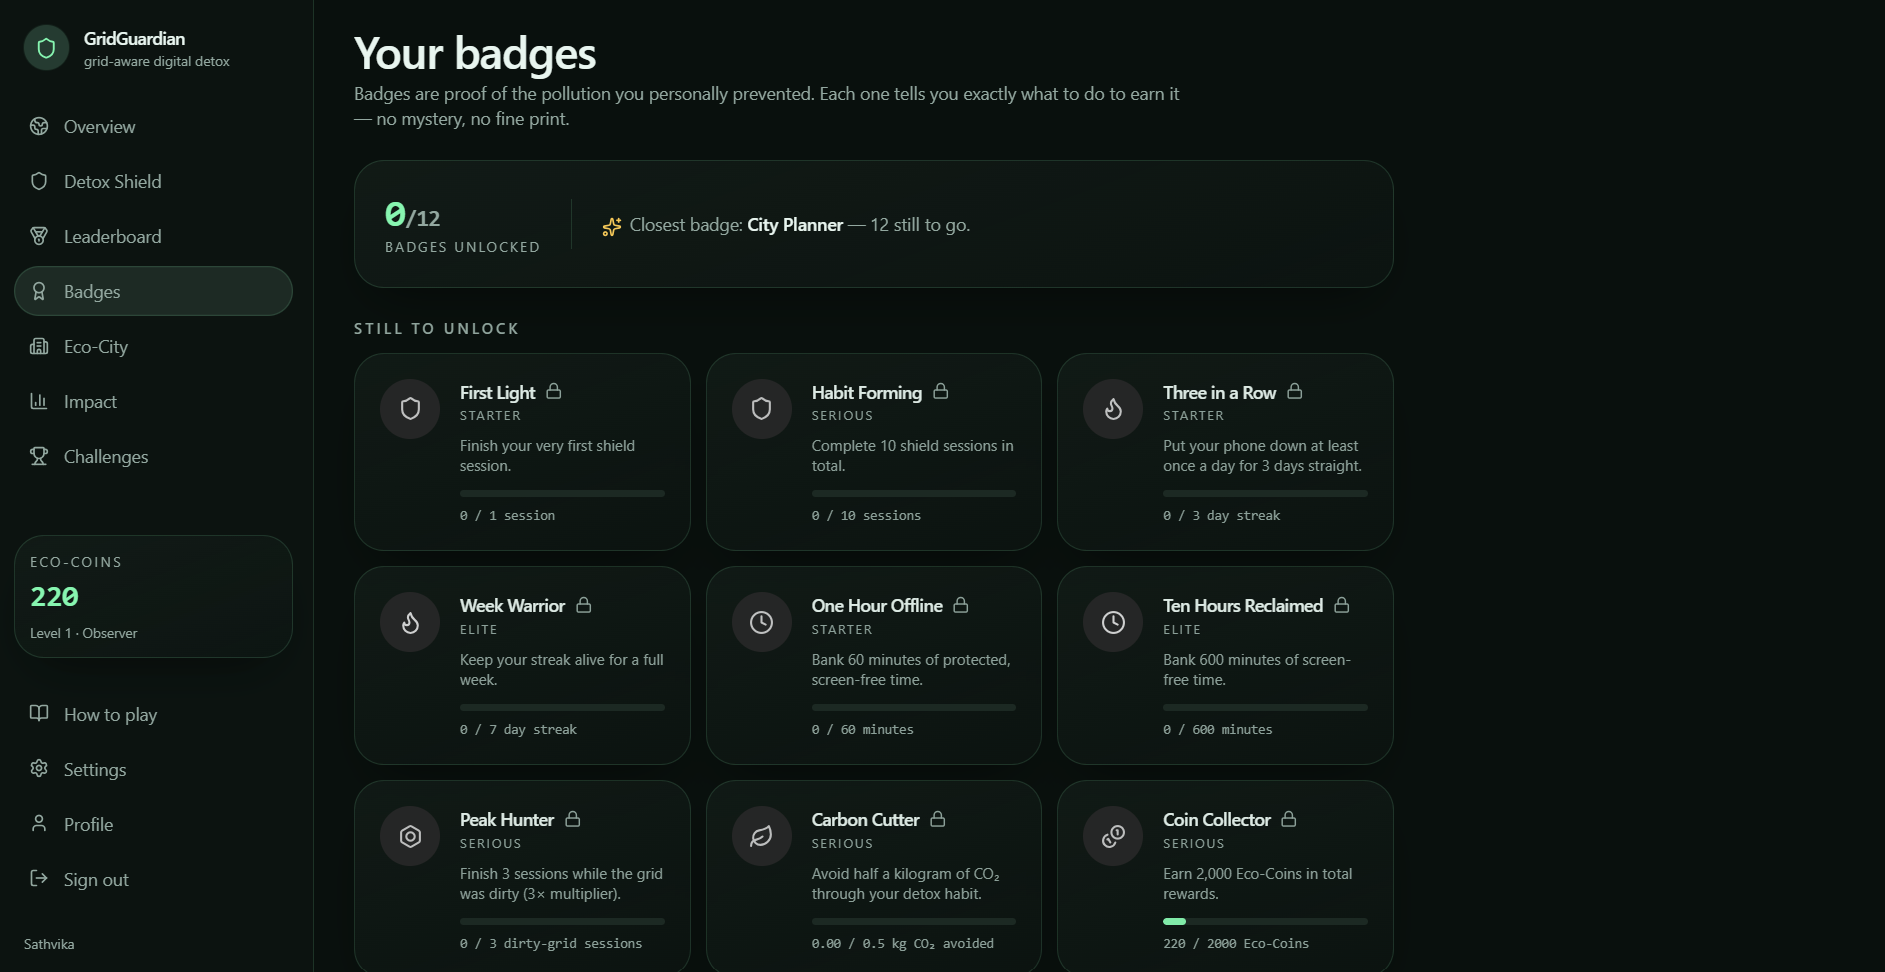
- Streaks
- Eco-Coins
- Grid conditions during sessions
- Modeled environmental impact
The goal isn't to claim that one person putting down their phone magically removes a specific amount of carbon.
The goal is to make people aware that electricity conditions change, and that some flexible behavior can potentially be shifted.
How we built it
GridGuardian was designed as a modular system rather than a static dashboard.
Grid Data Layer
The application receives regional carbon-intensity information and converts it into a simple grid-status signal.
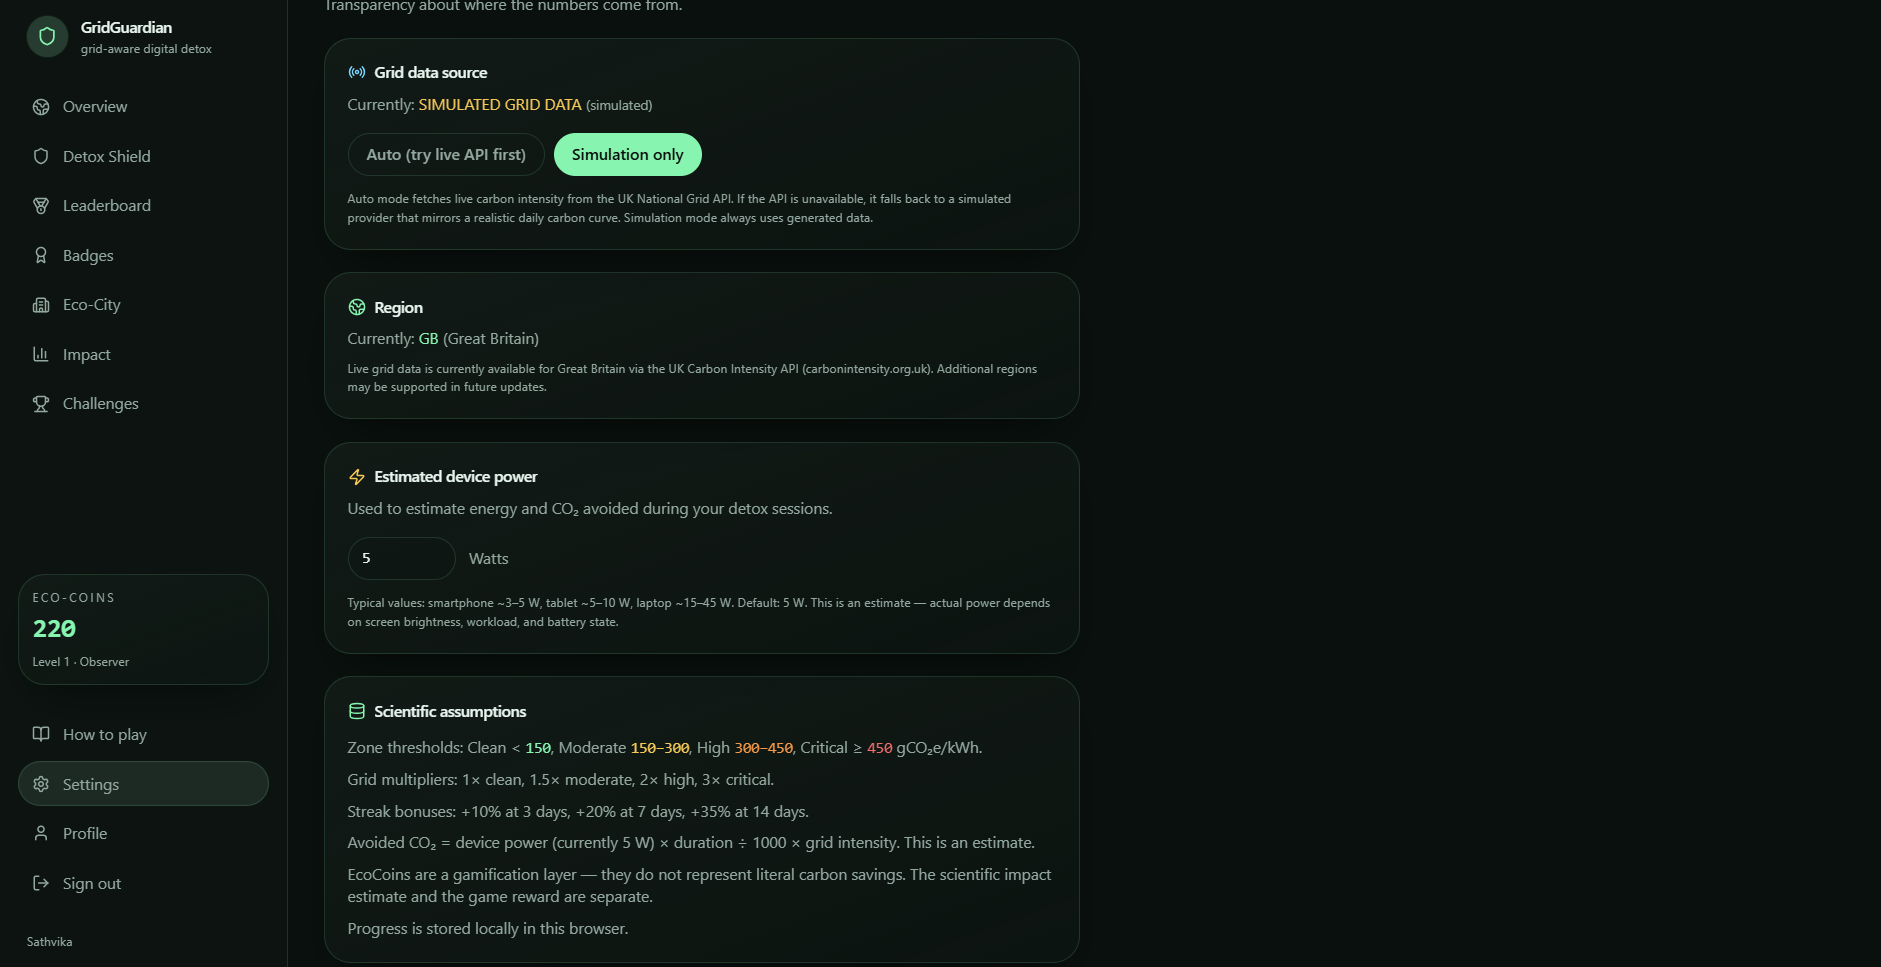
For the prototype, I used part realtime API and modeled data when live API data isn't available. This lets us demonstrate the complete experience without pretending simulated values are real-time measurements.
The architecture is designed so the data provider can be replaced with a live regional carbon-intensity API.
Recommendation Engine
The recommendation layer analyzes the changing grid signal and identifies potential windows for a digital detox.
Instead of asking users to understand raw values such as:
347 gCO₂e/kWh
the interface translates the signal into simple states such as:
🟢 Better opportunity 🟡 Consider a break 🔴 Higher-carbon period
Reward Engine
We built a dynamic reward system based on:
Base Reward × Grid Multiplier × Streak Multiplier
This makes the gamification respond to the conditions represented by the application rather than simply awarding the same number of points every time.
Detox System
Users can start timed Detox Shield sessions.
The application tracks the countdown, session state, completion, and interruptions.
Eco-City
The reward system connects directly to a persistent virtual environment.
Eco-Coins can be spent on city infrastructure, turning individual detox sessions into visible long-term progression.
Impact Dashboard
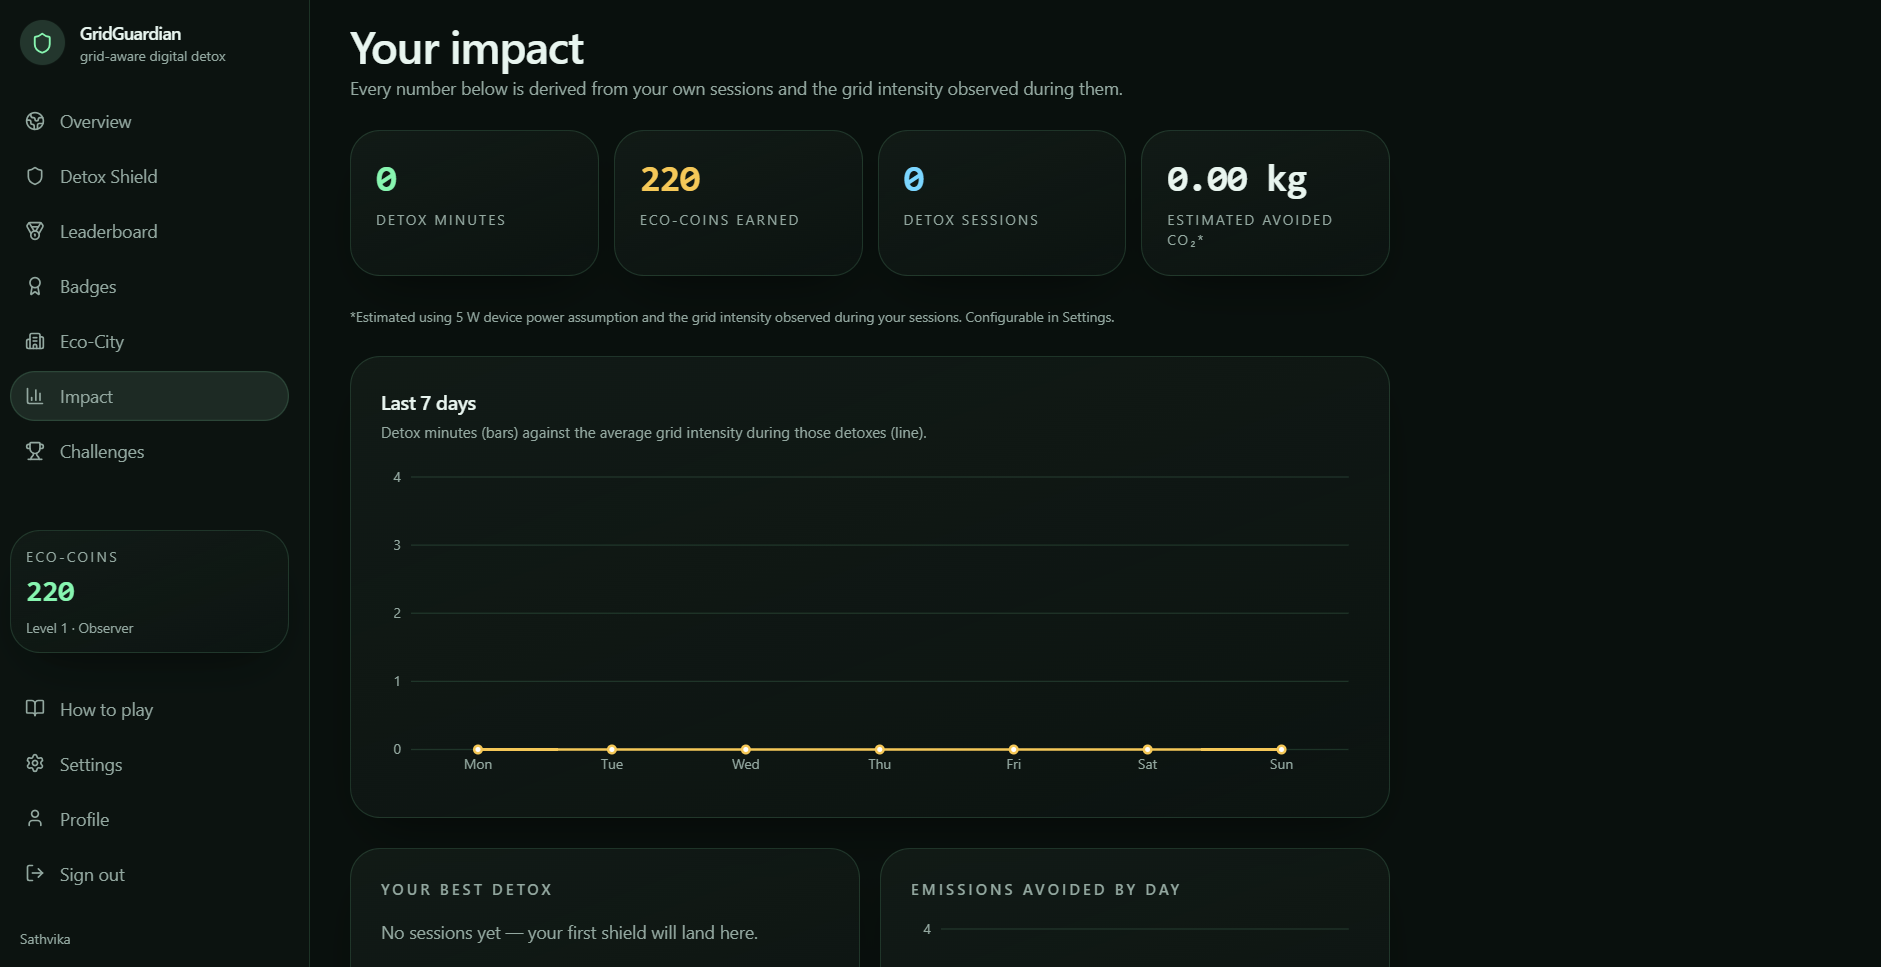
The application records user activity and presents historical detox sessions, streaks, rewards, and modeled impact.
Environmental impact values are explicitly treated as estimates based on assumptions, rather than direct measurements of an individual's electricity consumption.
Challenges we ran into
One of my biggest challenges was figuring out how to connect two things that normally have nothing to do with each other:
screen time and electricity-system data.
It was easy to build a carbon dashboard.
It was much harder to make that information understandable and actionable for someone who doesn't know anything about electricity grids.
We also had to be careful about the science.
We didn't want to make the misleading claim that:
“You watched a video, therefore a specific fossil-fuel plant turned on.”
Real electricity systems are much more complicated than that.
Instead, GridGuardian treats regional carbon intensity as a signal and focuses on the idea of shifting flexible behavior when conditions may make that useful.
Another challenge was making the project feel like a product rather than a collection of graphs.
That's why we built the Detox Shield and Eco-City around the data.
The user shouldn't need to understand the underlying energy system to use GridGuardian.
Accomplishments that we're proud of
I am especially proud that GridGuardian turns a complicated concept into a simple interaction.
A user doesn't need to understand electricity markets, generation dispatch, or carbon accounting.
GridGuardian includes:
- Interactive grid visualization
- Recommendation logic
- Functional detox timer
- Dynamic rewards
- Streak progression
- Eco-City construction
- Impact tracking
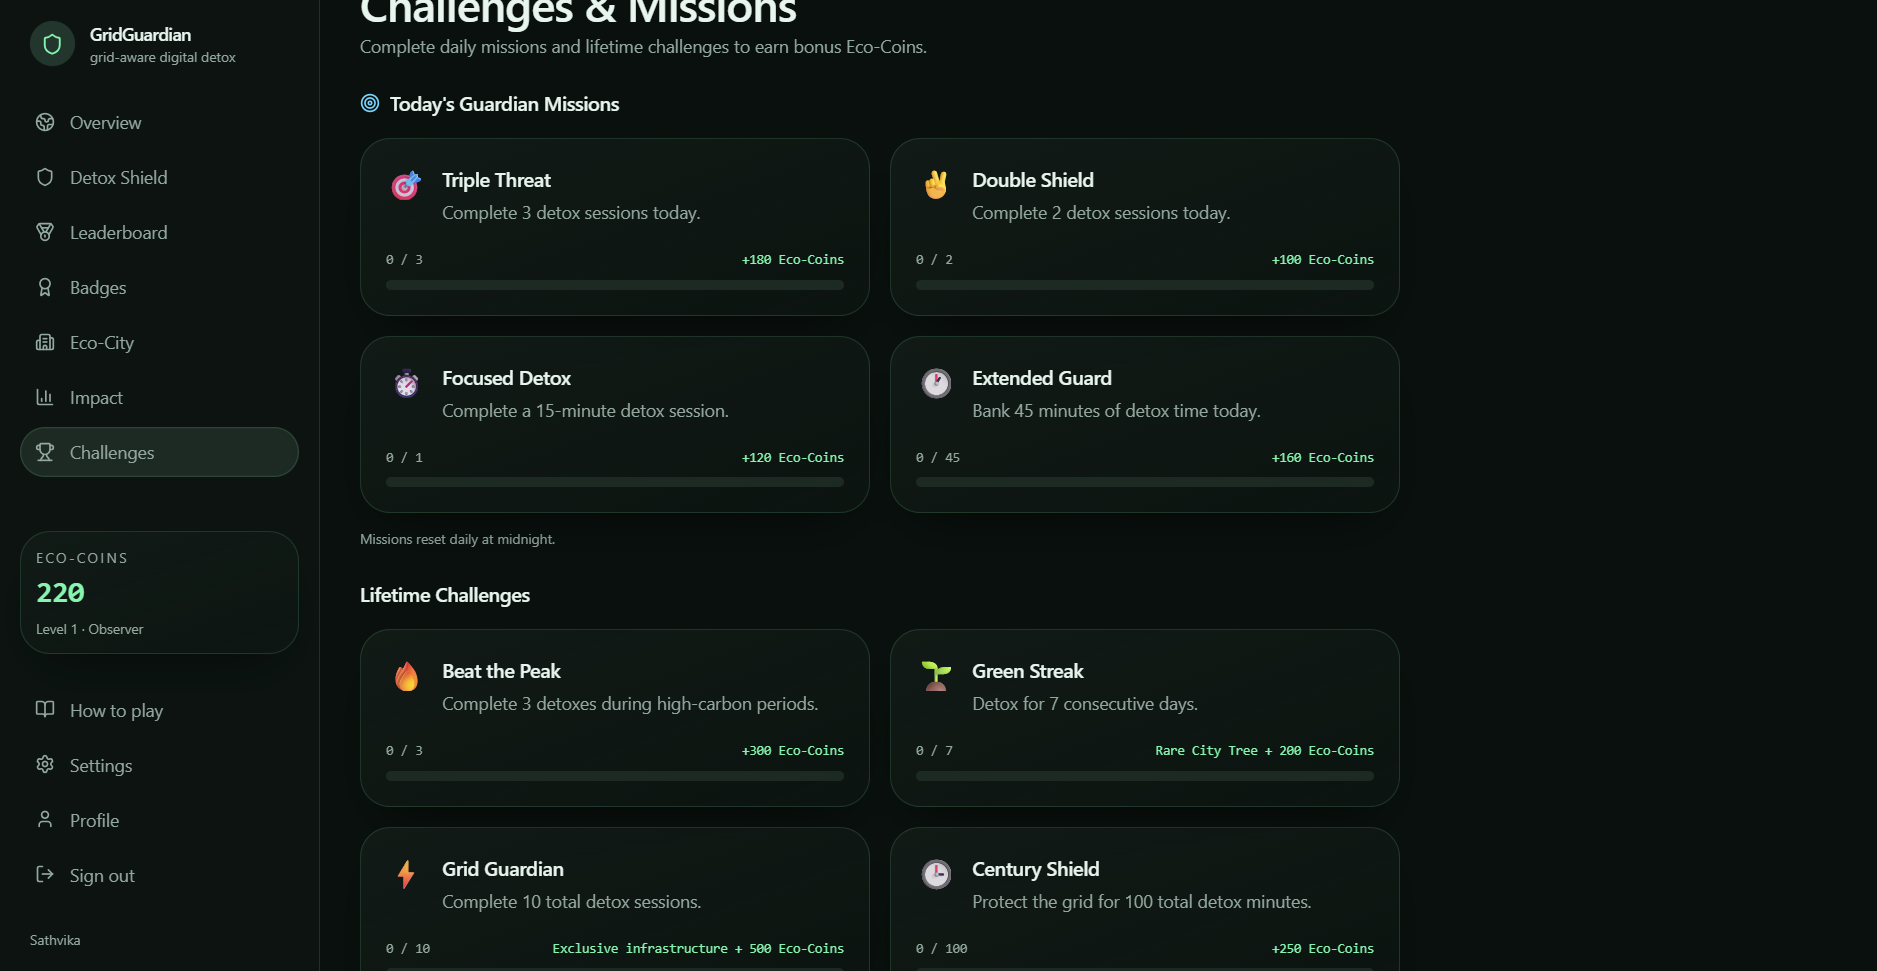
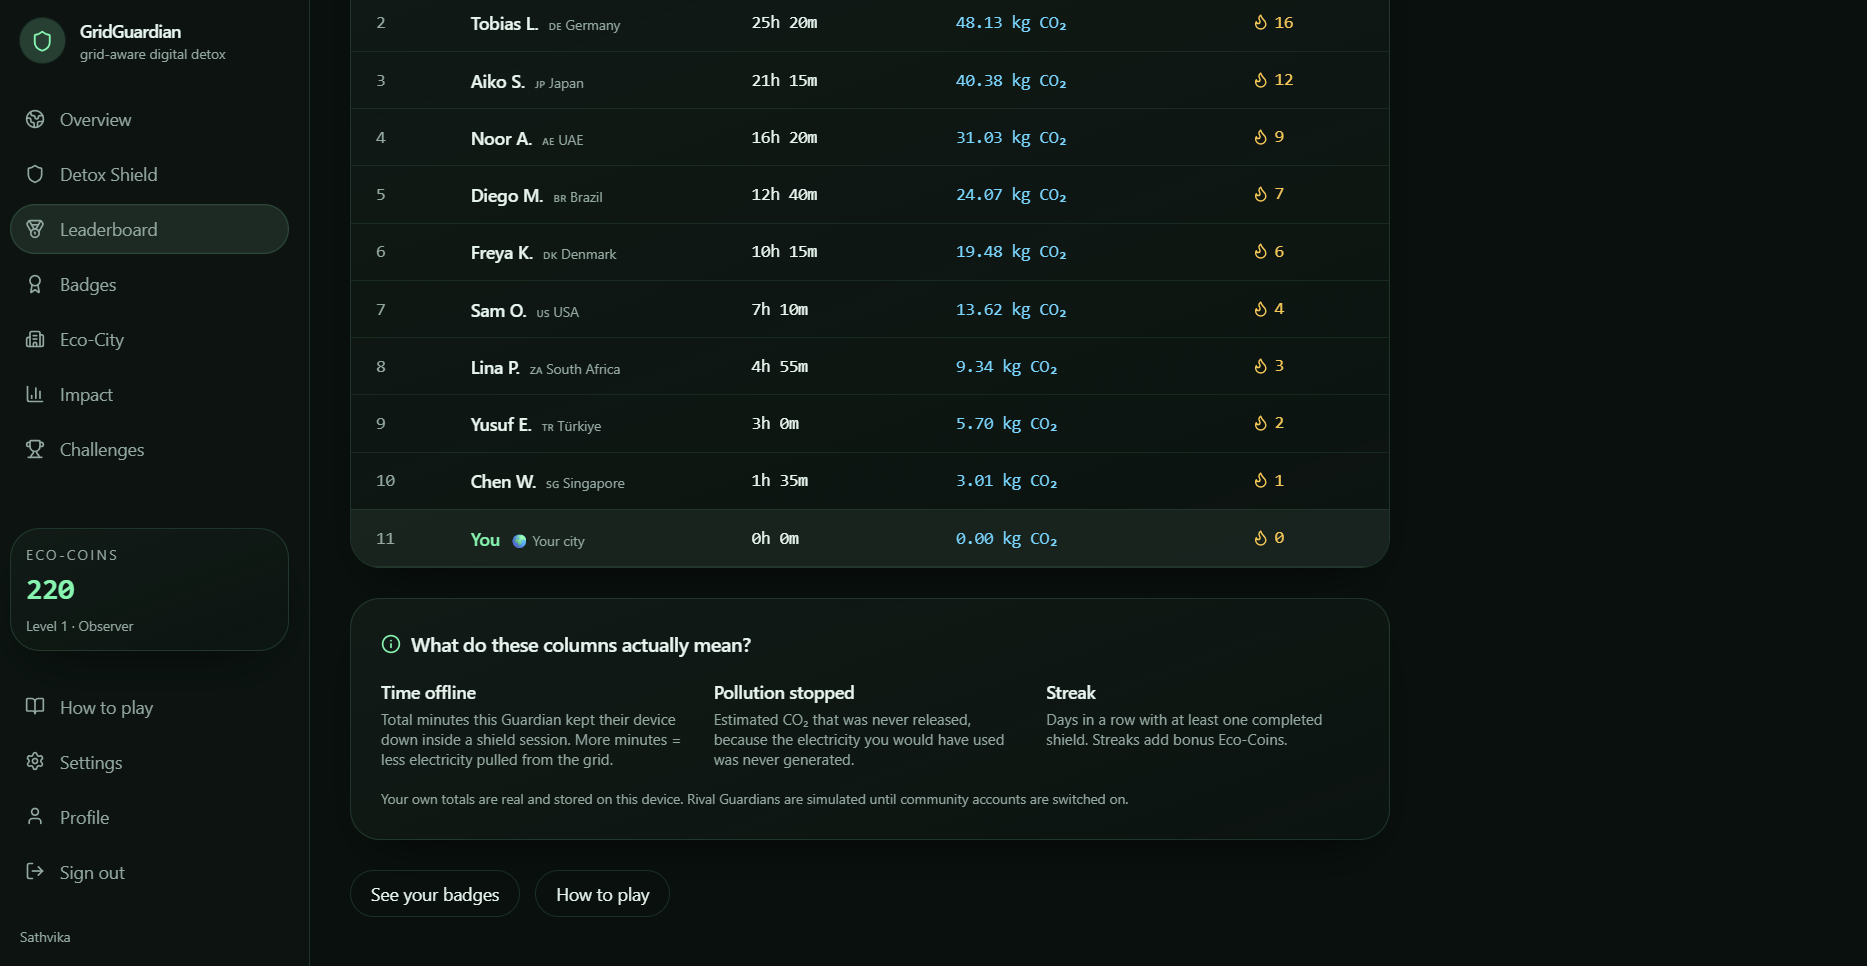
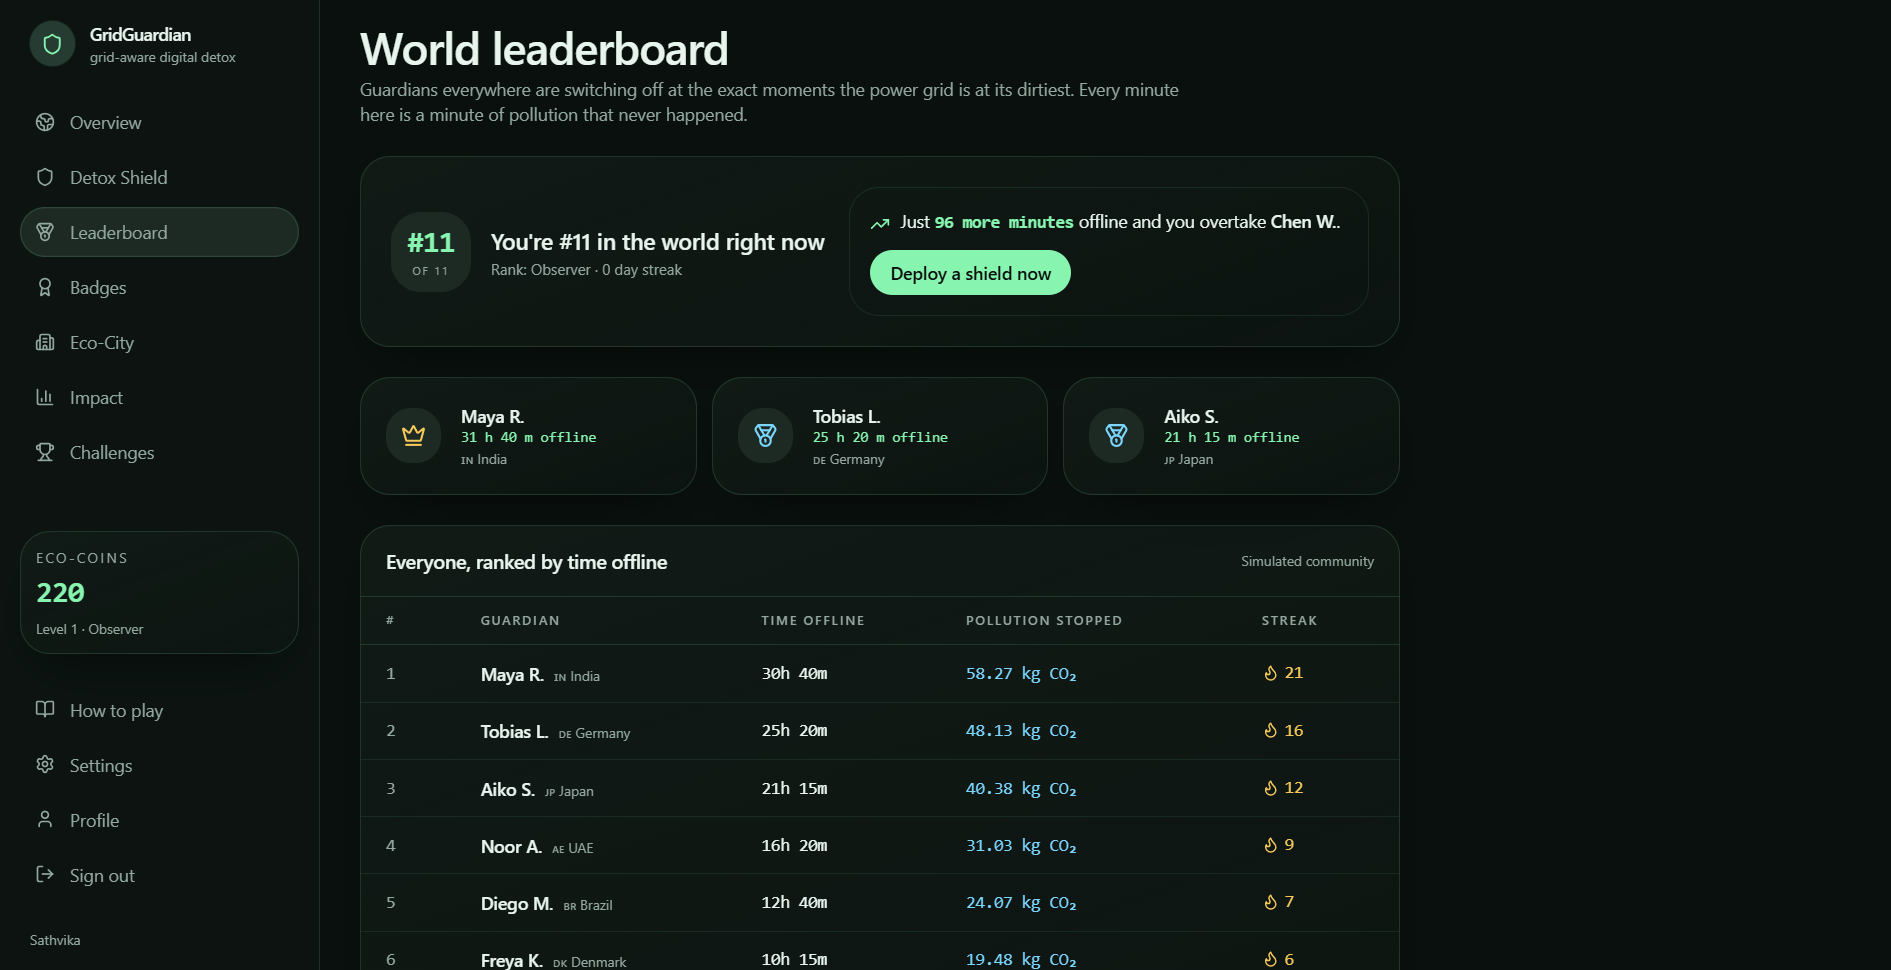
- Challenges and community progression
- Responsive UI
Most importantly, I tried to be honest about what the prototype can and cannot measure.
What we learned
I learned that making something technically impressive isn't enough.
The hardest part was translating technical information into something a normal person could understand in seconds.
We also learned how important assumptions are when working with environmental data.
A number that looks precise doesn't necessarily mean it is a precise measurement.
That pushed us to distinguish between:
real grid data, modeled data, and estimated impact.
We also learned that gamification can be more than points and badges.
When the rewards connect directly to the user's behavior and create visible changes in their virtual world, the game becomes a way of communicating the underlying idea.
What's next for GridGuardian
The next step is connecting GridGuardian to reliable live regional electricity data so the recommendation engine can respond to actual conditions.
From there, we want to improve the recommendation model by incorporating:
- Regional electricity forecasts
- Renewable generation availability
- Historical grid patterns
- User-selected locations
- More accurate device-energy assumptions
- More rigorous avoided-emissions modeling
I also want to explore integrations with digital-wellbeing systems so Grid Guardian can work beyond a single web session.
Long term, the vision is bigger than a detox game.
I want Grid Guardian to become a simple interface between people and the invisible electricity systems they depend on.
Because we already have software telling us what to watch, what to buy, where to go, and when to save.
We think software can also help us understand:
when to use less.
Built With
- vercel

Log in or sign up for Devpost to join the conversation.