-
-
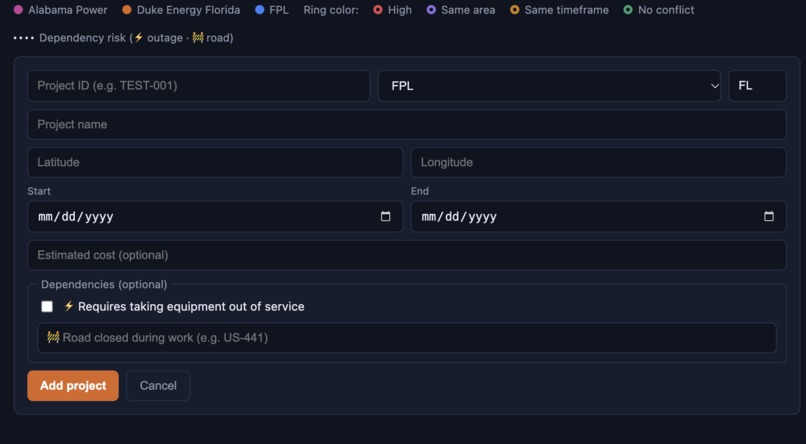
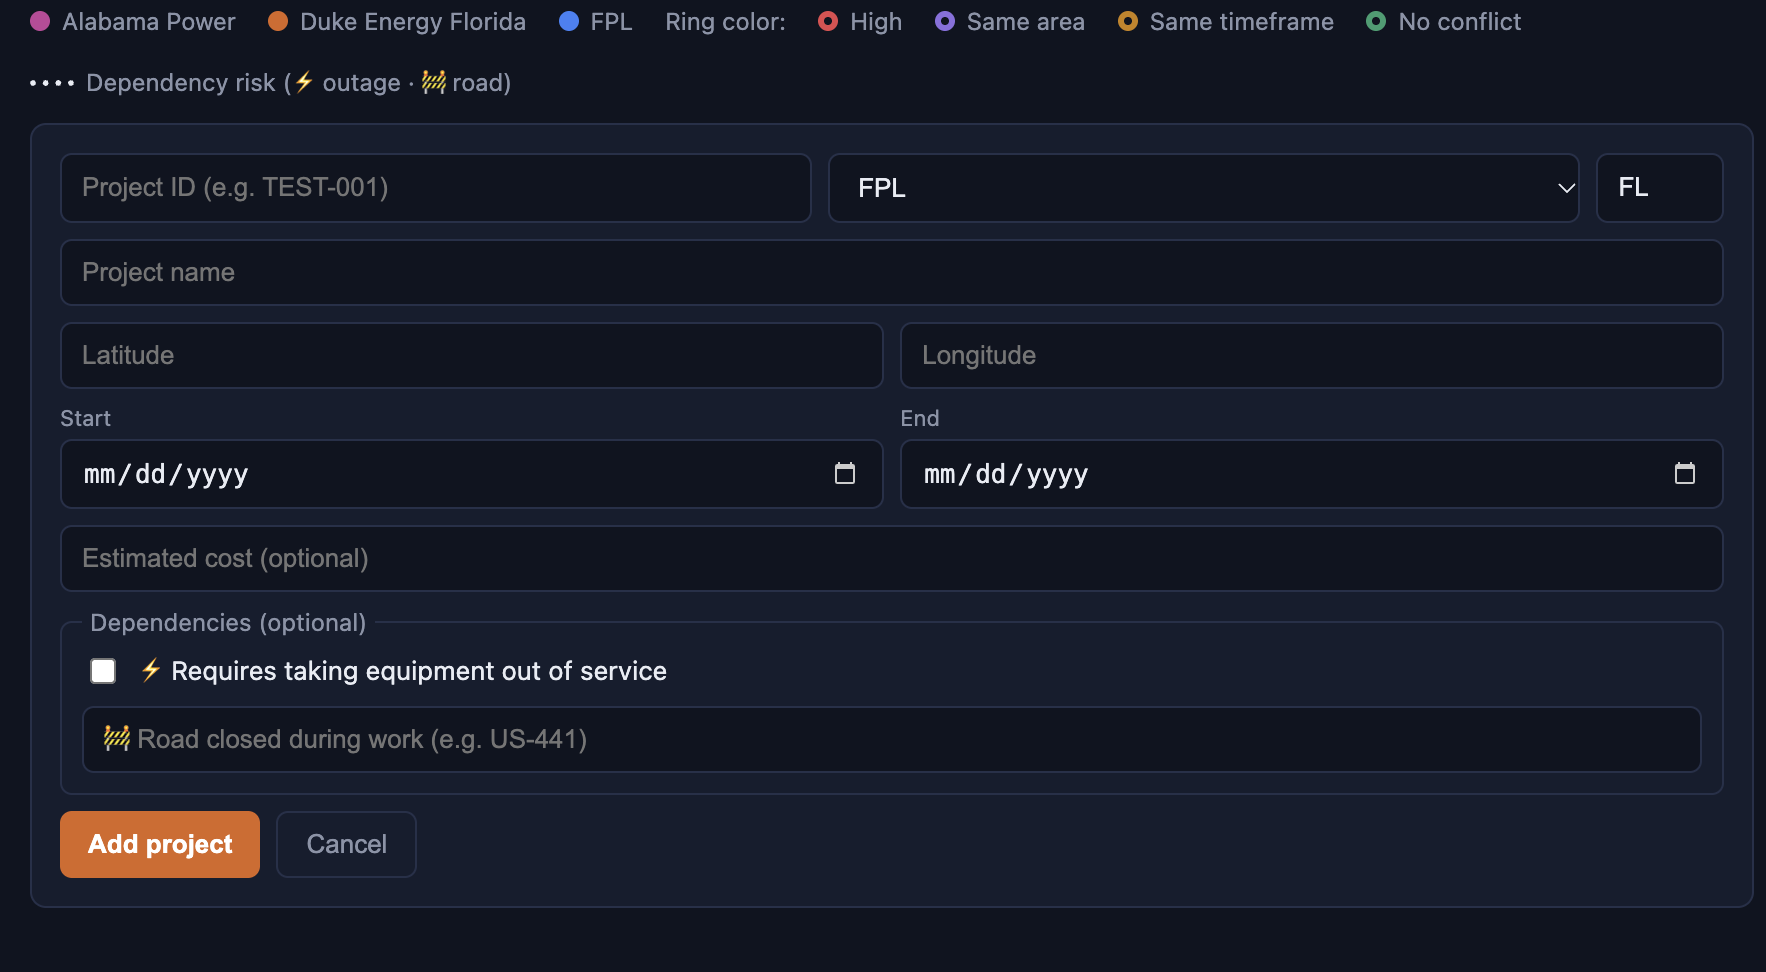
Adding more projects to app
-
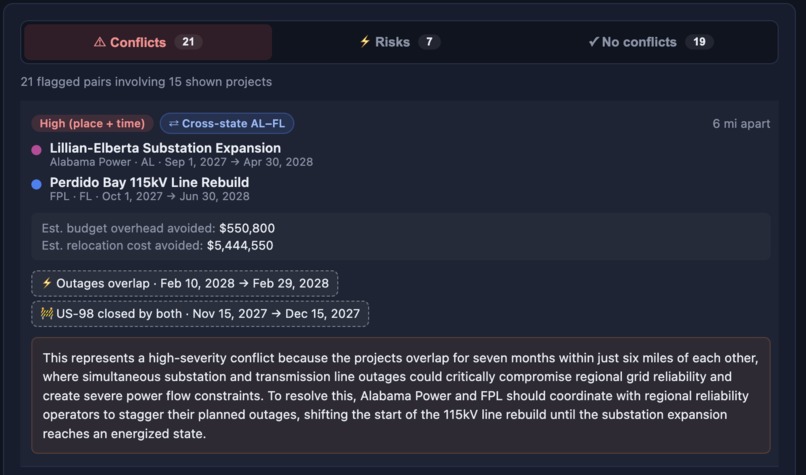
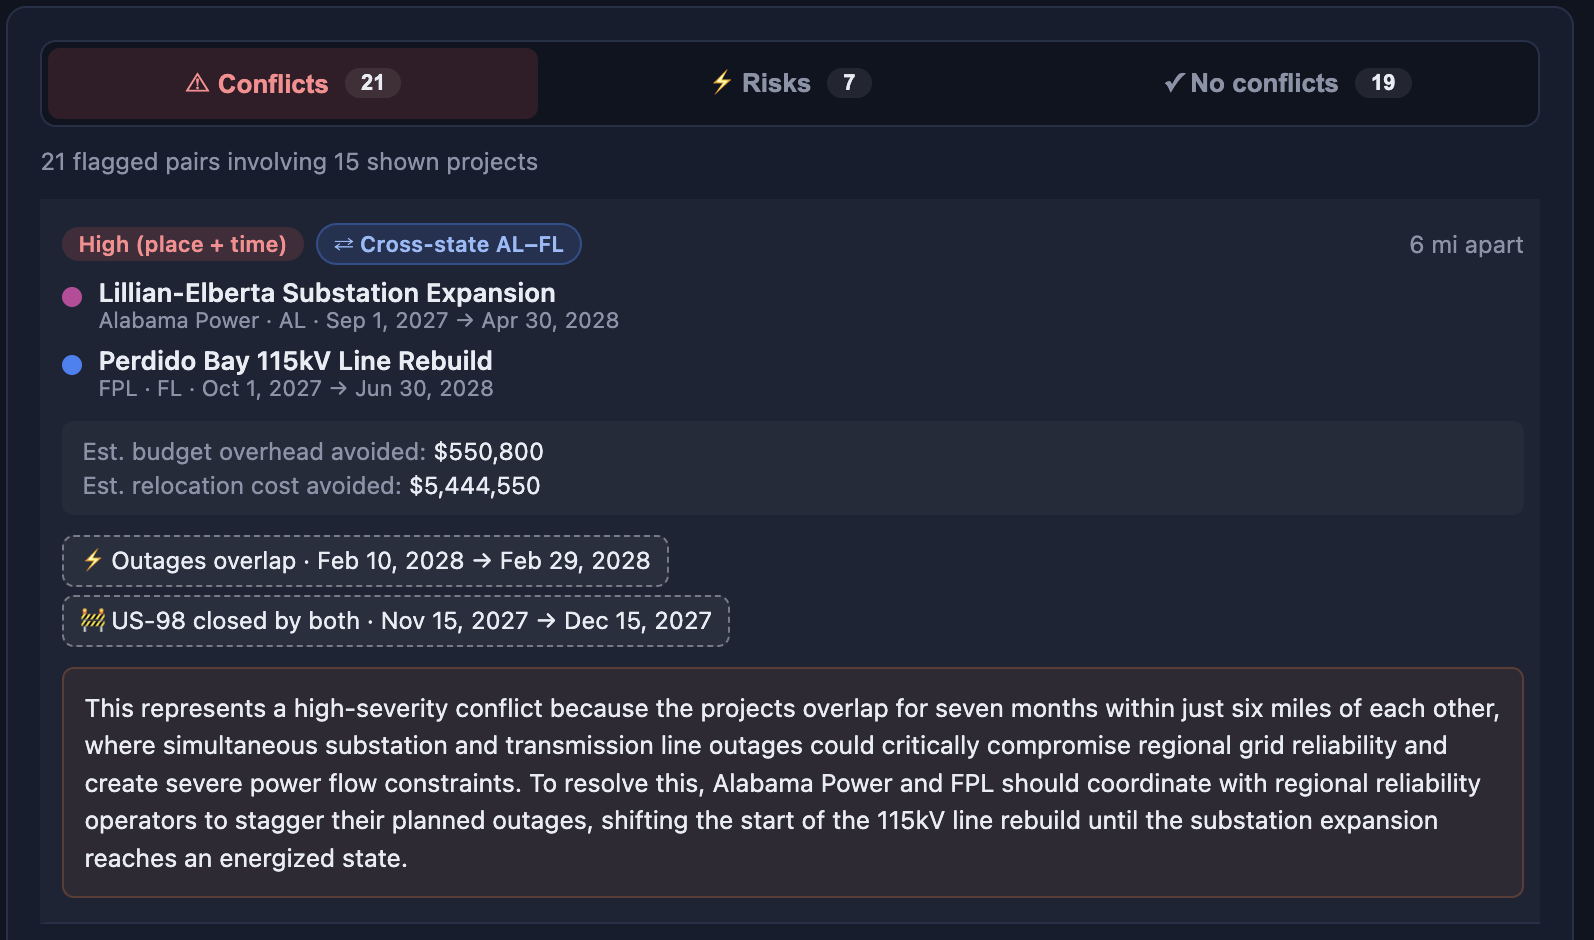
AI suggestion/help feature: AI explain
-
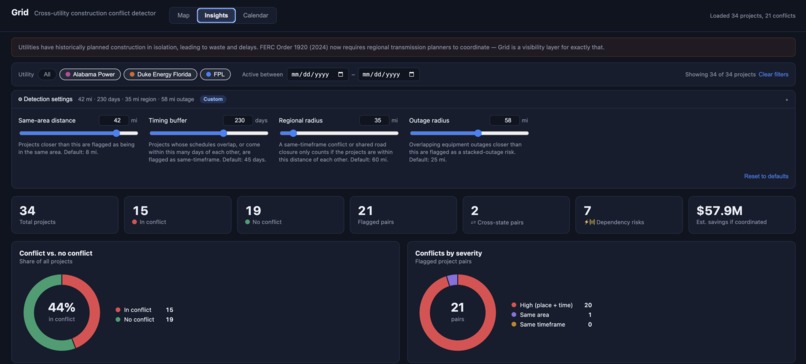
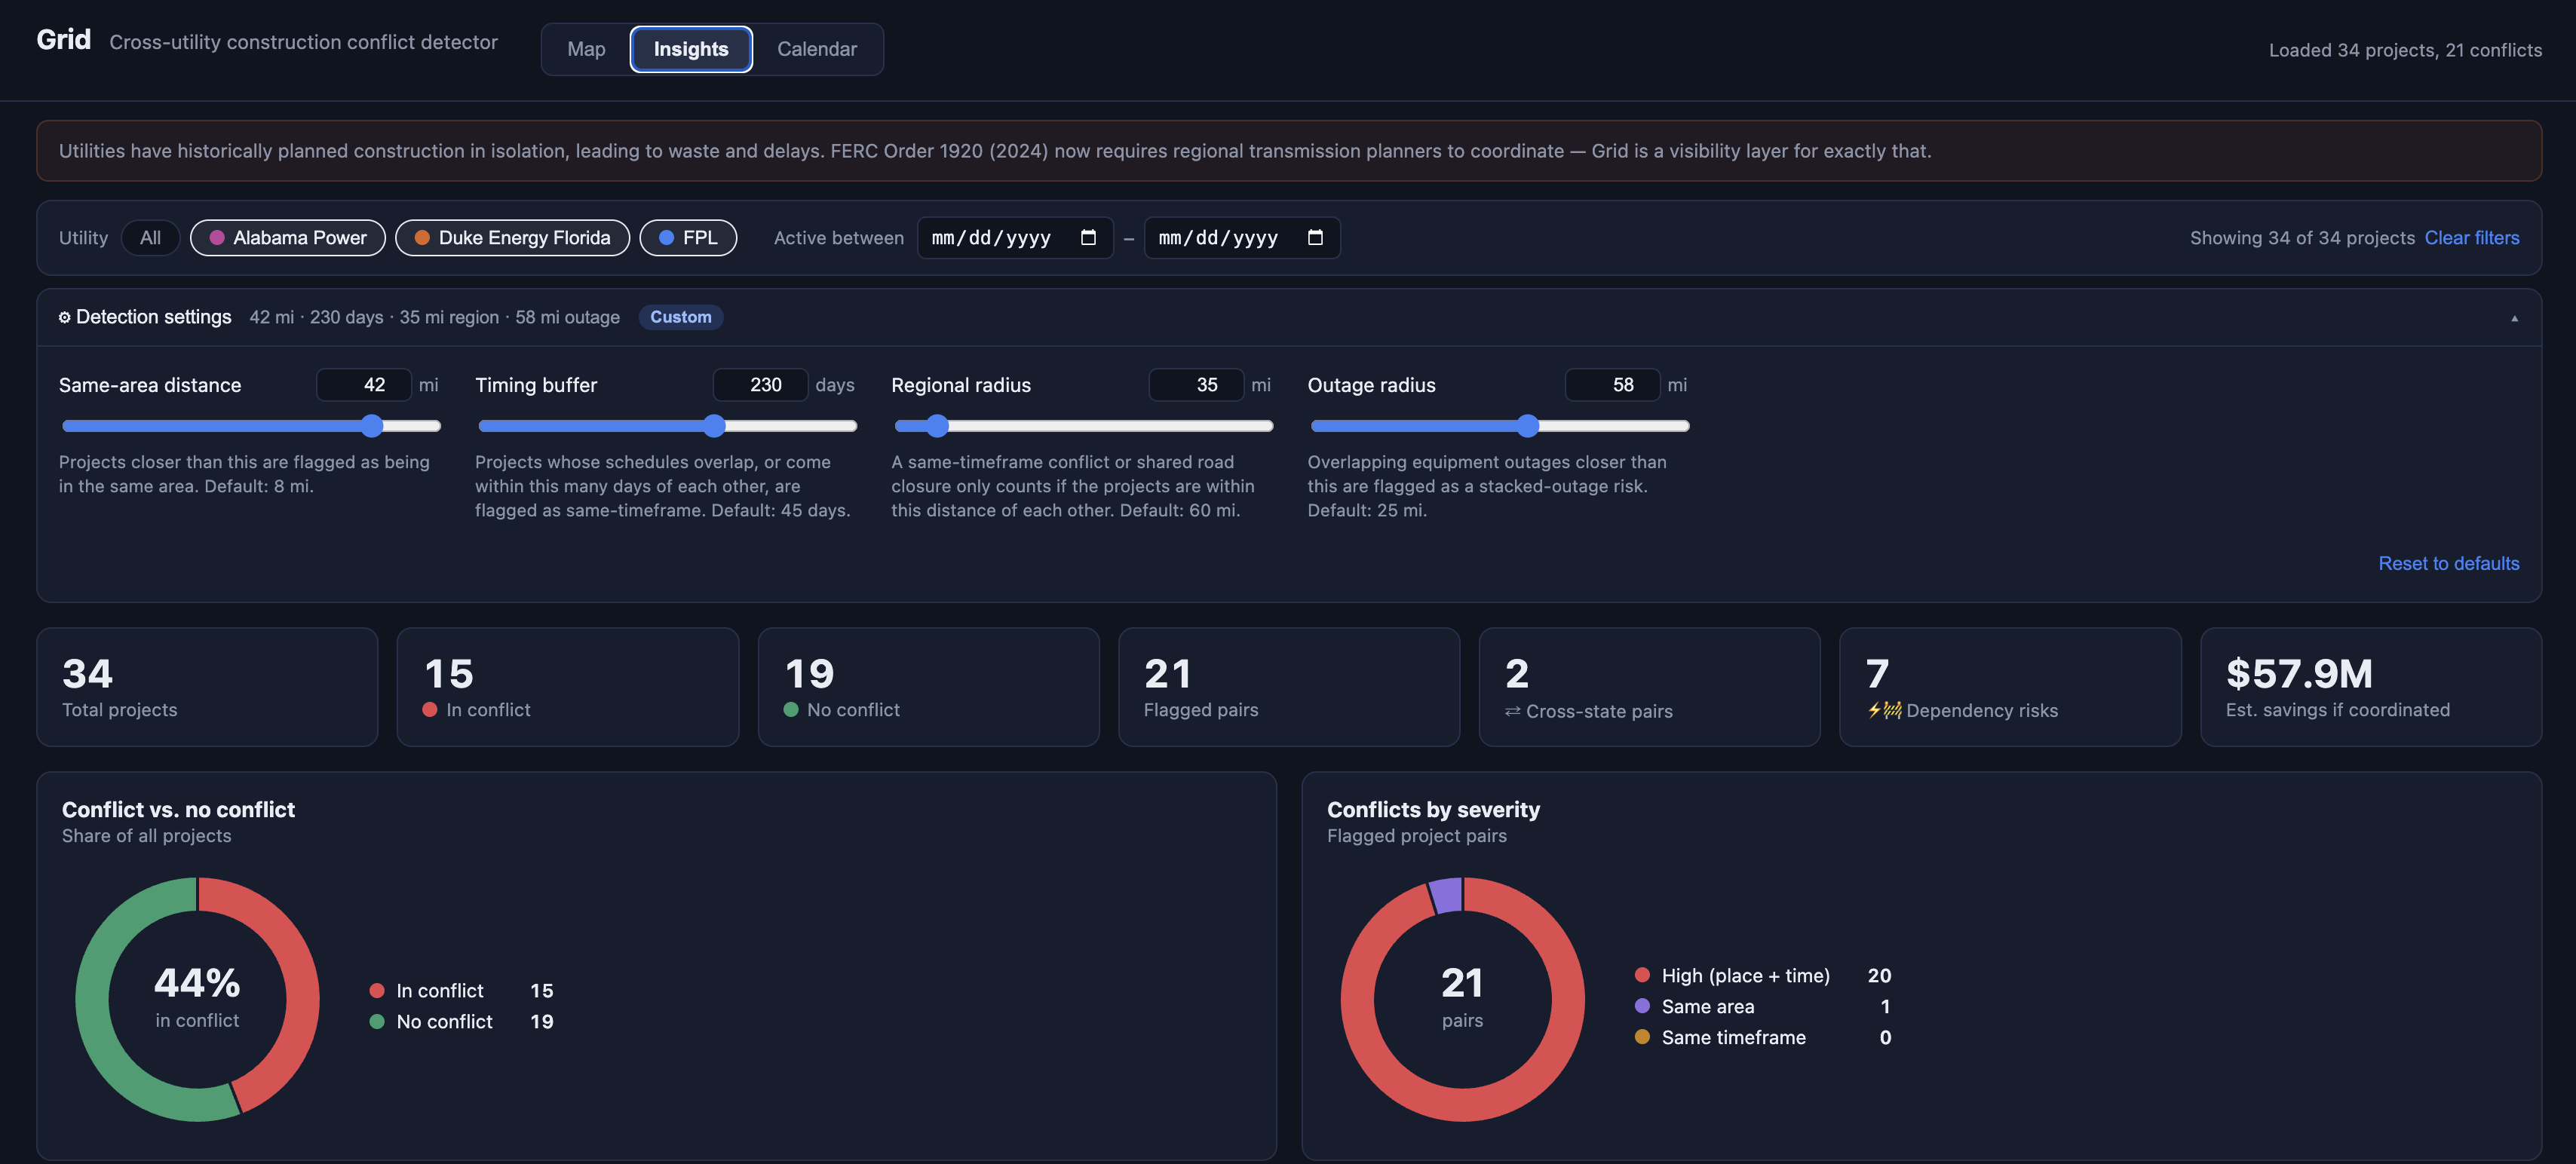
Insight dashboard #1: get live graphical insights
-
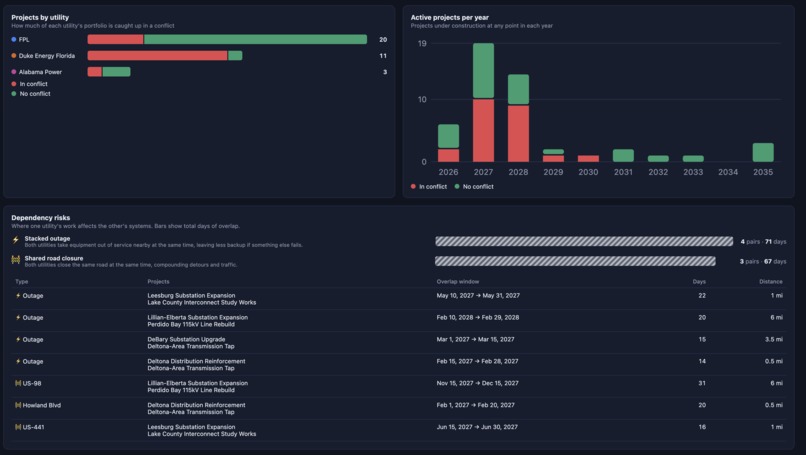
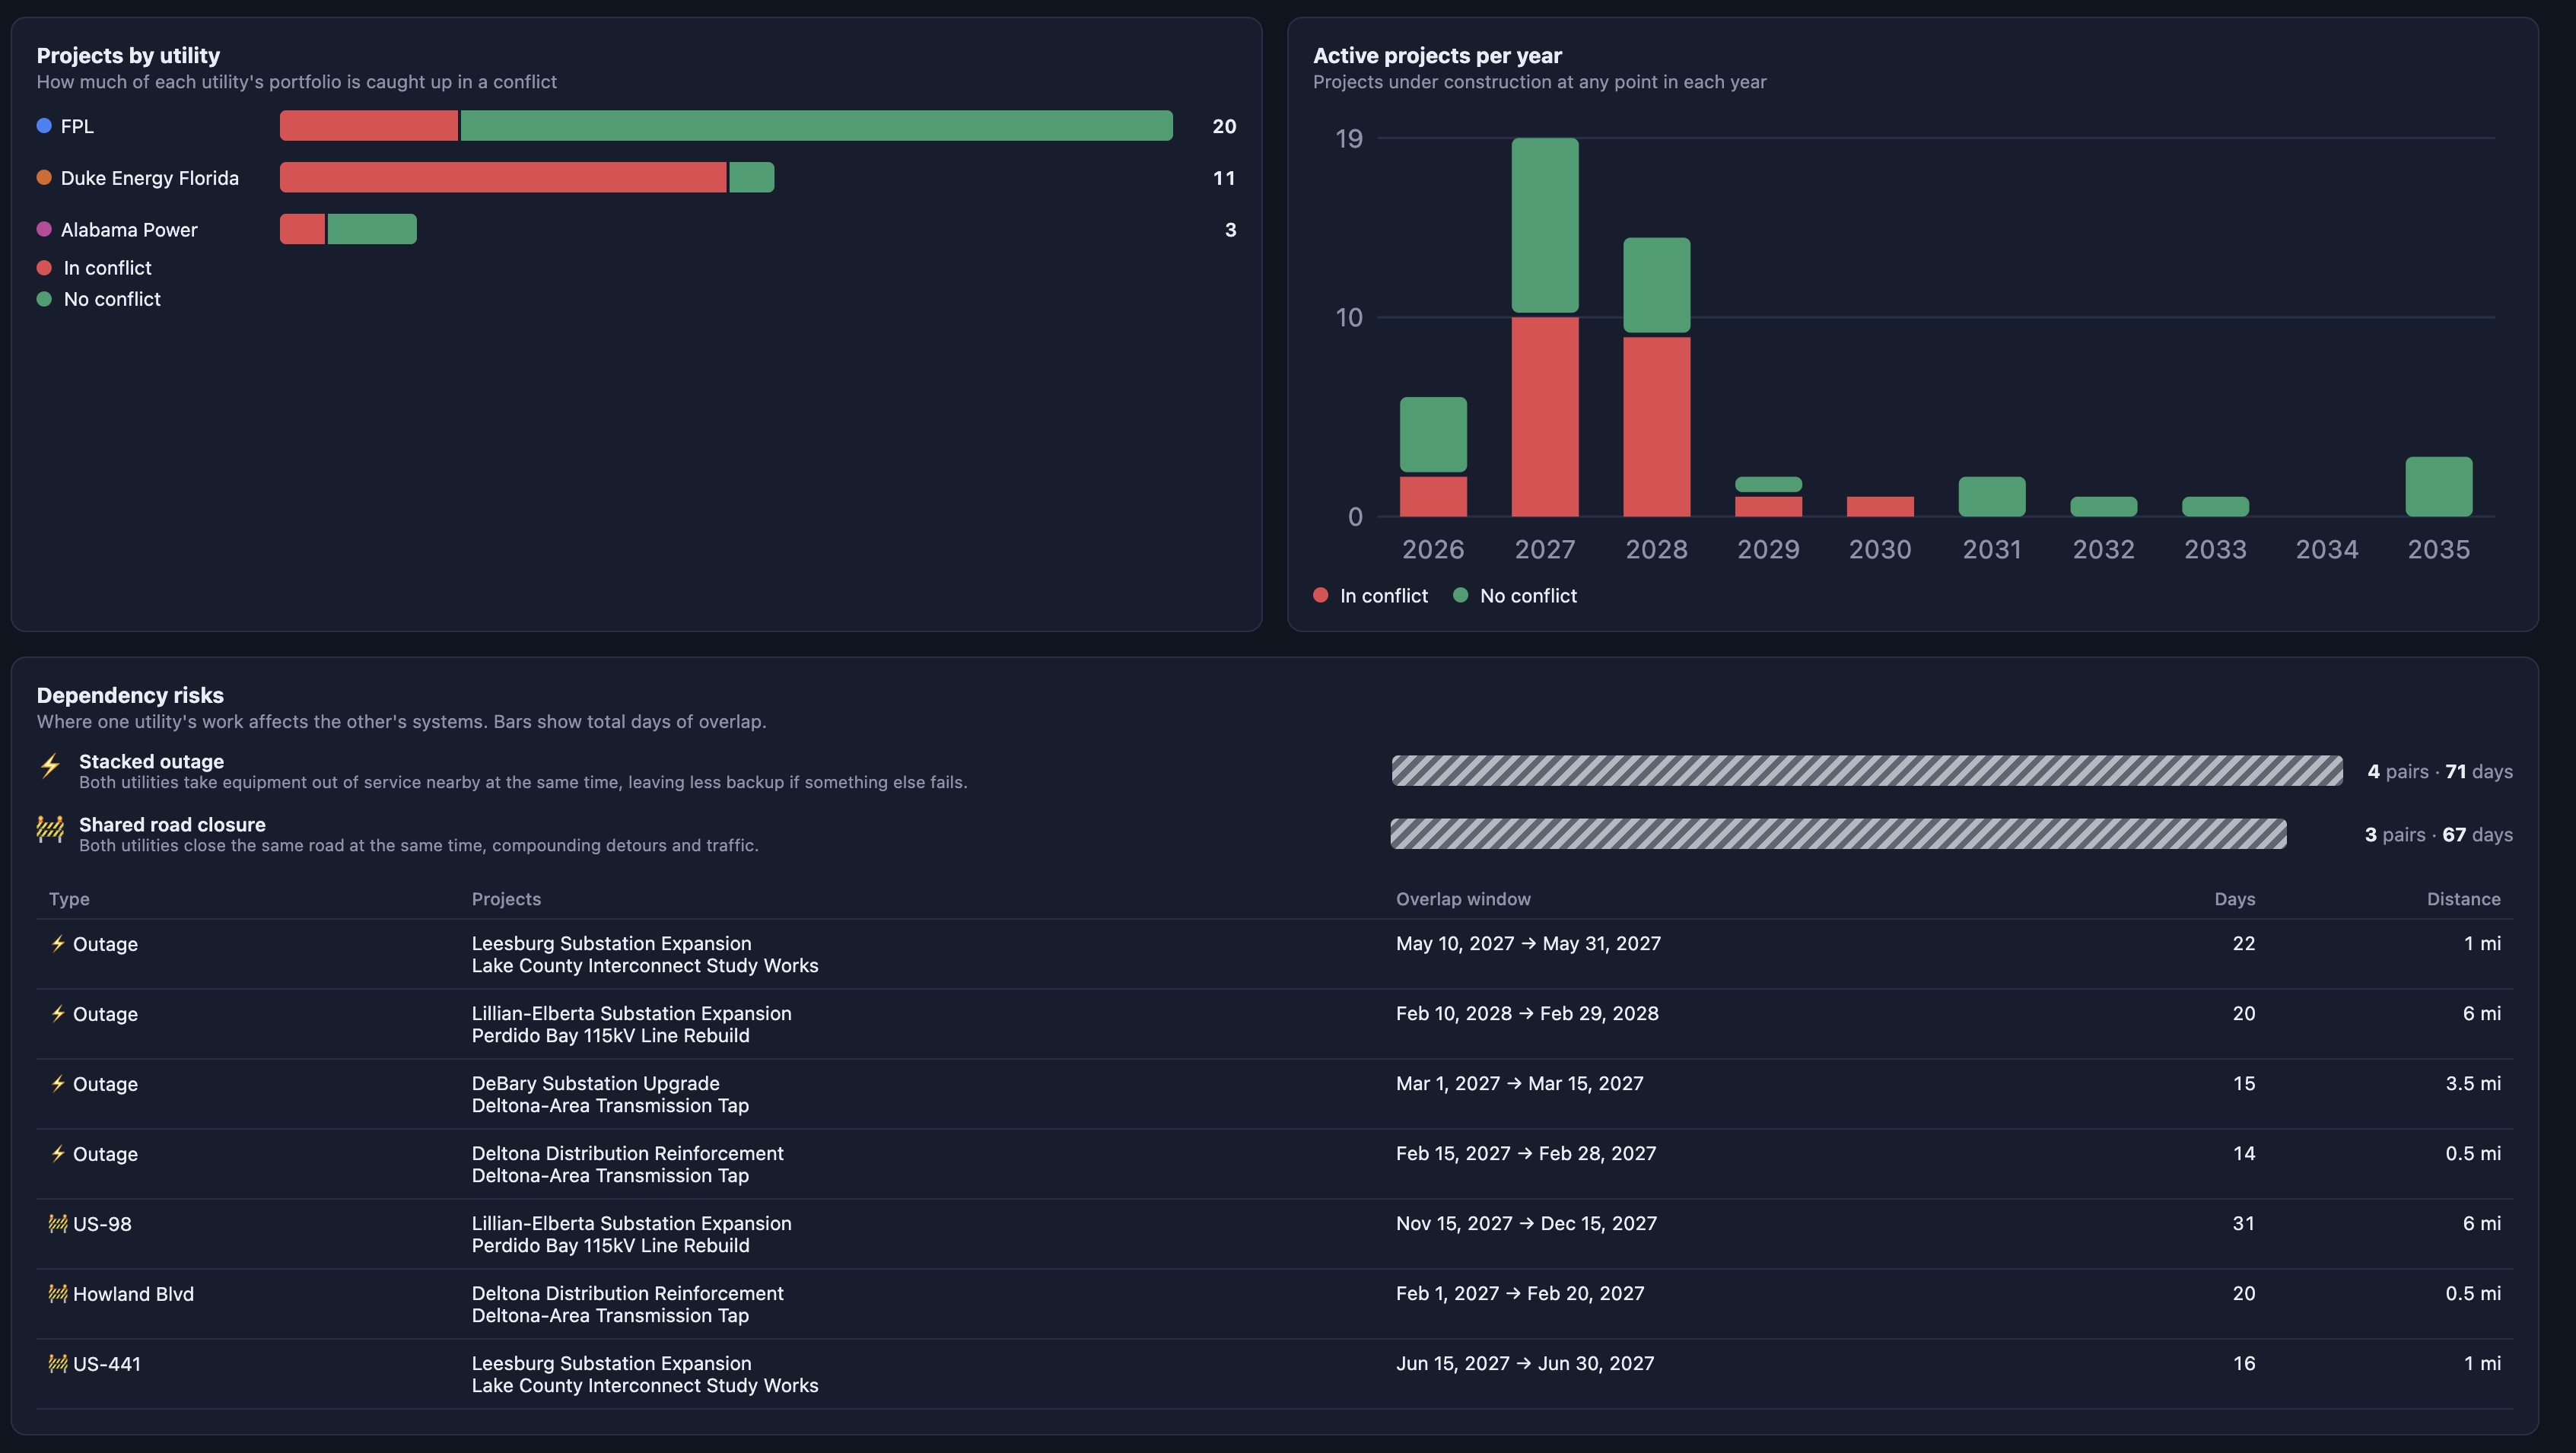
Insight dashboard #2
-
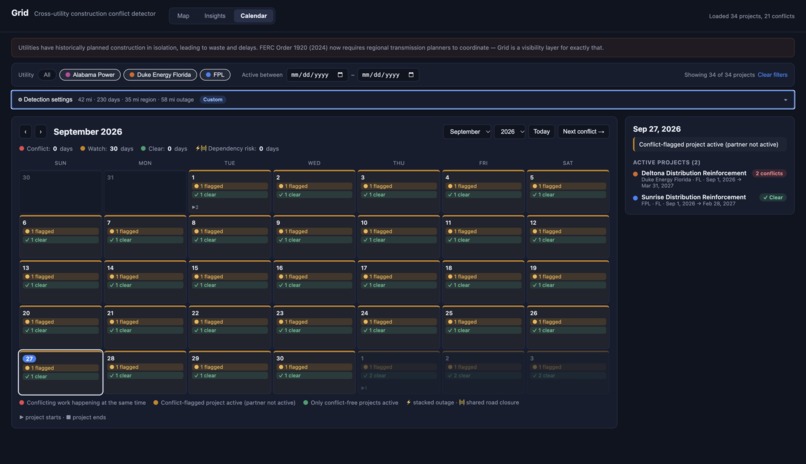
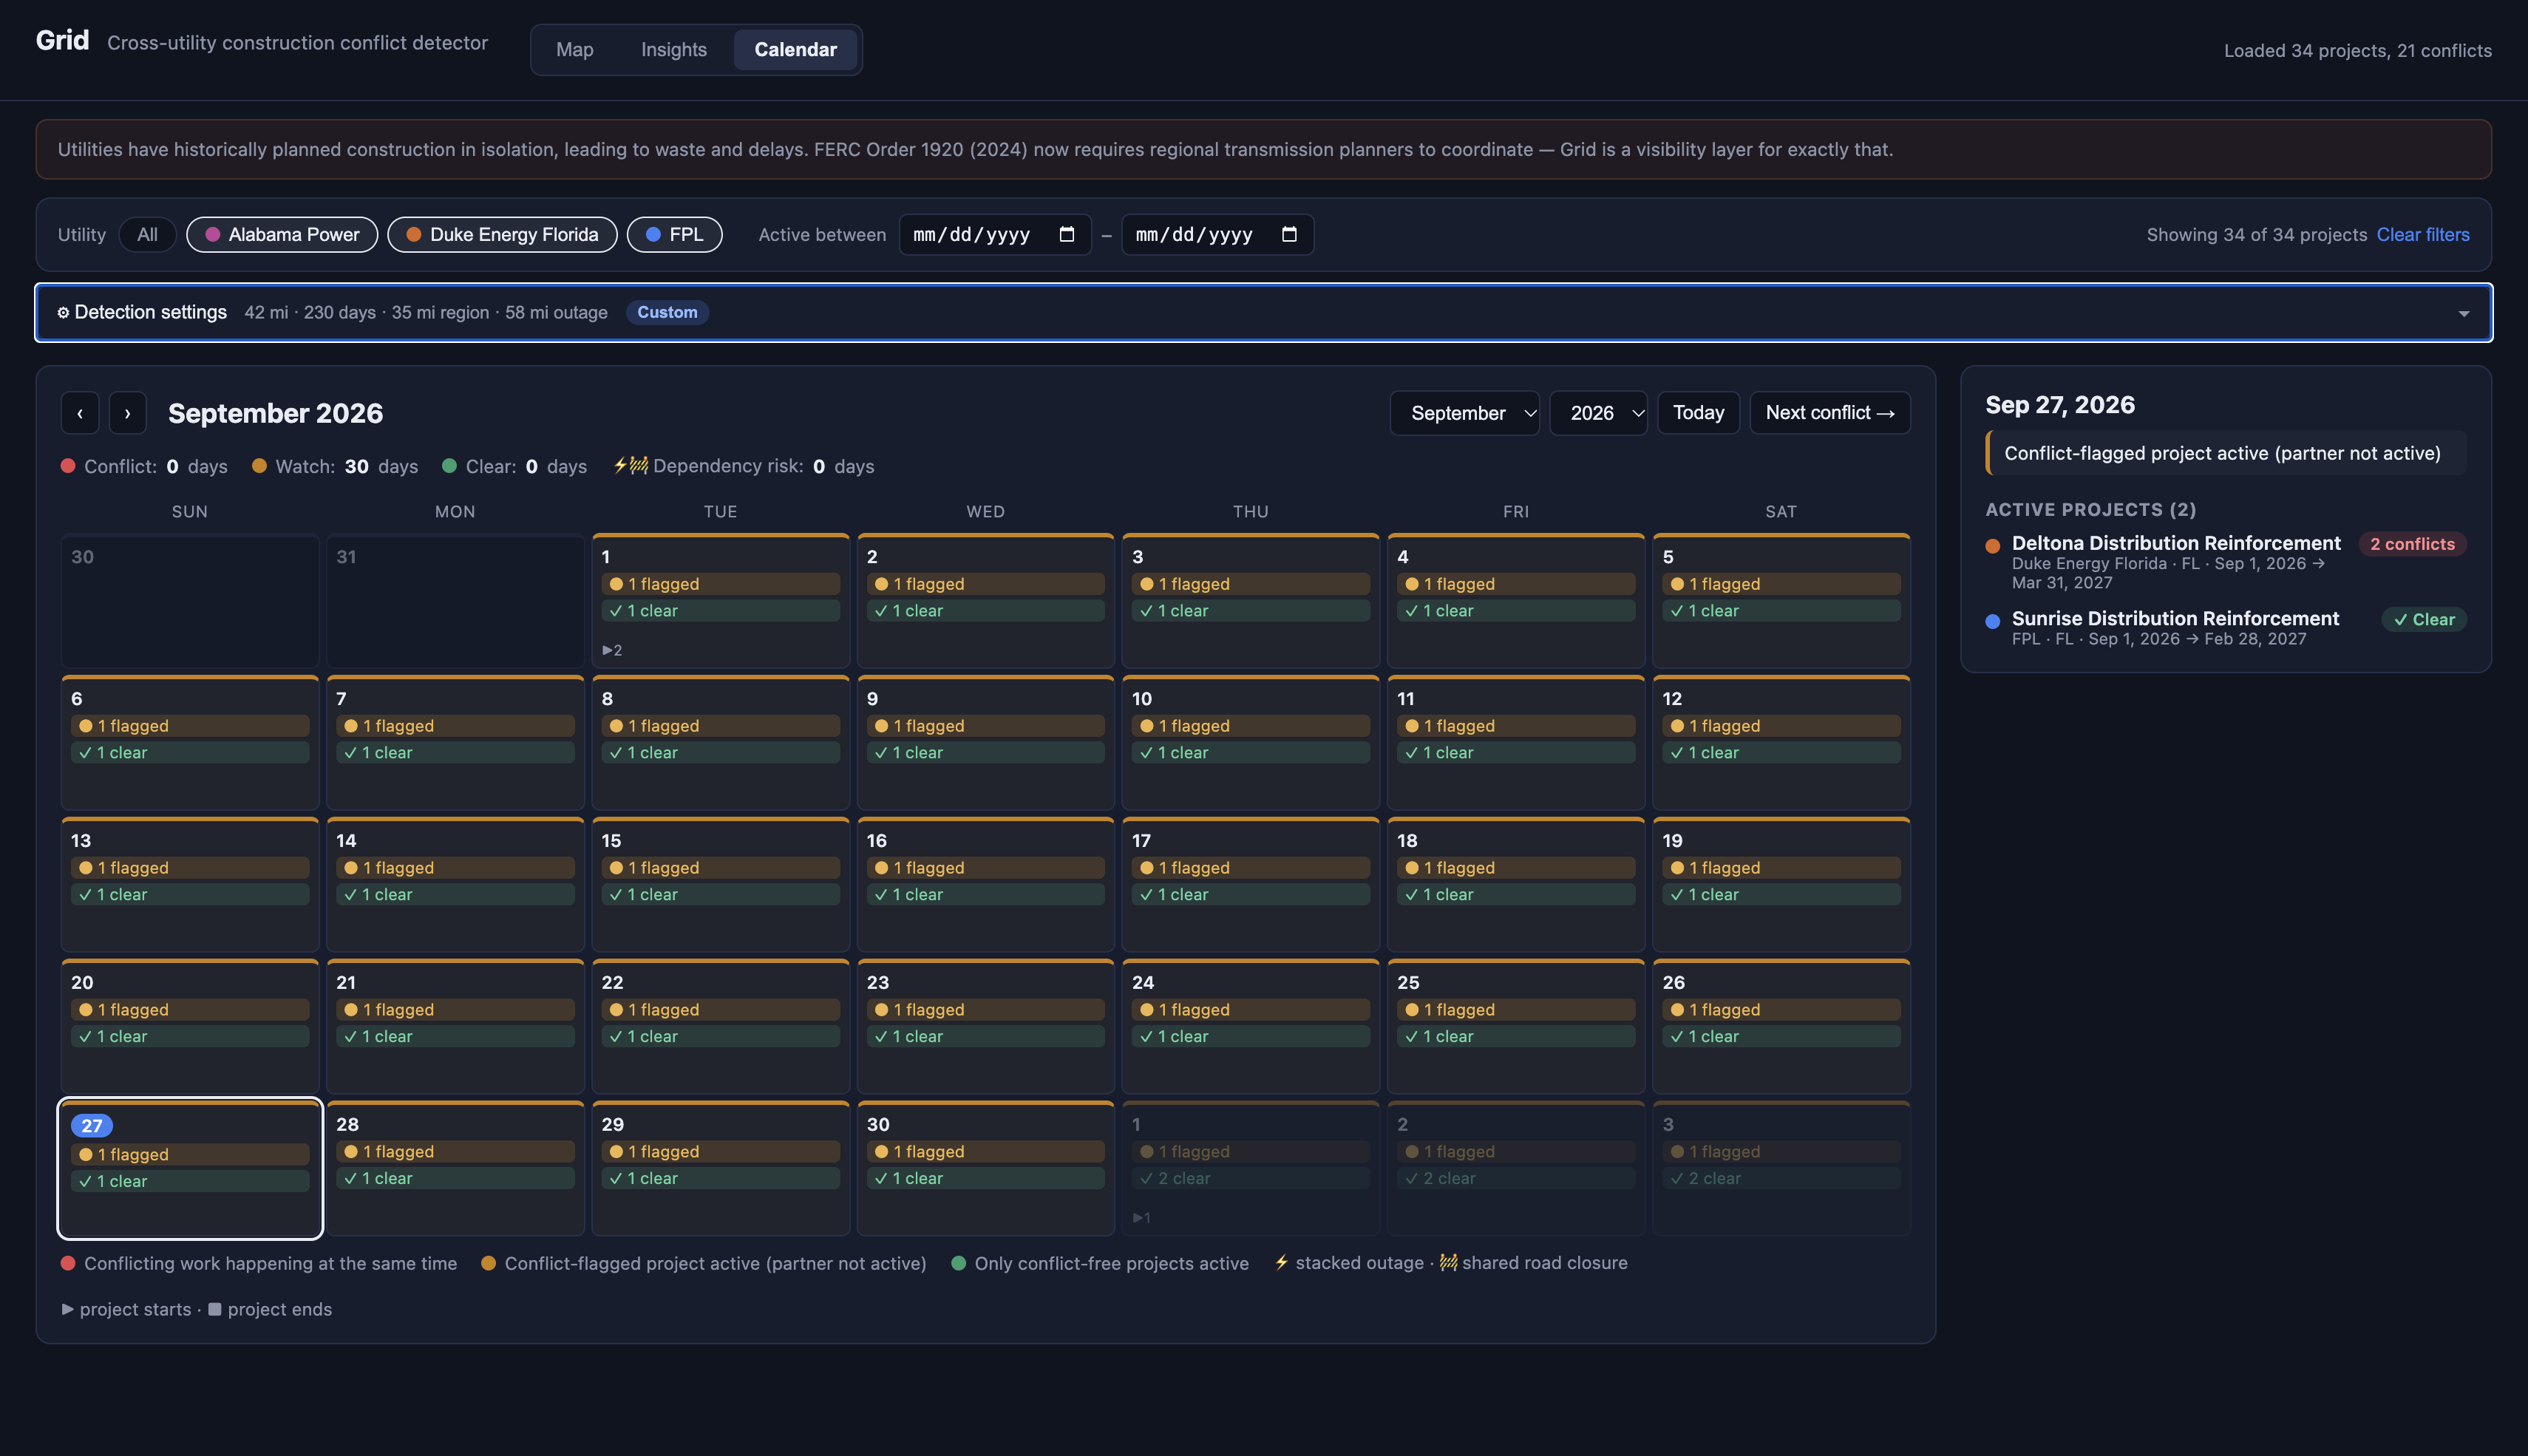
Calendar view
-
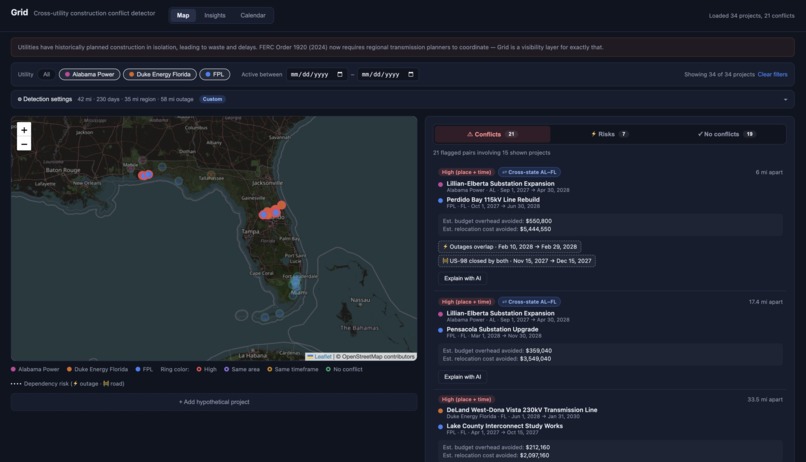
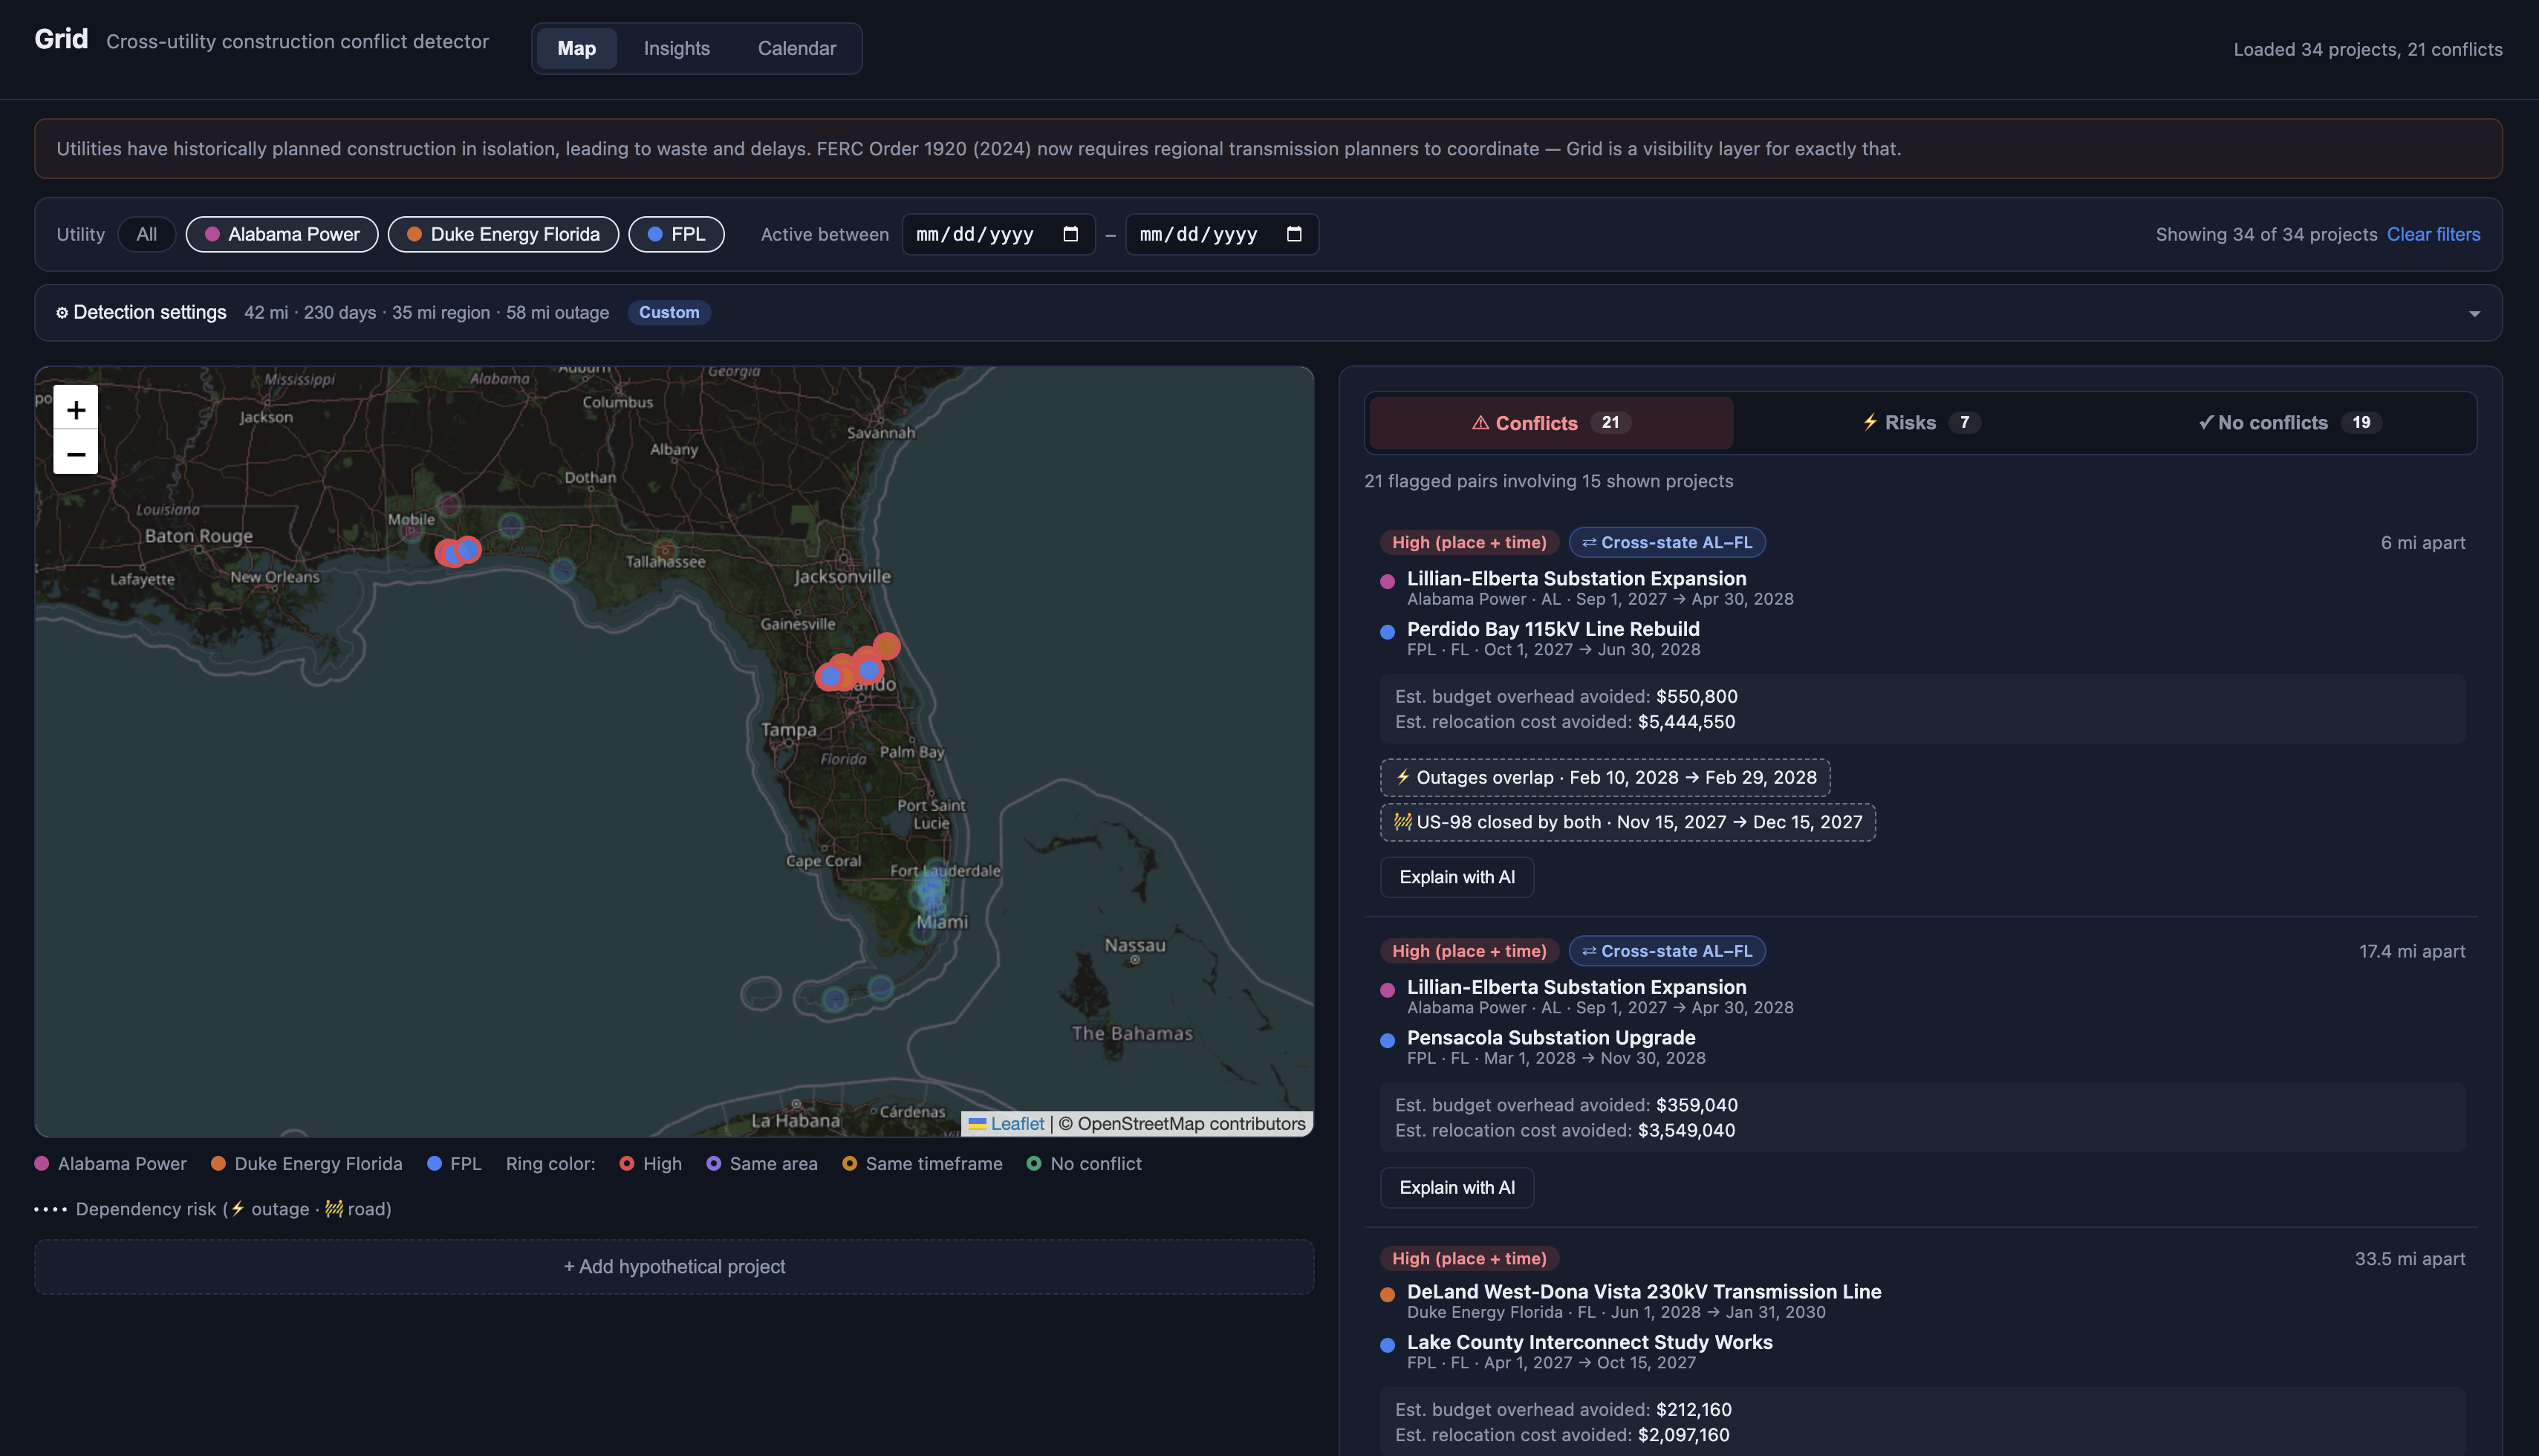
Grid's main panel
-

Custom conflict panel: can adjust your conflict zones
-
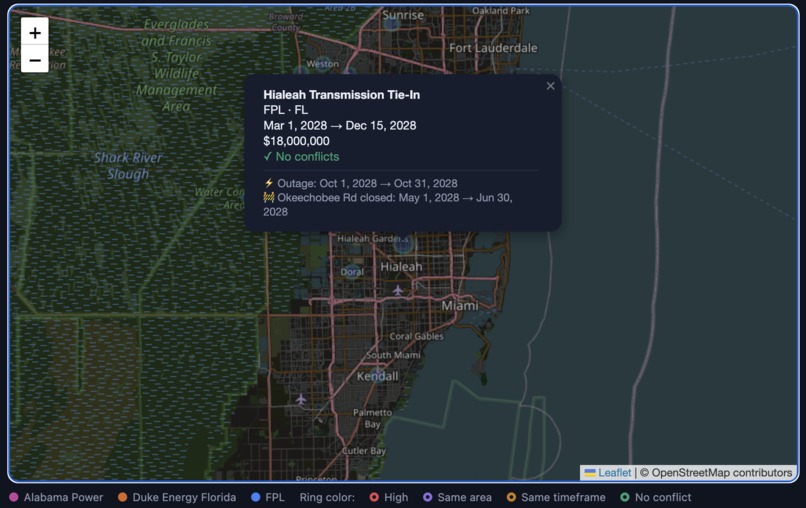
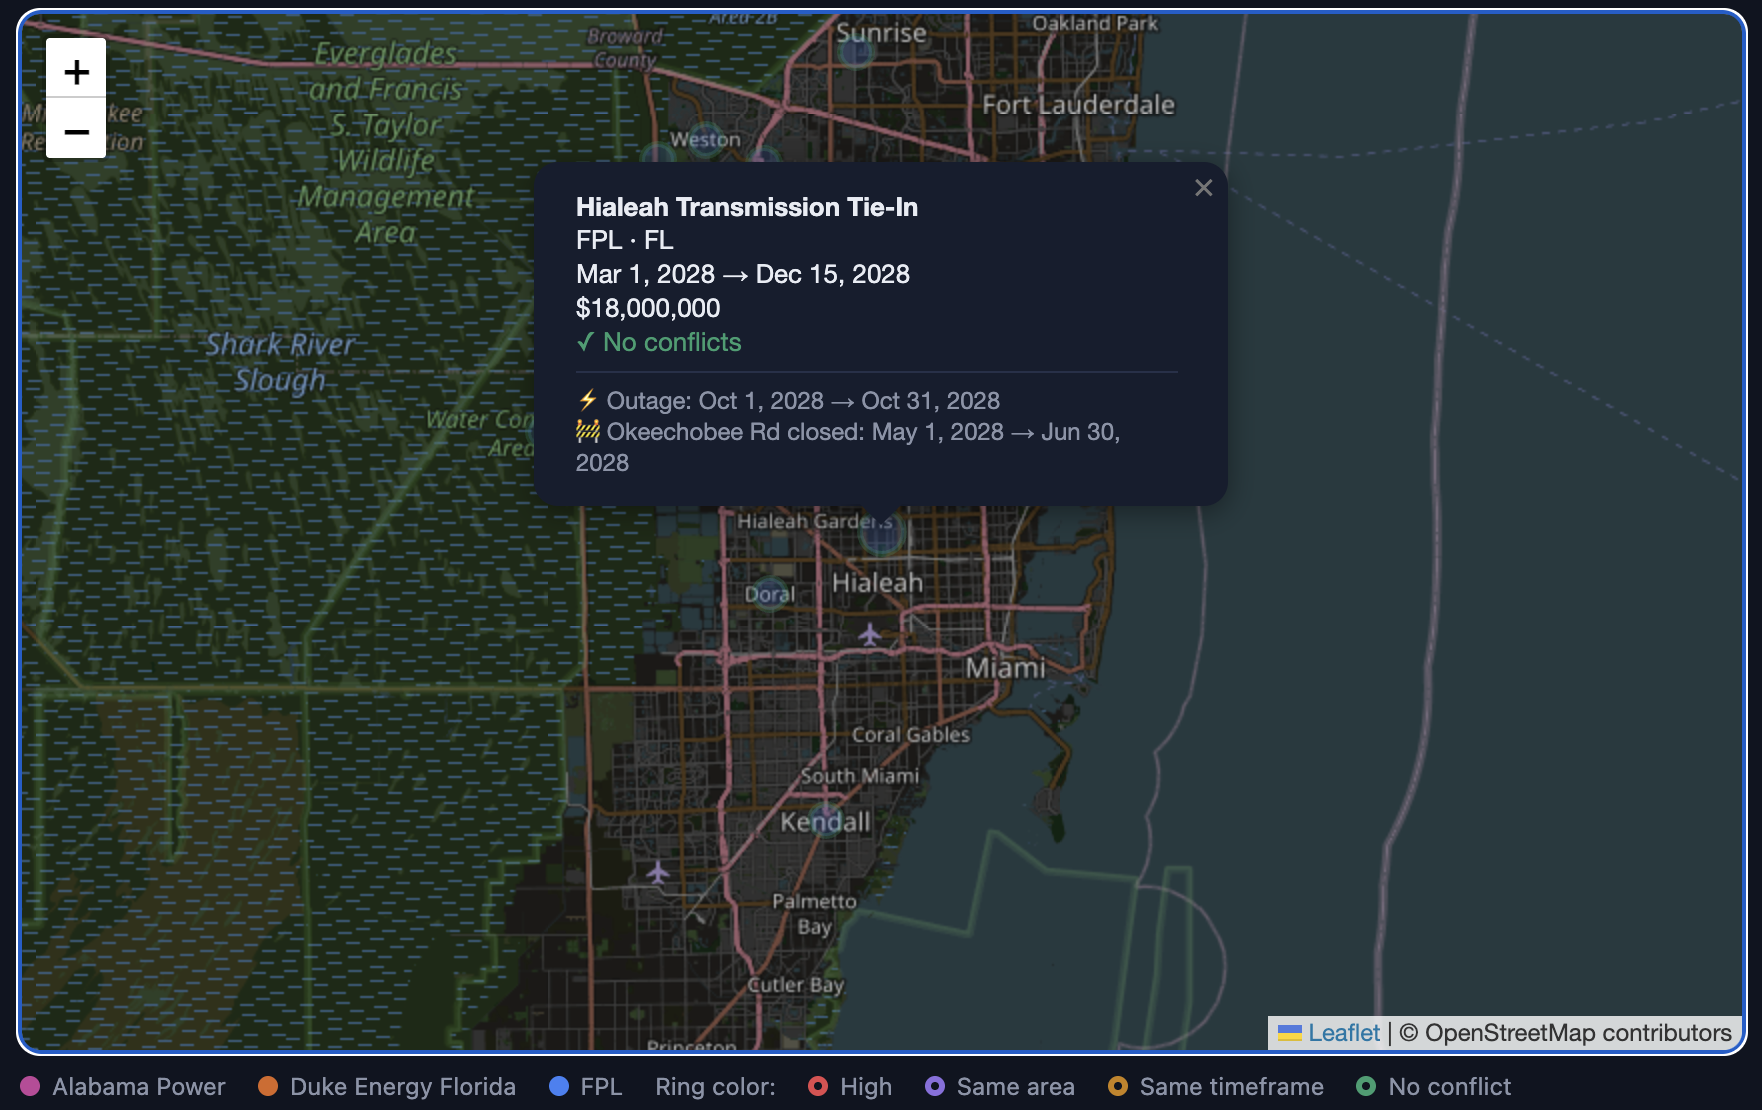
Map view of no conflict zones
-
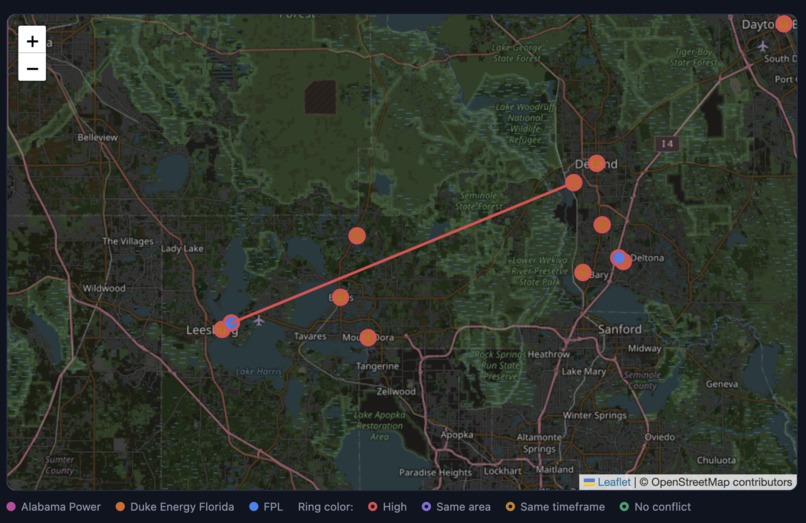
Map view of conflict zones
-
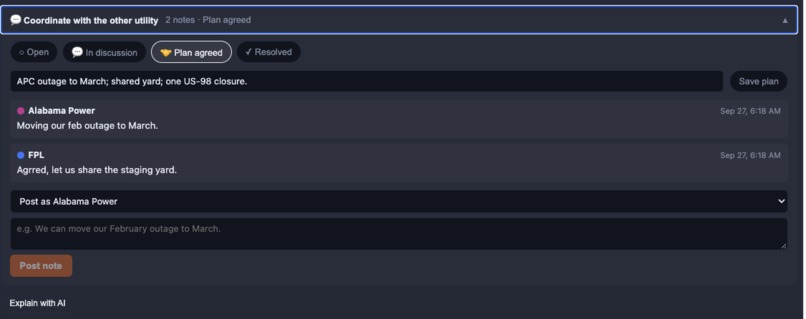
Coordination Chat

Inspiration
Picture a road on the Florida–Alabama line. One utility closes it to work on its power lines; weeks later, the utility across the state line closes the same road for its own project. Two detours, two crews, two budgets paying for work that could have happened once. Nobody did anything wrong. They just couldn't see each other's plans.
Utilities plan construction years ahead, mostly in isolation, and often report to different state regulators. In 2024, FERC Order 1920 required regional transmission planners to start coordinating because that isolation has been wasting money and slowing down grid buildout. I wanted to build the tool that makes that coordination practical.
What it does
Grid compares the construction plans of neighboring utilities (FPL, Duke Energy Florida and Alabama Power, with more importable), finds where they collide, tells them how to coordinate, and gives them one place to agree on a plan.
- Conflict detection. Every pair of projects from different utilities is checked for being close together (same area), scheduled around the same time (same timeframe), or both (high severity). Pairs that cross a state line are flagged cross-state, since each utility reports to a different state regulator and neither filing shows the other's work.
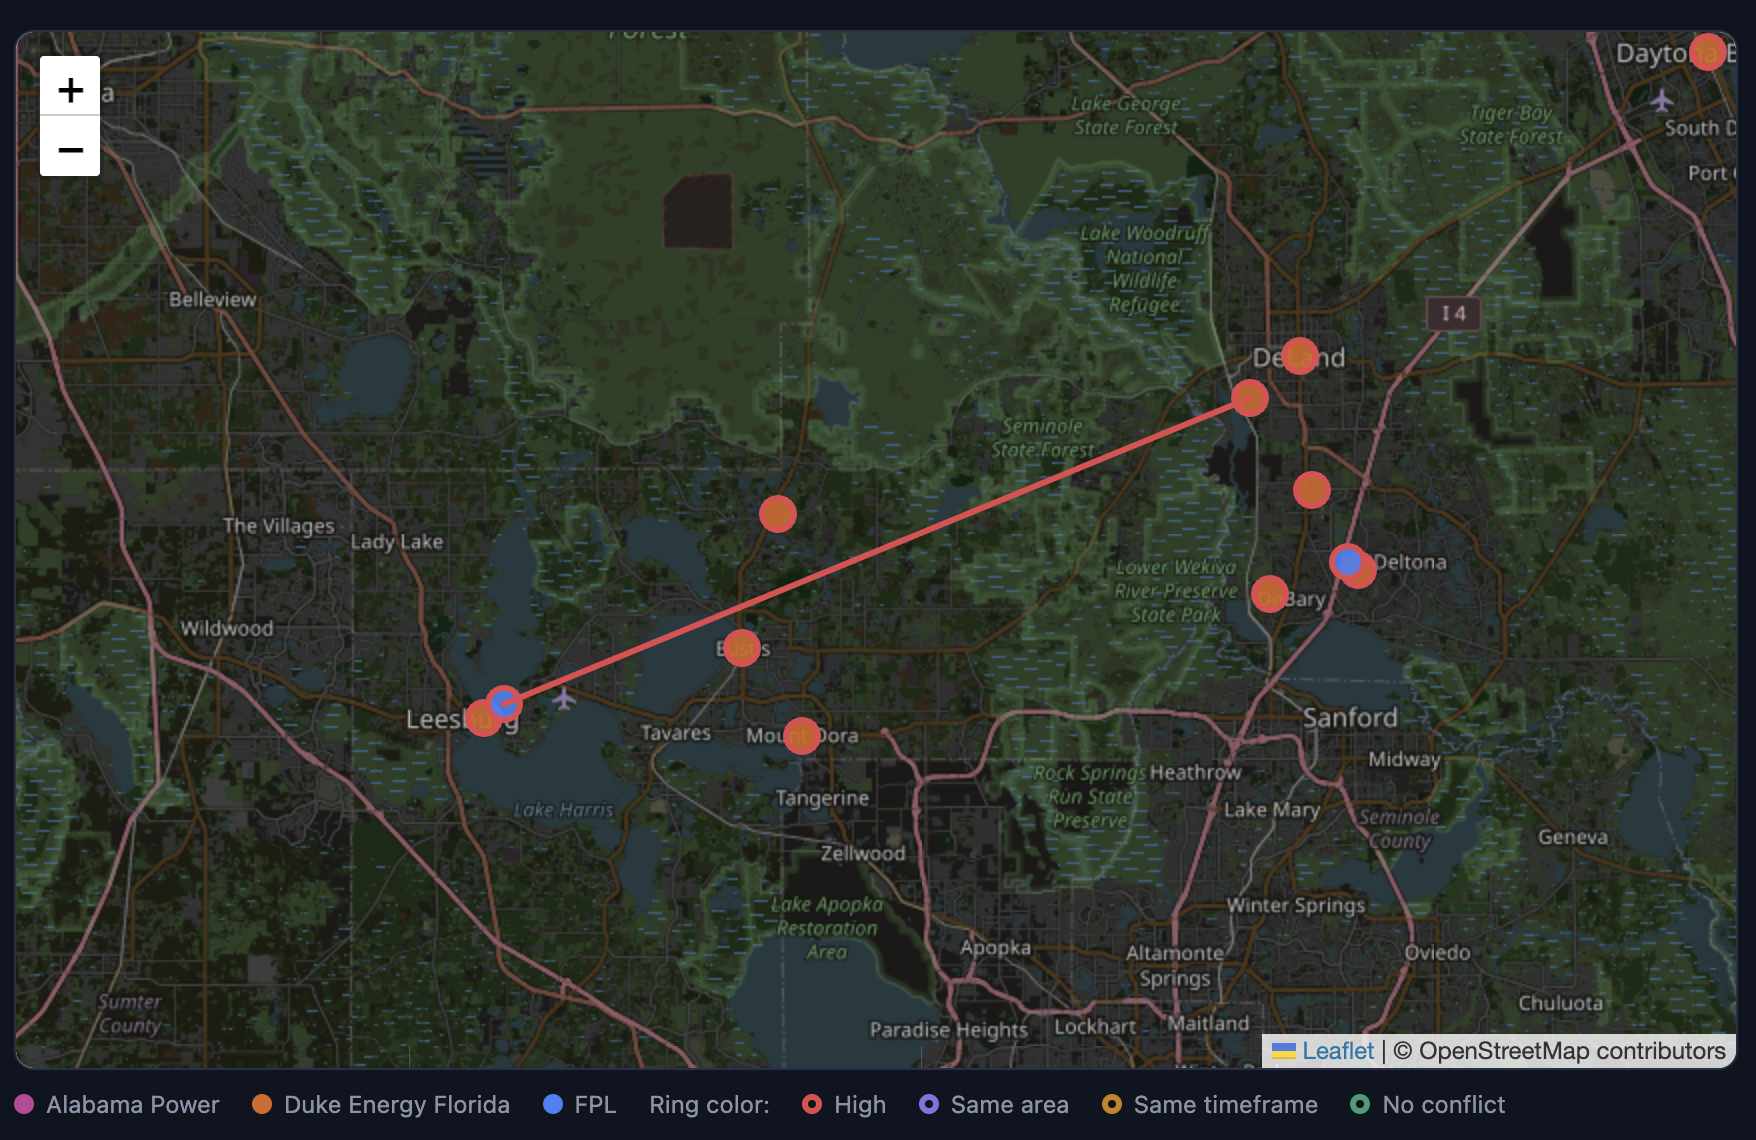
- Detection circles on the map. Selecting a conflict draws each project's detection radius, so you can see why it's flagged: the other project sits inside the circle.
- Coordination suggestions. Each conflict comes with concrete, rule-based advice: share crews and a staging yard, reuse surveys and permits, stagger outages, combine road closures into one detour, plus estimated savings.
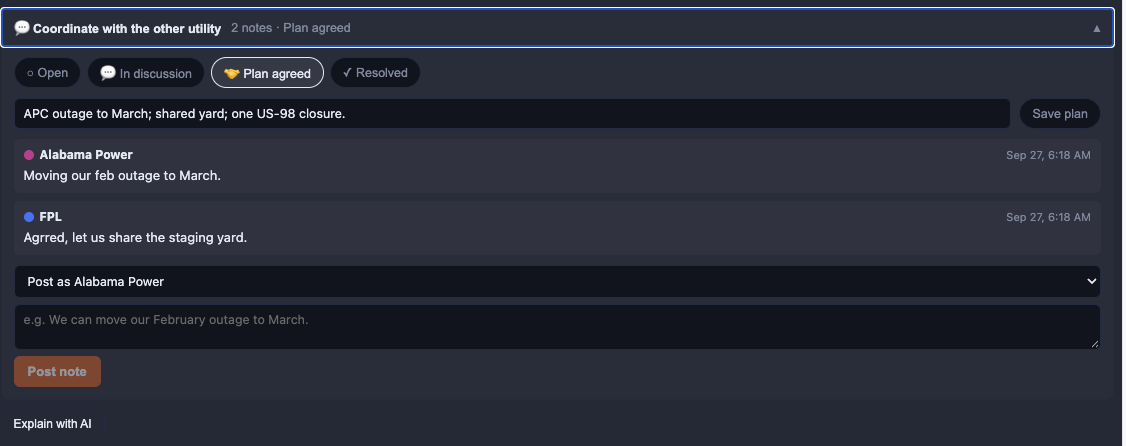
- A place to agree on a plan. Each conflict has a coordination thread where the two utilities post notes and move it from Open → In discussion → Plan agreed → Resolved, with the agreed plan recorded.
- Hidden dependency risks. Grid flags problems distance alone misses: stacked outages, where both utilities take equipment offline nearby at the same time and leave less backup if something else fails, and shared road closures.
- Adjustable rules. Planners can tune every detection threshold live (distance, timing buffer, regional radius, outage radius) and watch conflicts update.
- Calendar. A day-by-day view of which conflicts and risks are active, and when.
- Insights dashboard. Conflict share, severity breakdown, exposure by utility, cross-state pairs, active projects per year, estimated savings, and how many conflicts already have an agreed plan.
- Import and export. Any utility can upload its plan as a CSV, validated row by row. One click exports every conflict, suggestion and agreed plan as a report to share.
- Traceable data. Every project shows its source. Real projects link to their Florida Public Service Commission dockets; illustrative ones are clearly labeled.
- Explain with AI. An optional plain-English second opinion on any conflict, from Google Gemini.
How I built it
- Backend: Python with FastAPI, pandas and SQLite. Conflict detection compares every cross-utility project pair using great-circle (haversine) distance and schedule overlap with a configurable buffer. Timing-only matches must also fall within a regional radius, so projects hundreds of miles apart aren't flagged. Separate checks find overlapping outage windows and shared road closures.
- Frontend: React with Vite, and Leaflet with OpenStreetMap for the map. The charts and calendar are hand-built in SVG and CSS, with colors checked for color-blind accessibility.
- AI: Google Gemini generates the explanations, with automatic retries and fallback models when the service is busy.
- Data: the anchor projects are real: FPL's Andytown–Oasis 500/230kV line (FPSC Docket 20260020) and Duke's DeLand West–Dona Vista 230kV line (FPSC Docket 20250078). The rest are clearly labeled synthetic projects, some placed to test each conflict type, including a cross-state pair across Perdido Bay.
Challenges I ran into
- Defining a conflict without drowning in noise. A pure date match flagged projects 300 miles apart. Adding a regional radius made timing-only conflicts meaningful.
- Finding public data. Future construction plans live in scattered regulatory filings, not tidy datasets, so I had to decide what to enter from real dockets and what to simulate honestly.
- Keeping the data in sync. Early on, edits to the source files never reached the app; I rebuilt it to re-sync on every start while keeping user-added projects.
- Unreliable AI at peak times. Gemini often returned "high demand" errors, so I added retries, fallback models and a clear "Try again" instead of a dead end.
- Accessible color. With utilities, severity levels and risks all on one map, I ran out of colors that color-blind users could tell apart, so risks use icons and dotted lines instead of a new color.
Accomplishments that I'm proud of
- Going beyond "these projects are close" to show why coordination matters (stacked outages and shared road closures) and what to do about it.
- Closing the loop: two utilities can go from "we found a conflict" to "we have a plan" in one place.
- A real cross-state example: Alabama Power and FPL six miles apart across Perdido Bay, with overlapping schedules, outages and a shared US-98 closure.
- Every project traceable to its source, with real projects linked to their public dockets.
- Detection rules planners can adjust live, instead of trusting hard-coded constants.
What I learned
- How utility construction planning and regulatory filings work, and what FERC Order 1920 changes.
- That the rules for what counts as a conflict matter more than the algorithm: small threshold changes swing the results a lot.
- Geospatial basics like great-circle distance, and turning thresholds into something a planner can see on a map.
- Designing for failure: an AI feature has to fail gracefully, and a data tool has to be honest about where its data comes from.
What's next for Grid
- Real data at scale: automatically import projects from public filings (ten-year site plans, PSC dockets) and add more neighboring utilities across state lines.
- Accounts: each utility signs in and speaks only for itself in coordination threads.
- Resource planning: estimate crew and equipment demand by region and month, and suggest which projects could share them.
- Alerts: notify both utilities as soon as a newly filed project creates a conflict.

Log in or sign up for Devpost to join the conversation.