-
-
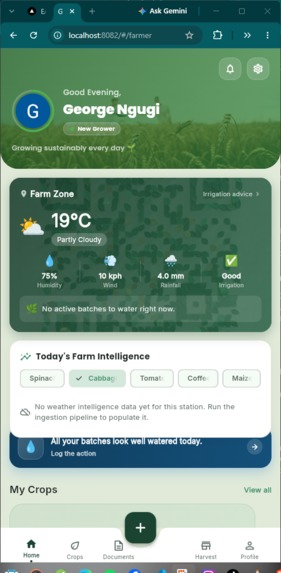
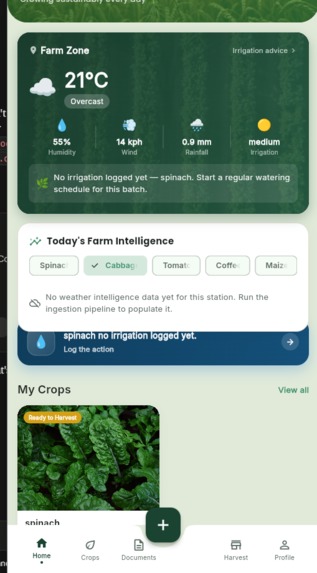
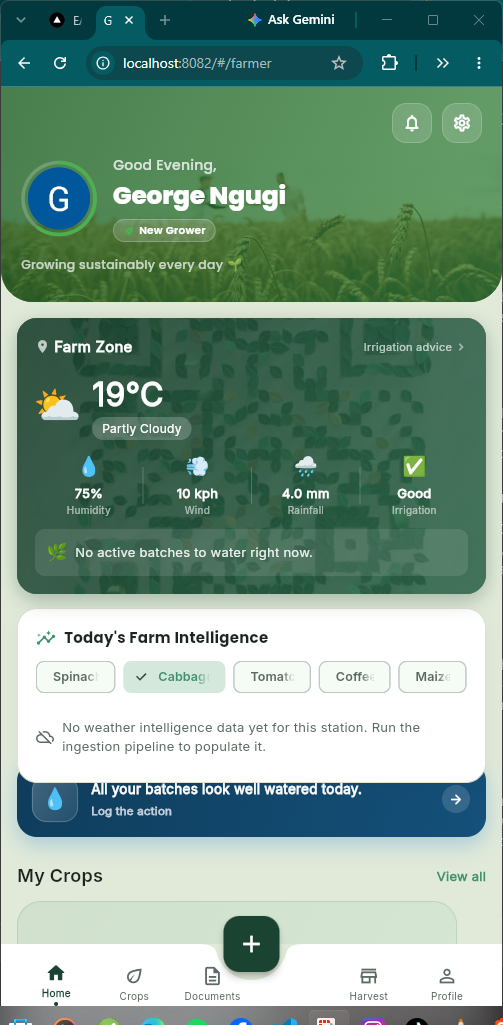
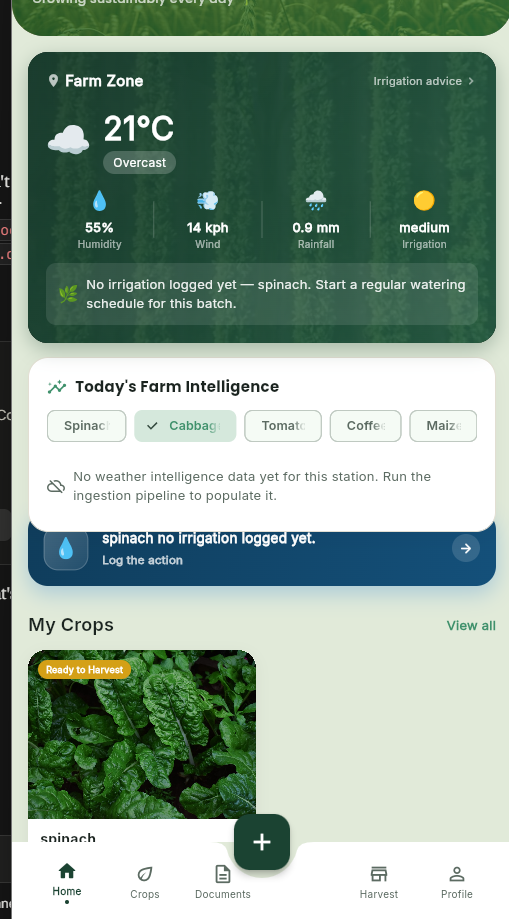
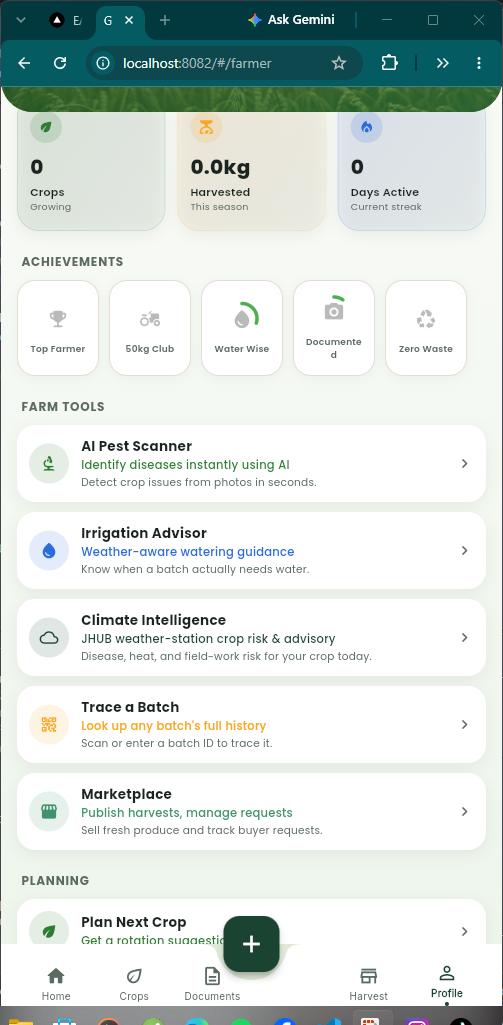
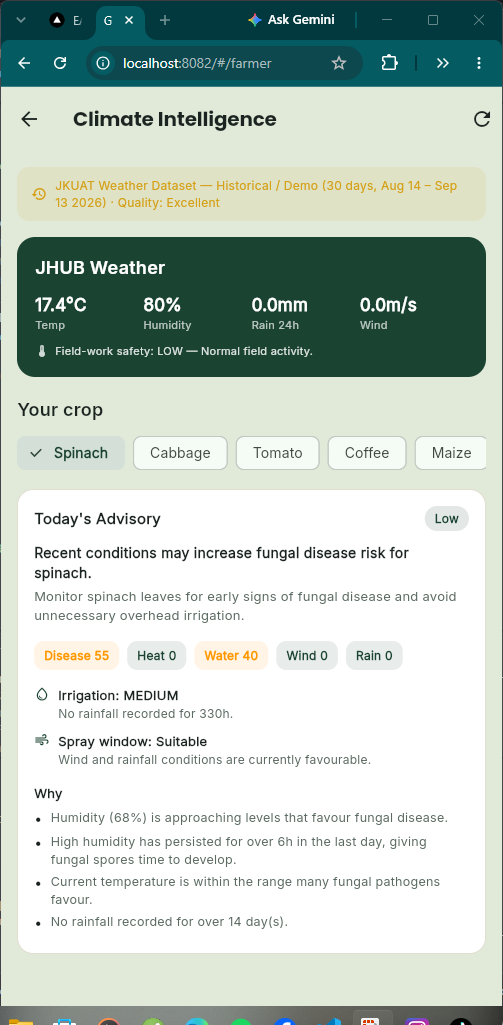
Farmers main dashboard with weather updates and irrgation advisor.
-
-
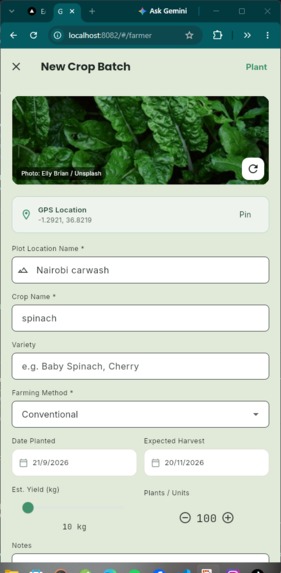
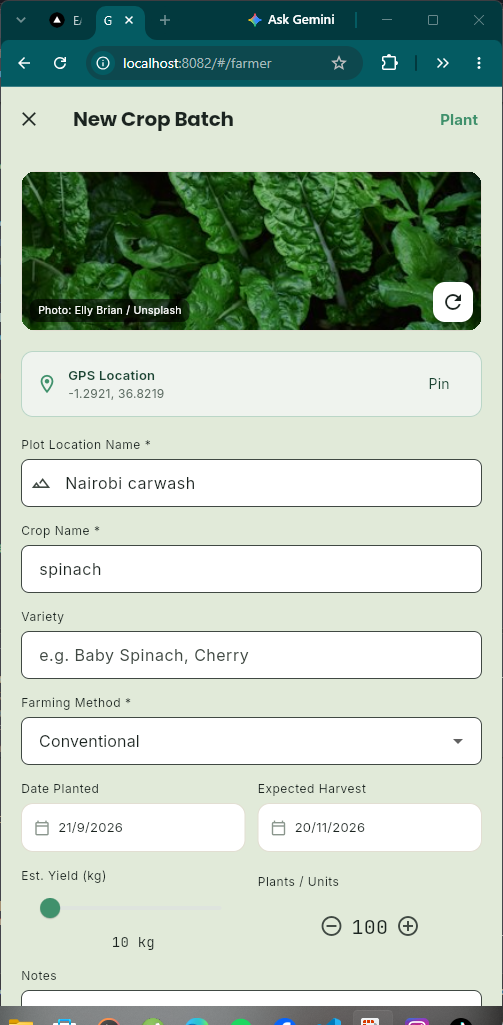
Planting a batch .
-
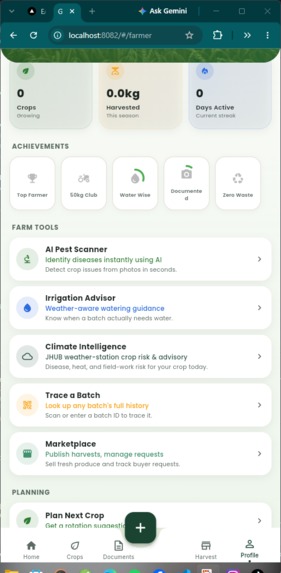
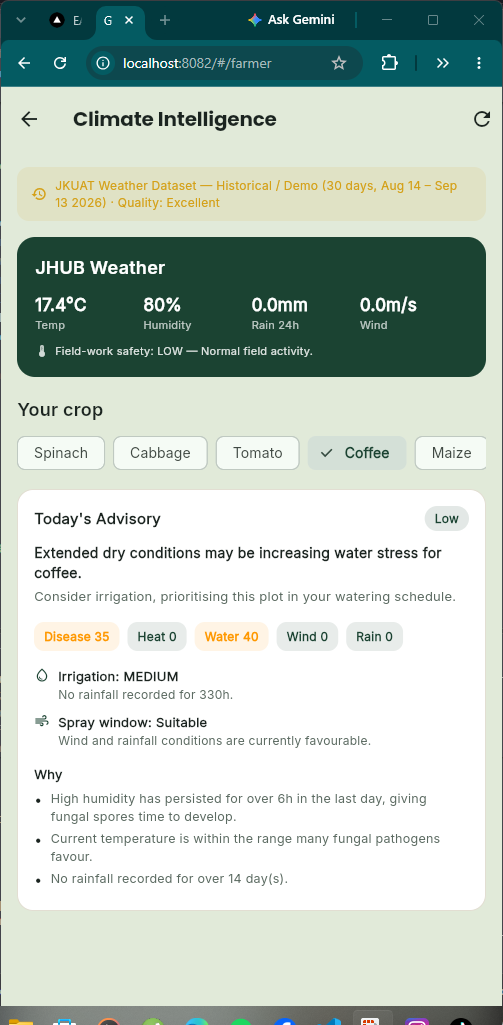
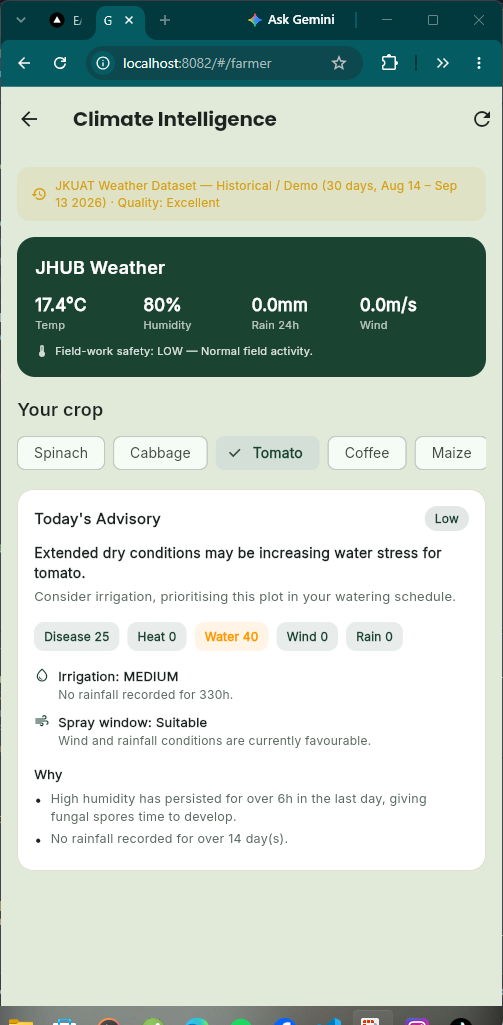
uses environmental signals such as humidity, rainfall and temperature to flag potential pest and disease risk .
-
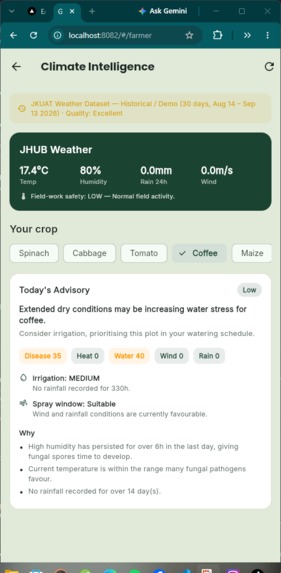
With the help of data from JKUAT Conduit, GreenTrack checks the health and general performance of crops.
-
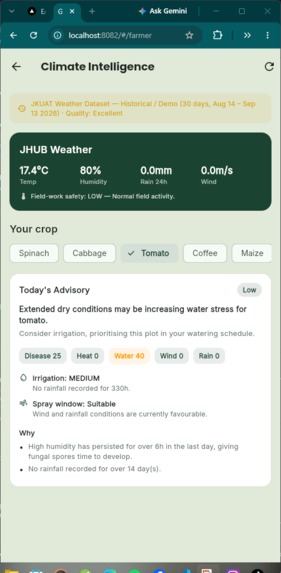
Tomato growth and crop performance tracked using GreenTrack.
-
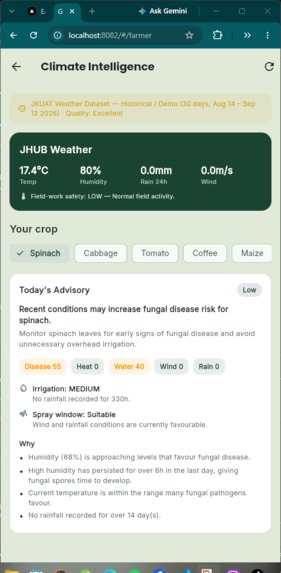
spinach early warnings for crop monitoring.
-
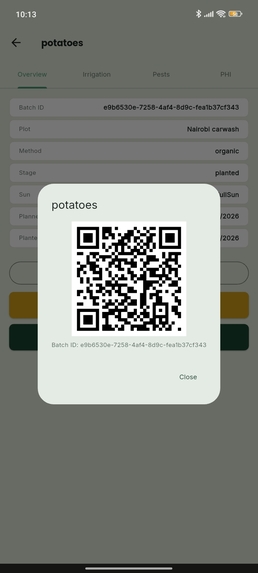
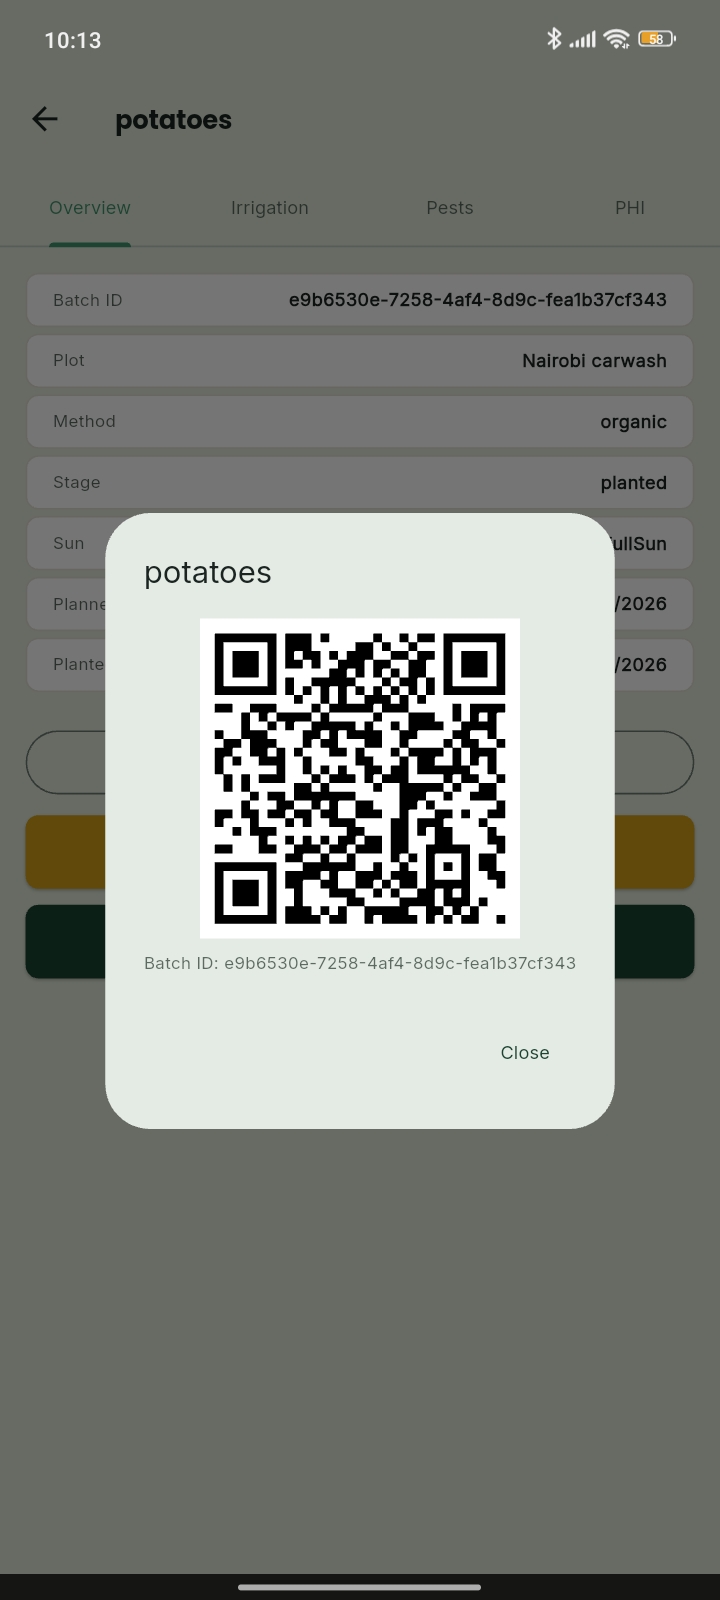
qr code that follows a batch through all stages .
-
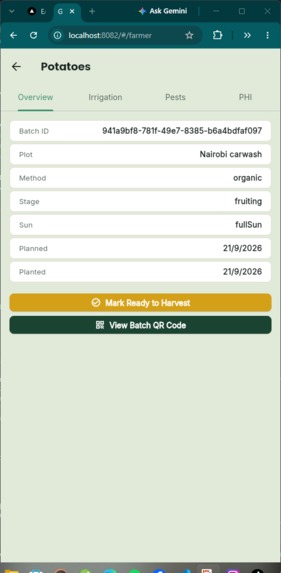
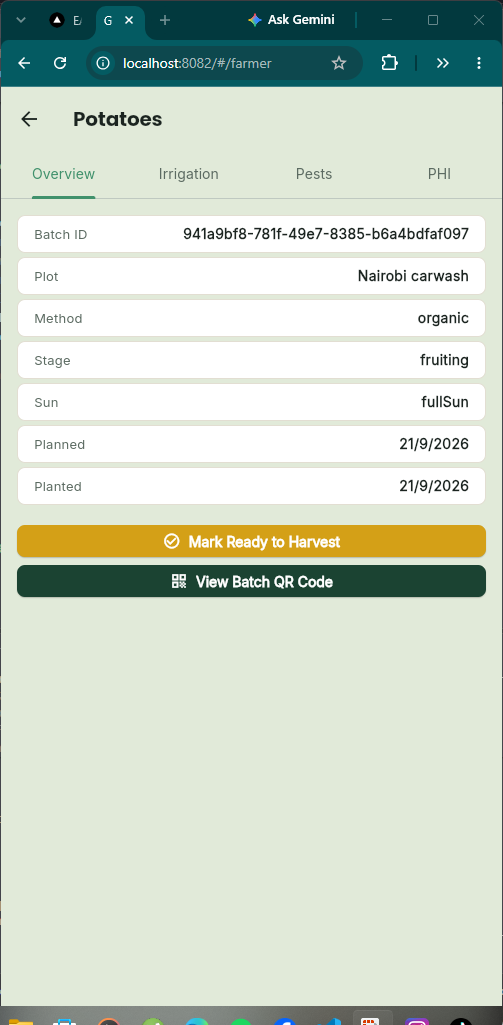
information of a crop which is also the information that appears after scan.
-
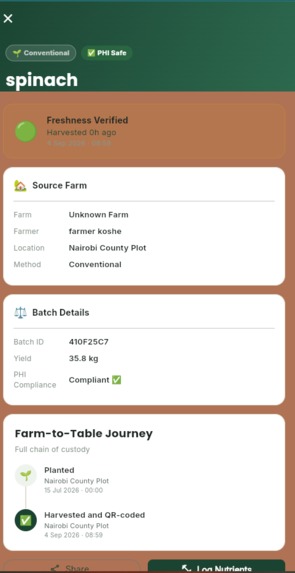
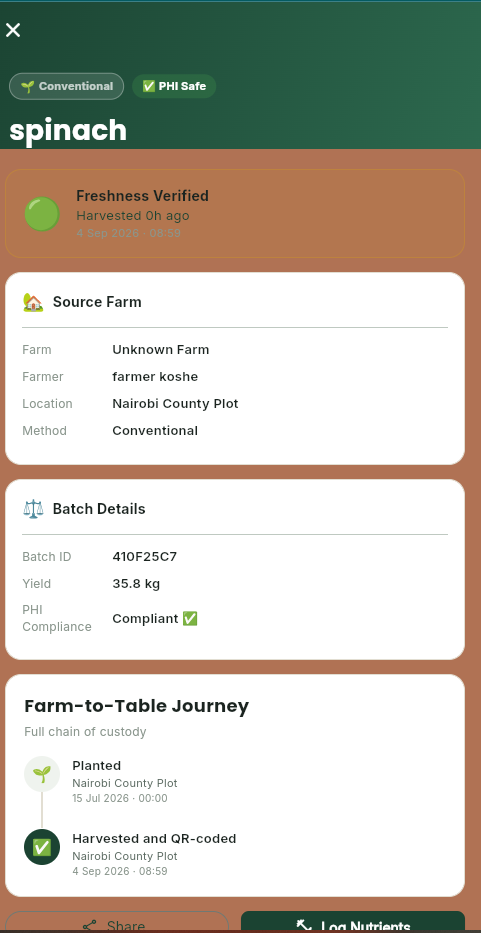
Batch details after scan
-
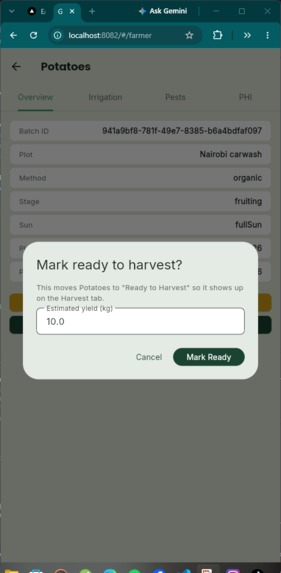
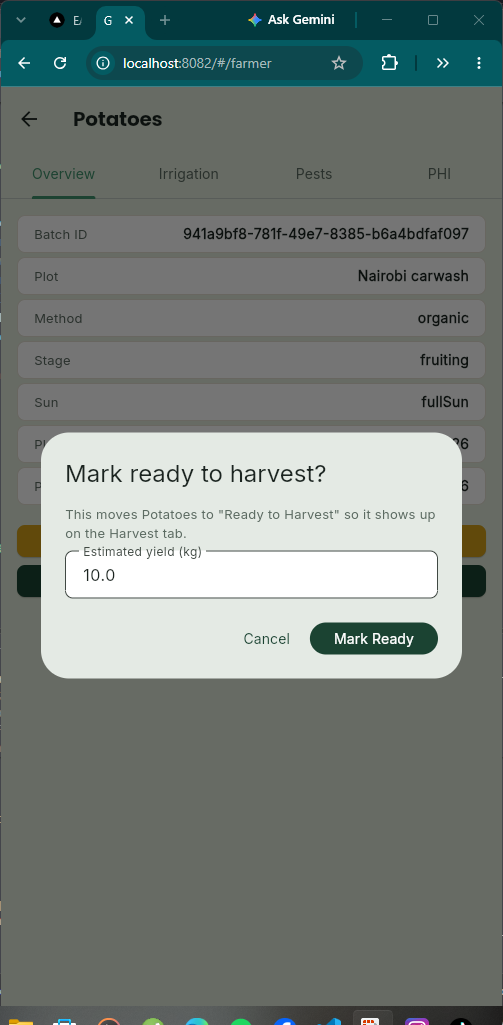
Farmers can mark a batch as ready for harvest and enter its estimated weight.
-
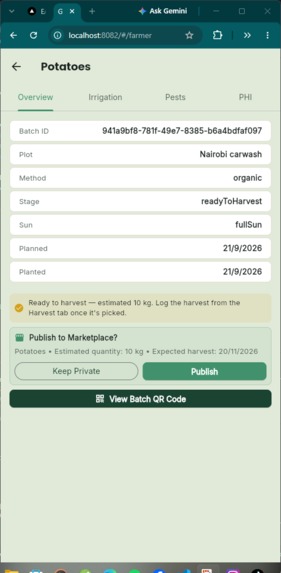
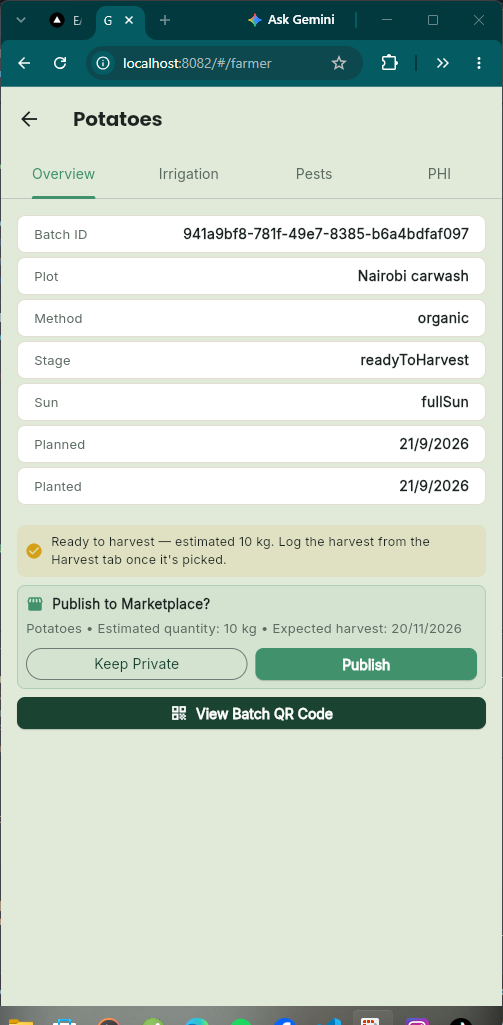
After marking a batch ready for harvest, the farmer can publish it to the market and notifying customers .
-
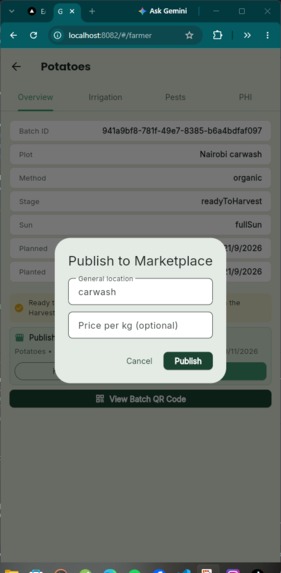
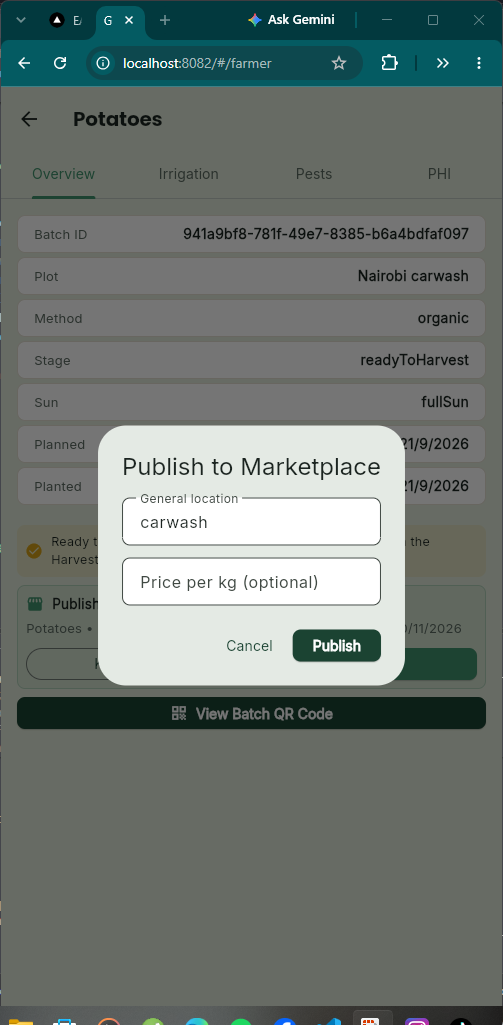
Farmer sets a price per kg and location of farm.
-
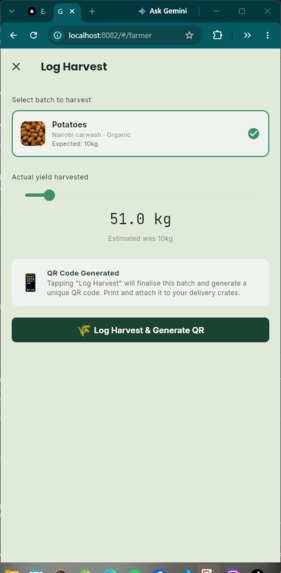
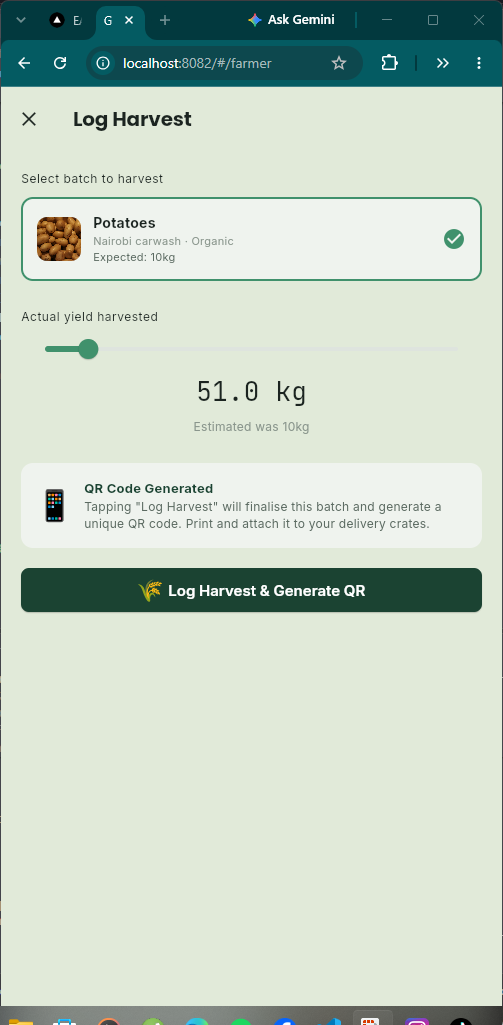
Actual weight is recorded, and a unique QR code is generated for traceability.
Inspiration
The idea grew from working around agriculture and realizing that useful information is often scattered across different places.
A farmer may have weather information in one application, crop knowledge from an agricultural officer, records written on paper, and information about buyers somewhere else. We wanted to bring these pieces closer together.
For the Hack The Weather challenge, we focused particularly on weather intelligence. Instead of treating weather as a separate forecast screen, we explored how environmental data could become part of the farming workflow.
That led us to build GreenTrack around the idea:
Observe → Understand → Act → Track
The inspiration became even stronger when we took the project beyond the screen and interacted with people involved in agriculture. Those conversations helped us understand that farmers don't just need more data — they need information that fits into the decisions they already make.
What it does
GreenTrack turns real-time JKUAT weather telemetry into actionable farming decisions—combining pest risk warnings, AI leaf diagnostics, pre-harvest safety countdowns, and consumer QR traceability into an end-to-end Flutter application.
GreenTrack is a Garden-to-Table Tracker that connects weather intelligence, garden activities, harvest records, nutrition information and traceability in one workflow.
At the center of GreenTrack is the farmer/gardener.
A user can keep track of garden activities and harvests while using environmental information as context for what is happening around their crops.
GreenTrack brings together:
- Weather intelligence — environmental conditions such as temperature, rainfall, humidity and wind are brought into the agricultural workflow.
- Garden and crop tracking — users can record what they are growing and what is happening in their garden.
- Harvest tracking — harvests can be recorded with information such as crop, stage, weight and time.
- Nutrition information — harvested produce can be connected to nutritional information.
- QR traceability — harvest information can be connected to a QR code, creating a bridge between a physical harvest and its digital record.
- Market connectivity — the project explores how farmers can move from simply recording a harvest toward discovering opportunities to share or trade it.
The goal isn't to give farmers another dashboard full of numbers.
The goal is to make information connected, understandable and useful at the point where decisions are made.
How we built it
We built GreenTrack as a cross-platform application using Flutter, with cloud services and external APIs supporting the application.
The system brings together several components:
Mobile application
We used Flutter to create the main GreenTrack experience, allowing us to build a consistent application while keeping the architecture flexible for future expansion.
Weather and environmental data
Weather data became one of the central components of the Hack The Weather version of GreenTrack.
We worked with environmental datasets and weather APIs to explore how measurements such as temperature, rainfall, humidity, pressure and wind could provide context around agricultural activities.
Rather than simply displaying raw readings, we designed the experience around the relationship between environmental conditions and farming activities.
Cloud infrastructure
We used Firebase for authentication and cloud-backed application services, while integrating external APIs where specialized data or intelligence was required.
Traceability
Harvest records can be associated with QR-based identification, allowing information about a harvest to be connected to a physical product.
Iterative development
GreenTrack went through multiple iterations.
We started with the basic product concept, tested assumptions, encountered technical problems, gathered feedback, and then adjusted the architecture and workflows.
This meant that the final project is not simply the result of coding a predetermined specification — it is the result of continuously asking:
Does this actually make sense for the person using it?
Challenges we ran into
One of our biggest challenges was turning weather data into something meaningful for agriculture.
It is relatively easy to display:
Temperature: 22°C
Humidity: 76%
Rainfall: 4mm
But the harder question is:
What does this information actually mean for the person managing a crop?
That forced us to think beyond API integration and into data interpretation, user experience and agricultural context.
We also encountered the practical challenges of building a system that depends on several services at once.
Authentication, Firebase configuration, external APIs, data synchronization and application state all introduced their own failure points.
There were also moments where we had to step back from adding features and focus on stability first.
Another challenge was discovering that assumptions made during development do not always survive contact with real users.
Field interaction helped us identify areas where the product needed to be simpler, clearer or more directly connected to actual agricultural workflows.
Accomplishments that we're proud of
We're proud that GreenTrack evolved beyond being a conceptual hackathon application.
We built a working cross-platform prototype, integrated real environmental data, created agricultural tracking workflows, and connected those workflows to harvest, nutrition and traceability concepts.
But one of the accomplishments we're most proud of is taking the project into the real world.
Instead of evaluating GreenTrack only from our development environment, we interacted with people involved in agriculture and used those observations to influence the product.
That changed the way we think about the project.
We also challenged ourselves to make weather data a functional part of the product, rather than simply adding a weather widget because the challenge involved weather.
GreenTrack became an experiment in asking:
How can environmental data become part of an agricultural decision rather than just another number on a screen?
That question shaped much of our development.
What we learned
The biggest lesson from GreenTrack was that building technology for real-world problems is an iterative process between data, code and people.
We learned that more data does not automatically mean better decisions.
Data needs context.
We learned that a weather API can be technically correct while still being practically unhelpful if the user doesn't understand what the information means for their situation.
We also learned that field interaction can expose assumptions that are difficult to discover while coding.
Technically, the project strengthened our experience with:
- Flutter application development
- API integration
- Firebase authentication and cloud services
- Environmental and weather datasets
- Data-driven application workflows
- QR-based traceability
- Application state and reliability
- Iterative product development
But beyond the technical lessons, GreenTrack taught us to think more carefully about why a feature exists before deciding how to build it.
What's next for GreenTrack
GreenTrack is still evolving.
Our next focus is strengthening the relationship between weather intelligence, crop activities, harvests and market access.
We want to move toward a system where environmental information doesn't simply tell a farmer what the weather is — it provides useful context around what is happening in their garden and what they can consider doing next.
We also want to continue improving the reliability of the platform, strengthen agricultural intelligence, expand field validation, and make the experience increasingly useful in environments where connectivity and digital infrastructure may be limited.
The longer-term vision is a connected journey:
Weather → Garden → Crop → Harvest → Nutrition → Market → Consumer
GreenTrack started as our response to a hackathon challenge.
What we are building now is an experiment in how technology can turn environmental and agricultural data into something more connected, understandable and actionable — from the garden to the table.


Log in or sign up for Devpost to join the conversation.