-
-
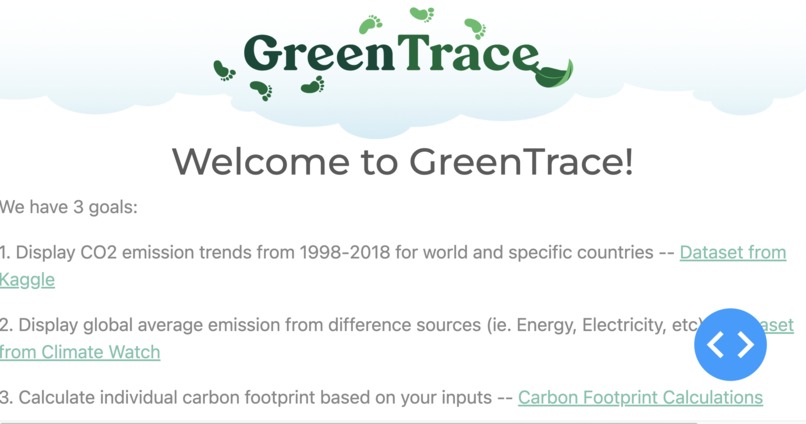
Screenshot of our project.

Inspiration
Human-induced climate change is primarily caused by our carbon footprint, which is the total amount of greenhouse gases a person emits. The global average for greenhouse gas emissions per person is 4 tons, but in America, it is four times higher at 16 tons per person per year. This high level of emissions has devastating effects on the planet, such as destroying natural habitats and polluting the air we breathe, leading to global warming. To mitigate the effects of climate change, the average greenhouse gas emissions per person must be reduced to 2 tons by 2050. However, many people are unaware of their carbon footprint and may be wasting energy through everyday activities, such as leaving appliances plugged in or using standby power, which accounts for up to 40% of energy use. To address this, GreenTrace offers a solution by helping individuals visualize their carbon footprint using data they input. By making a conscious effort to reduce their carbon footprint, individuals can contribute to preserving the planet and stopping global warming.
What it does
• Visualize the CO2 Emission Trends Worldwide and for Specific Countries
• Visualize the Global Average Emissions from Different Sources
• Calculate your personal Carbon Footprint and visualize the results
How we built it
- Install the required dependencies listed in the project's requirements.txt file using a package manager like pip.
shell $pip install dash $pip install jupyter-dash $pip install pandas $pip install dash_bootstrap_components - Set up a virtual environment for the project using a tool like venv or conda.
- Create a new database and update the connection details in the project's configuration file.
- Run the application with:
$python app.py## Challenges we ran into During the development of our project, one of the main challenges we encountered was selecting the appropriate tools to use. Since our team members had different skill sets and preferences, it was challenging to reach a consensus on which tools to use for building the project. Additionally, we faced difficulty in syncing our work due to differences in software versions and setup configurations. To overcome these challenges, we held team meetings to discuss and evaluate different options, and worked together to ensure that we were all on the same page. We also utilized collaboration tools such as version control to keep our work organized and accessible to everyone on the team. Through effective communication and collaboration, we were able to successfully navigate these challenges and deliver a high-quality project.
Accomplishments that we're proud of
As none of our team members have much experience with hosting frontend projects, we are proud to have implemented the website through Plotly Dash. We're very proud that we were also able to deploy our web app using OnRender to https://greentrace.onrender.com/. We are especially proud of the user interaction components that we added to Dash and the banner we created. Finally, we are also very proud of the GreenTrace logo we designed for the project, it was designed with Figma.
What we learned
We learned to use Python to build a frontend web app that would support user interaction and generate graphs based on user input. We learned to use Dash components such as the Dropdown, RangeSlider, and Input components, and callback functions to graph data based on user input. We learned the amazing tool to use Python code to build a frontend without the need to implement HTML. Finally, we also learned how to deploy websites.
What's next for GreenTrace
First, we would very much like to expand GreenTrace into a multi-page website with navigation bars to help with navigation. We would also like to add in a geographic graph (such as a Chloropeth map) that showcase the different carbon emission trends across the globe. And finally, we would also like to use CSS and dbc.themes.BOOTSTRAP to develop our own theme and style for the website to further beautify it and make it into our own style!


Log in or sign up for Devpost to join the conversation.