-
-
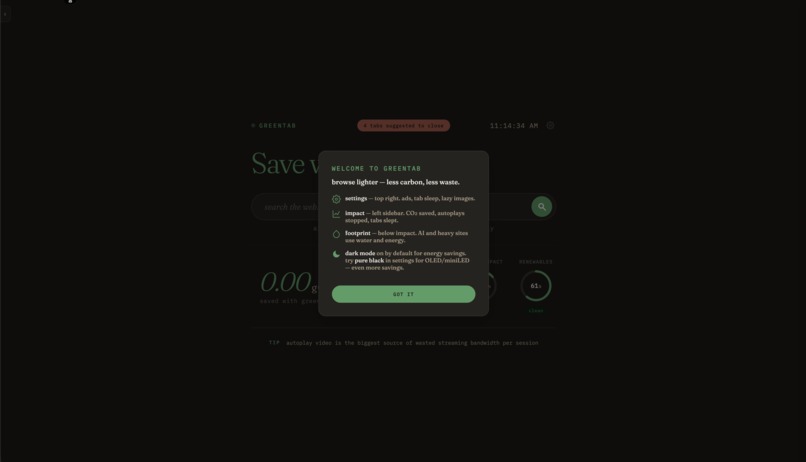
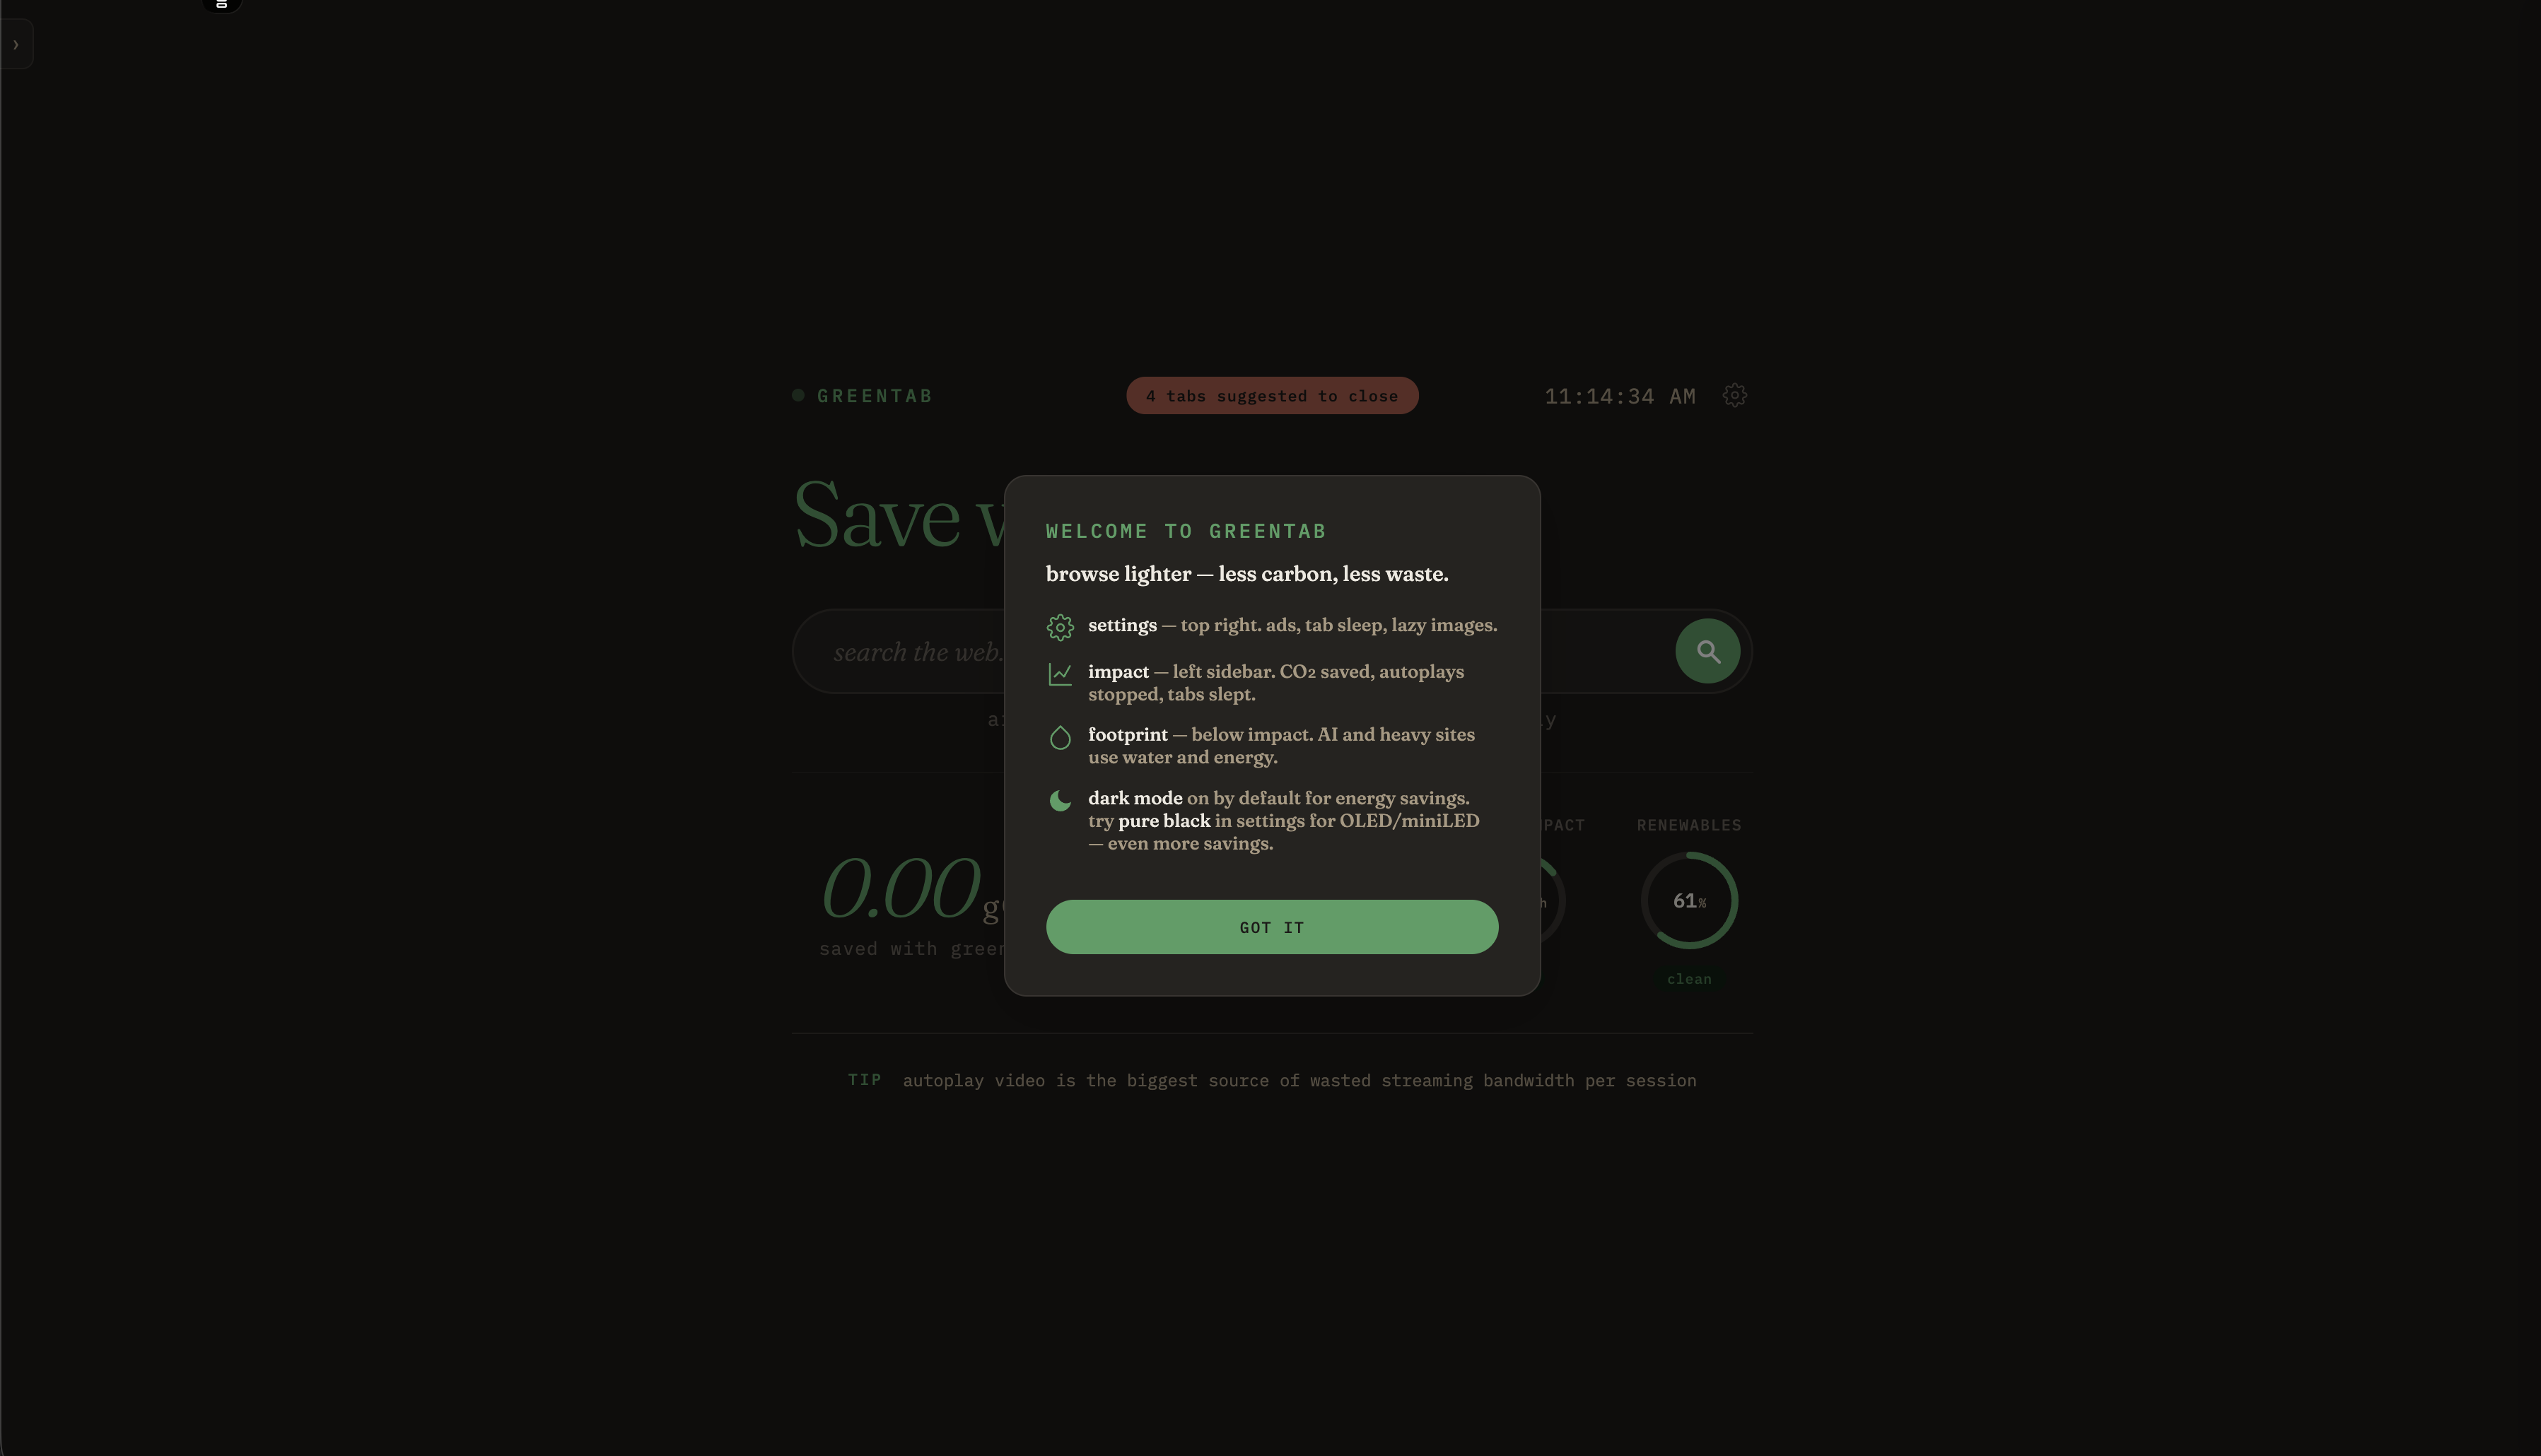
welcome to greentab
-
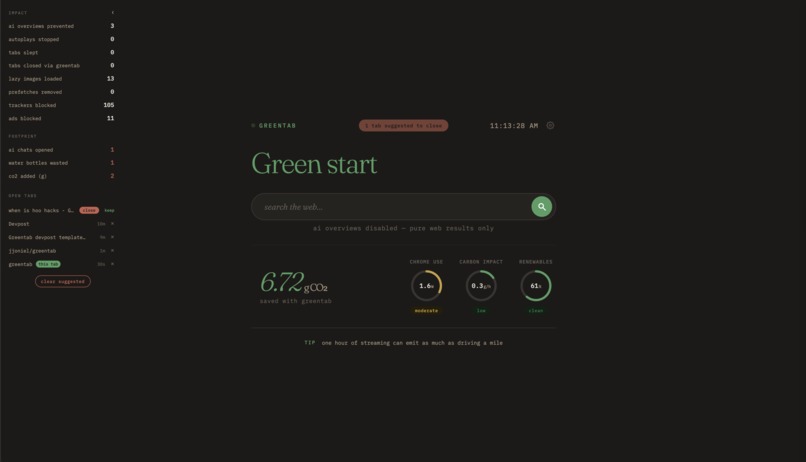
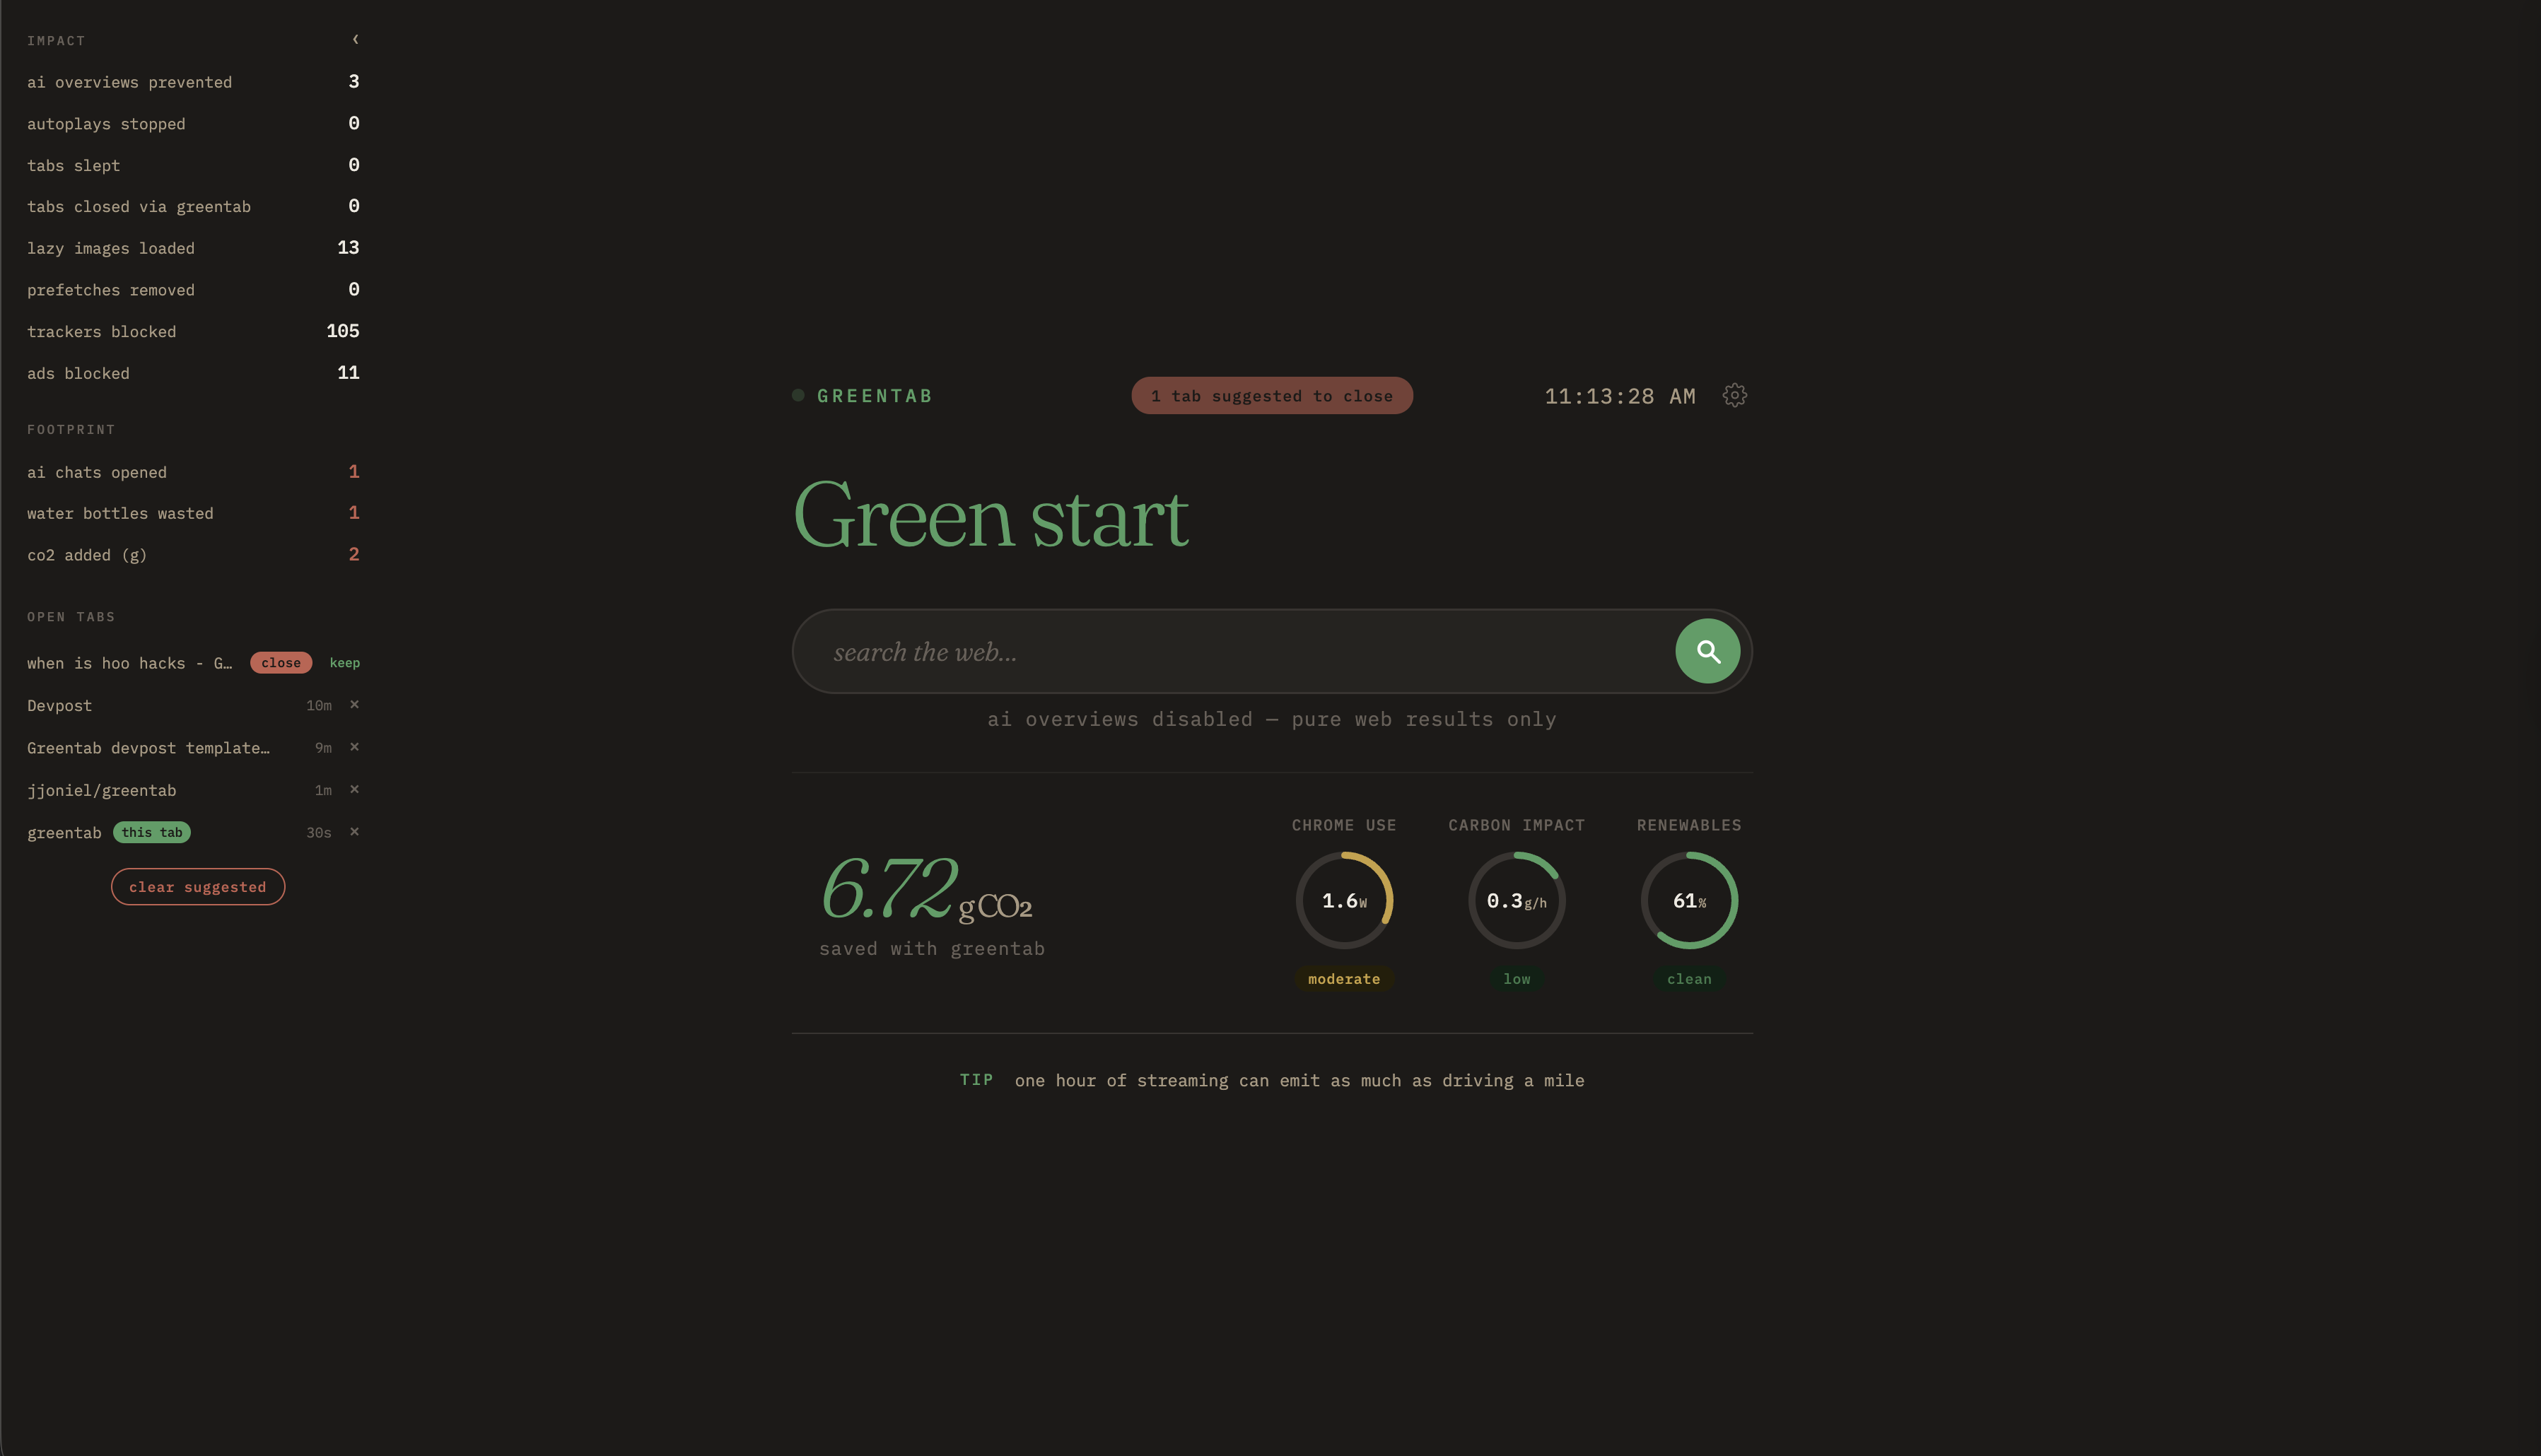
greentab dashboard
-
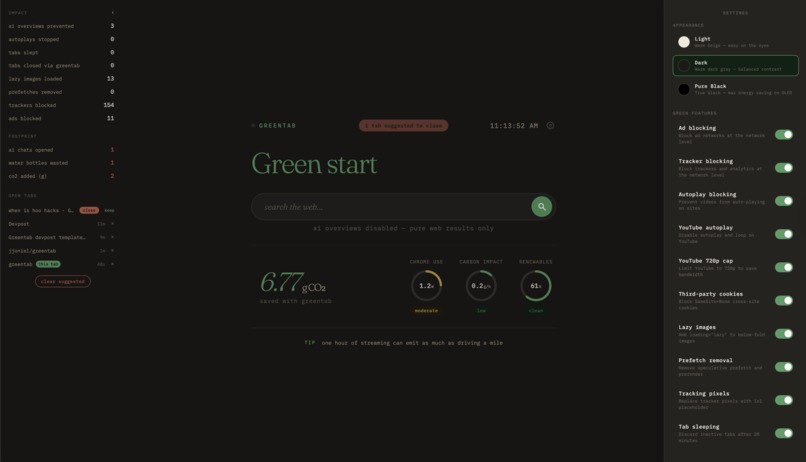
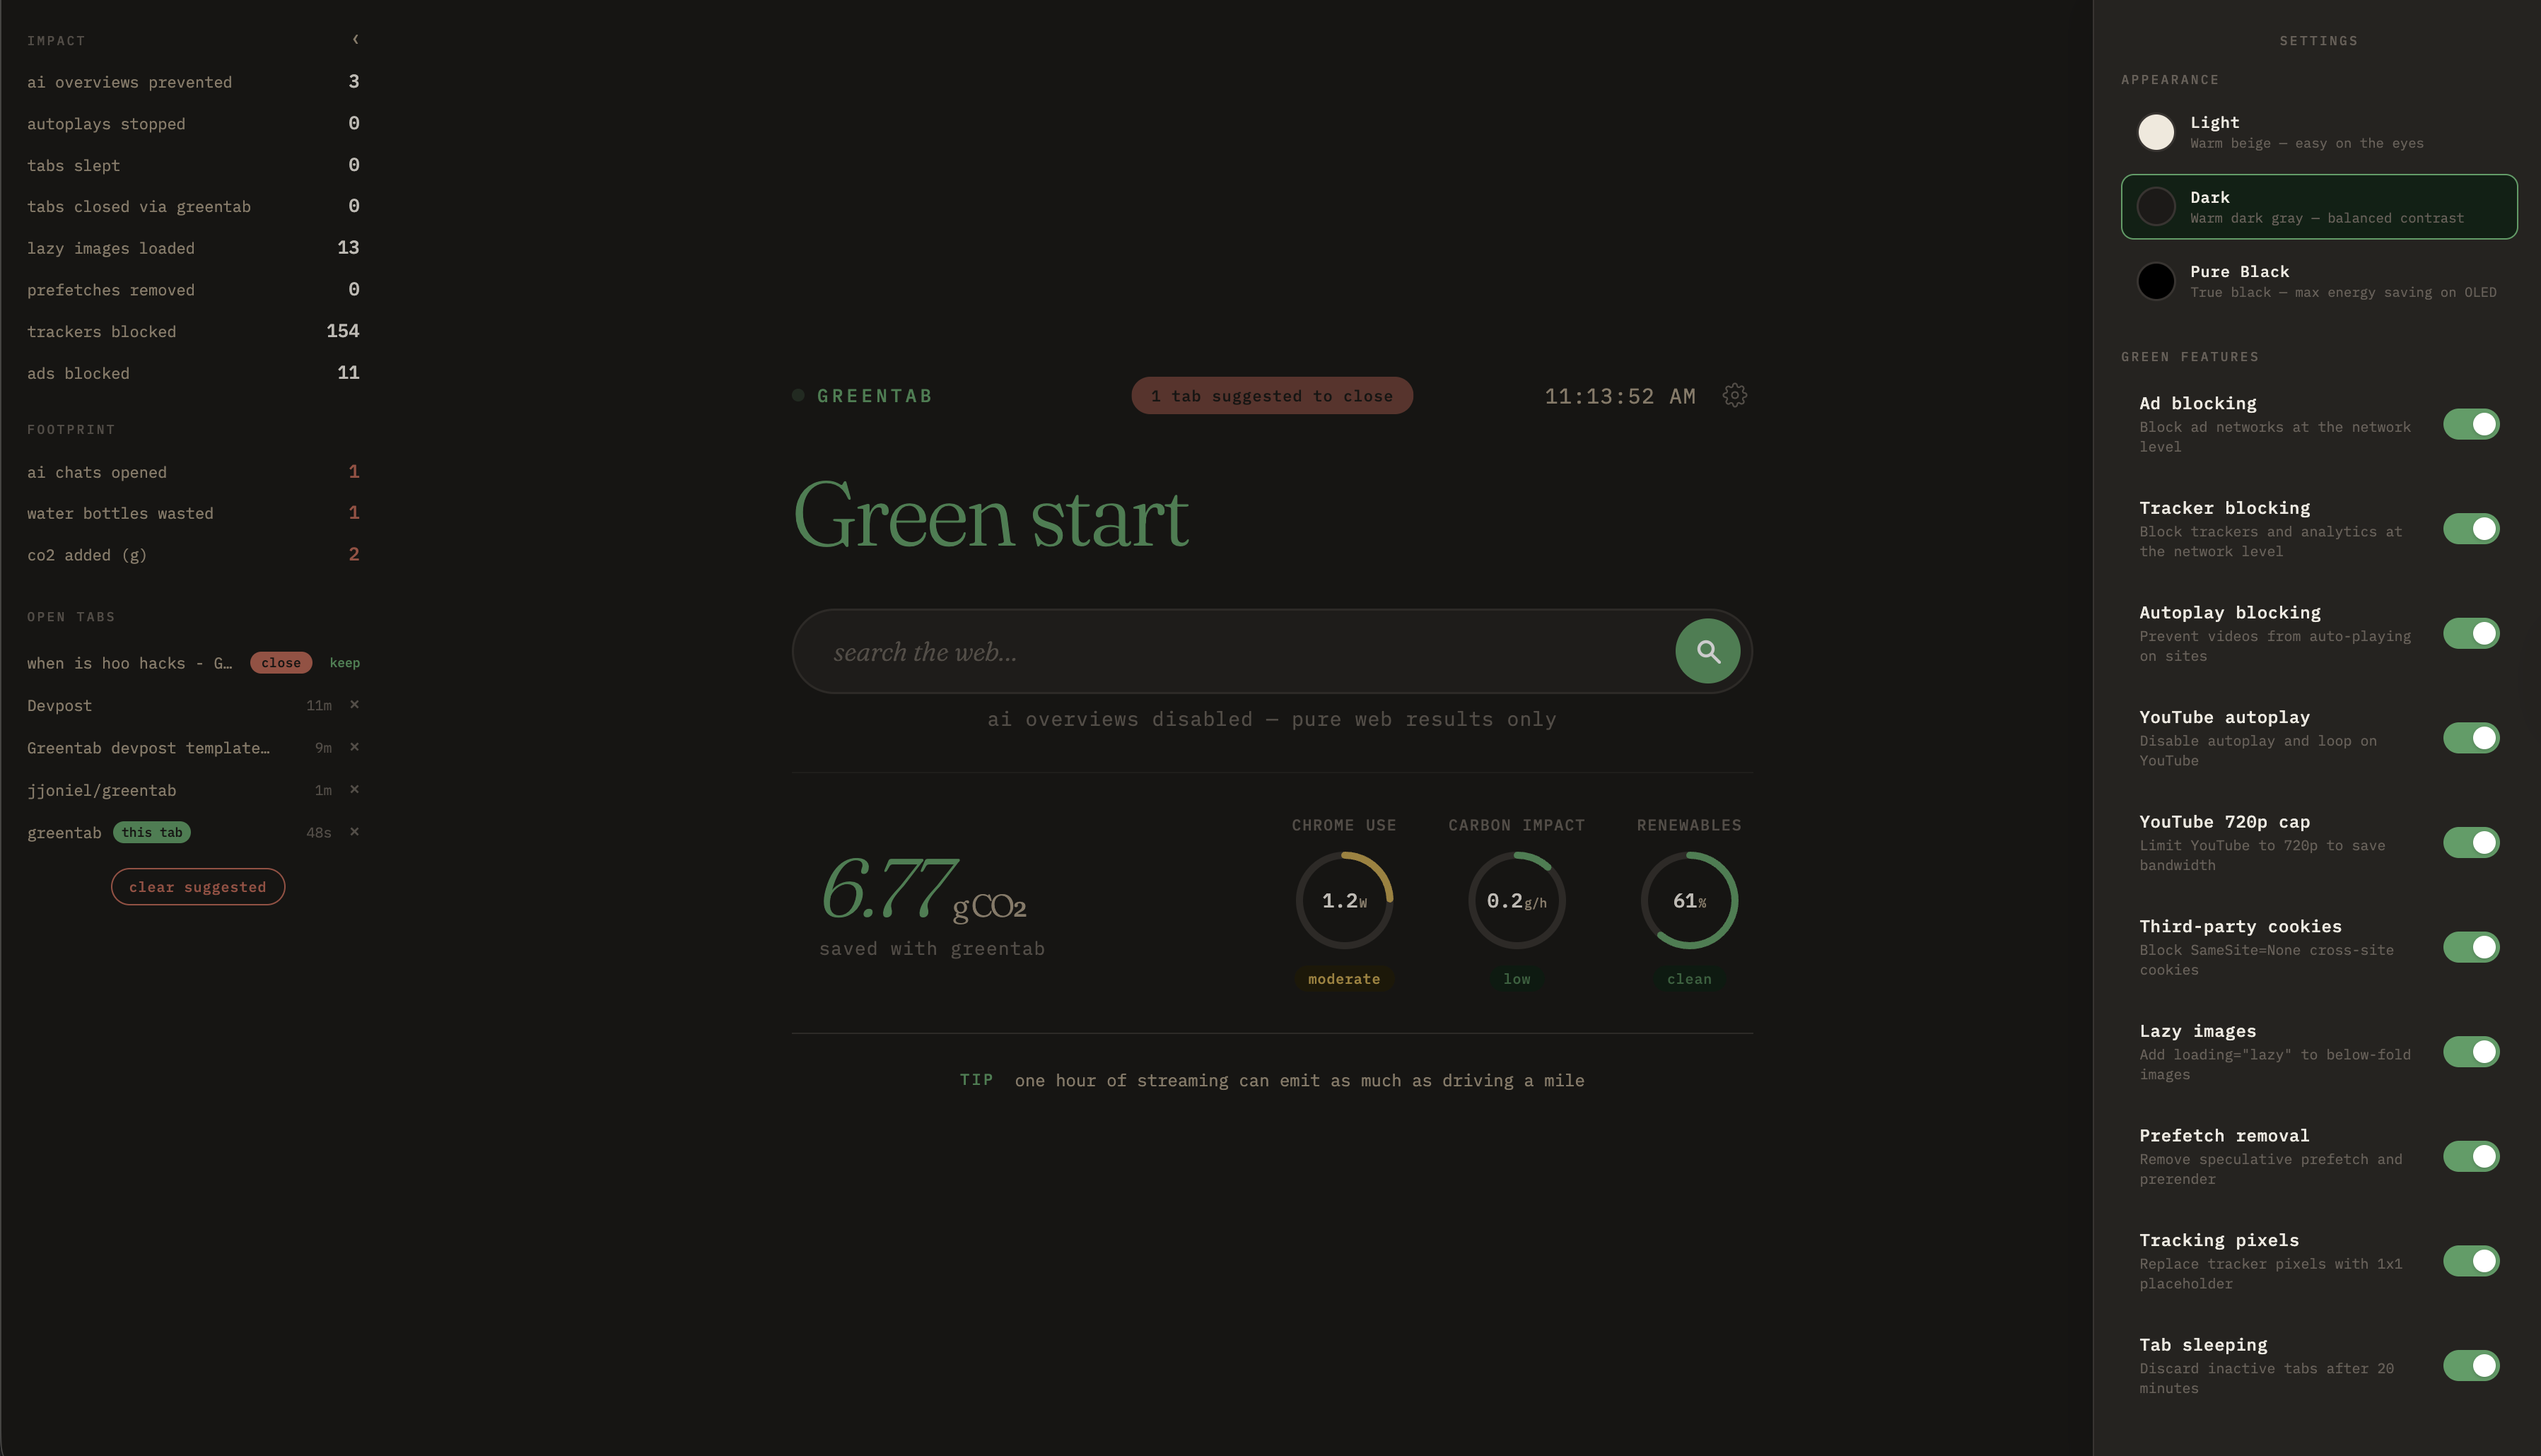
greentab settings
inspiration
every tab you open, every autoplay video, every ad that loads. it all burns energy. quietly, invisibly, in data centers you never see.
streaming alone accounts for roughly 1% of global co₂ emissions. ai-powered search results have added a new layer of energy-hungry computation to even the most basic google searches. but there was no tool doing anything about it passively, at the browser level, without asking you to change your habits.
greentab started from one question: what if your new tab page was reducing your carbon footprint every time you opened a browser?
what it does
greentab replaces your new tab page with a calm dashboard while quietly running energy-saving features in the background. everything it does gets translated into estimated co₂ savings, shown live.
ai-free search routes searches through google without triggering ai overviews, skipping the ~0.8g co₂ per inference they require
ad & tracker blocking blocks ads and trackers at the network level before they even load. each blocked ad saves ~0.5g co₂
autoplay blocking stops videos from autoplaying across any site. each prevented autoplay saves ~2g co₂ based on iea streaming data
tab sleeping automatically suspends tabs inactive for 20+ minutes, freeing up cpu and memory
lazy loading & prefetch removal stops your browser from quietly downloading images and pages you never actually visit
youtube quality cap caps youtube at 720p to cut bandwidth and encoding energy
ai usage tracker shows how much time you're spending on ai platforms like chatgpt, claude, and gemini
live carbon grid data displays real-time renewable percentage and carbon intensity for your electricity grid
what we're proud of
the co₂ estimates are sourced from iea data and published research, not made up. the math is transparent and broken down by action type, not greenwashing hand-waving.
everything runs locally. no servers, no accounts, no analytics.
the pure black theme saves meaningful display energy on oled screens on top of everything else.
and honestly, the dashboard is actually pleasant to look at. carbon tracking shouldn't feel like guilt. it should feel calm.
what's next
live electricity maps api integration for real-time regional grid data, monthly co₂ reports with real-world equivalencies, firefox support, and per-site breakdowns showing which sites cost the most energy. the foundation is already built, it's just a matter of connecting the pieces.

Log in or sign up for Devpost to join the conversation.