-
-
-
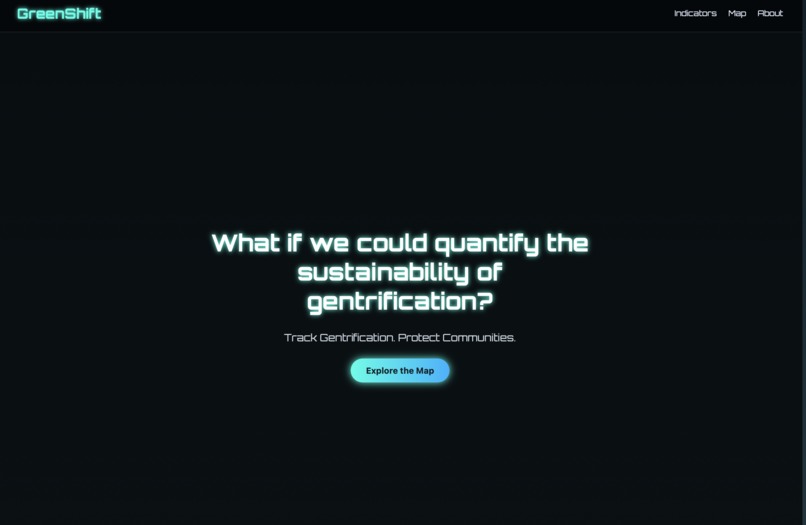
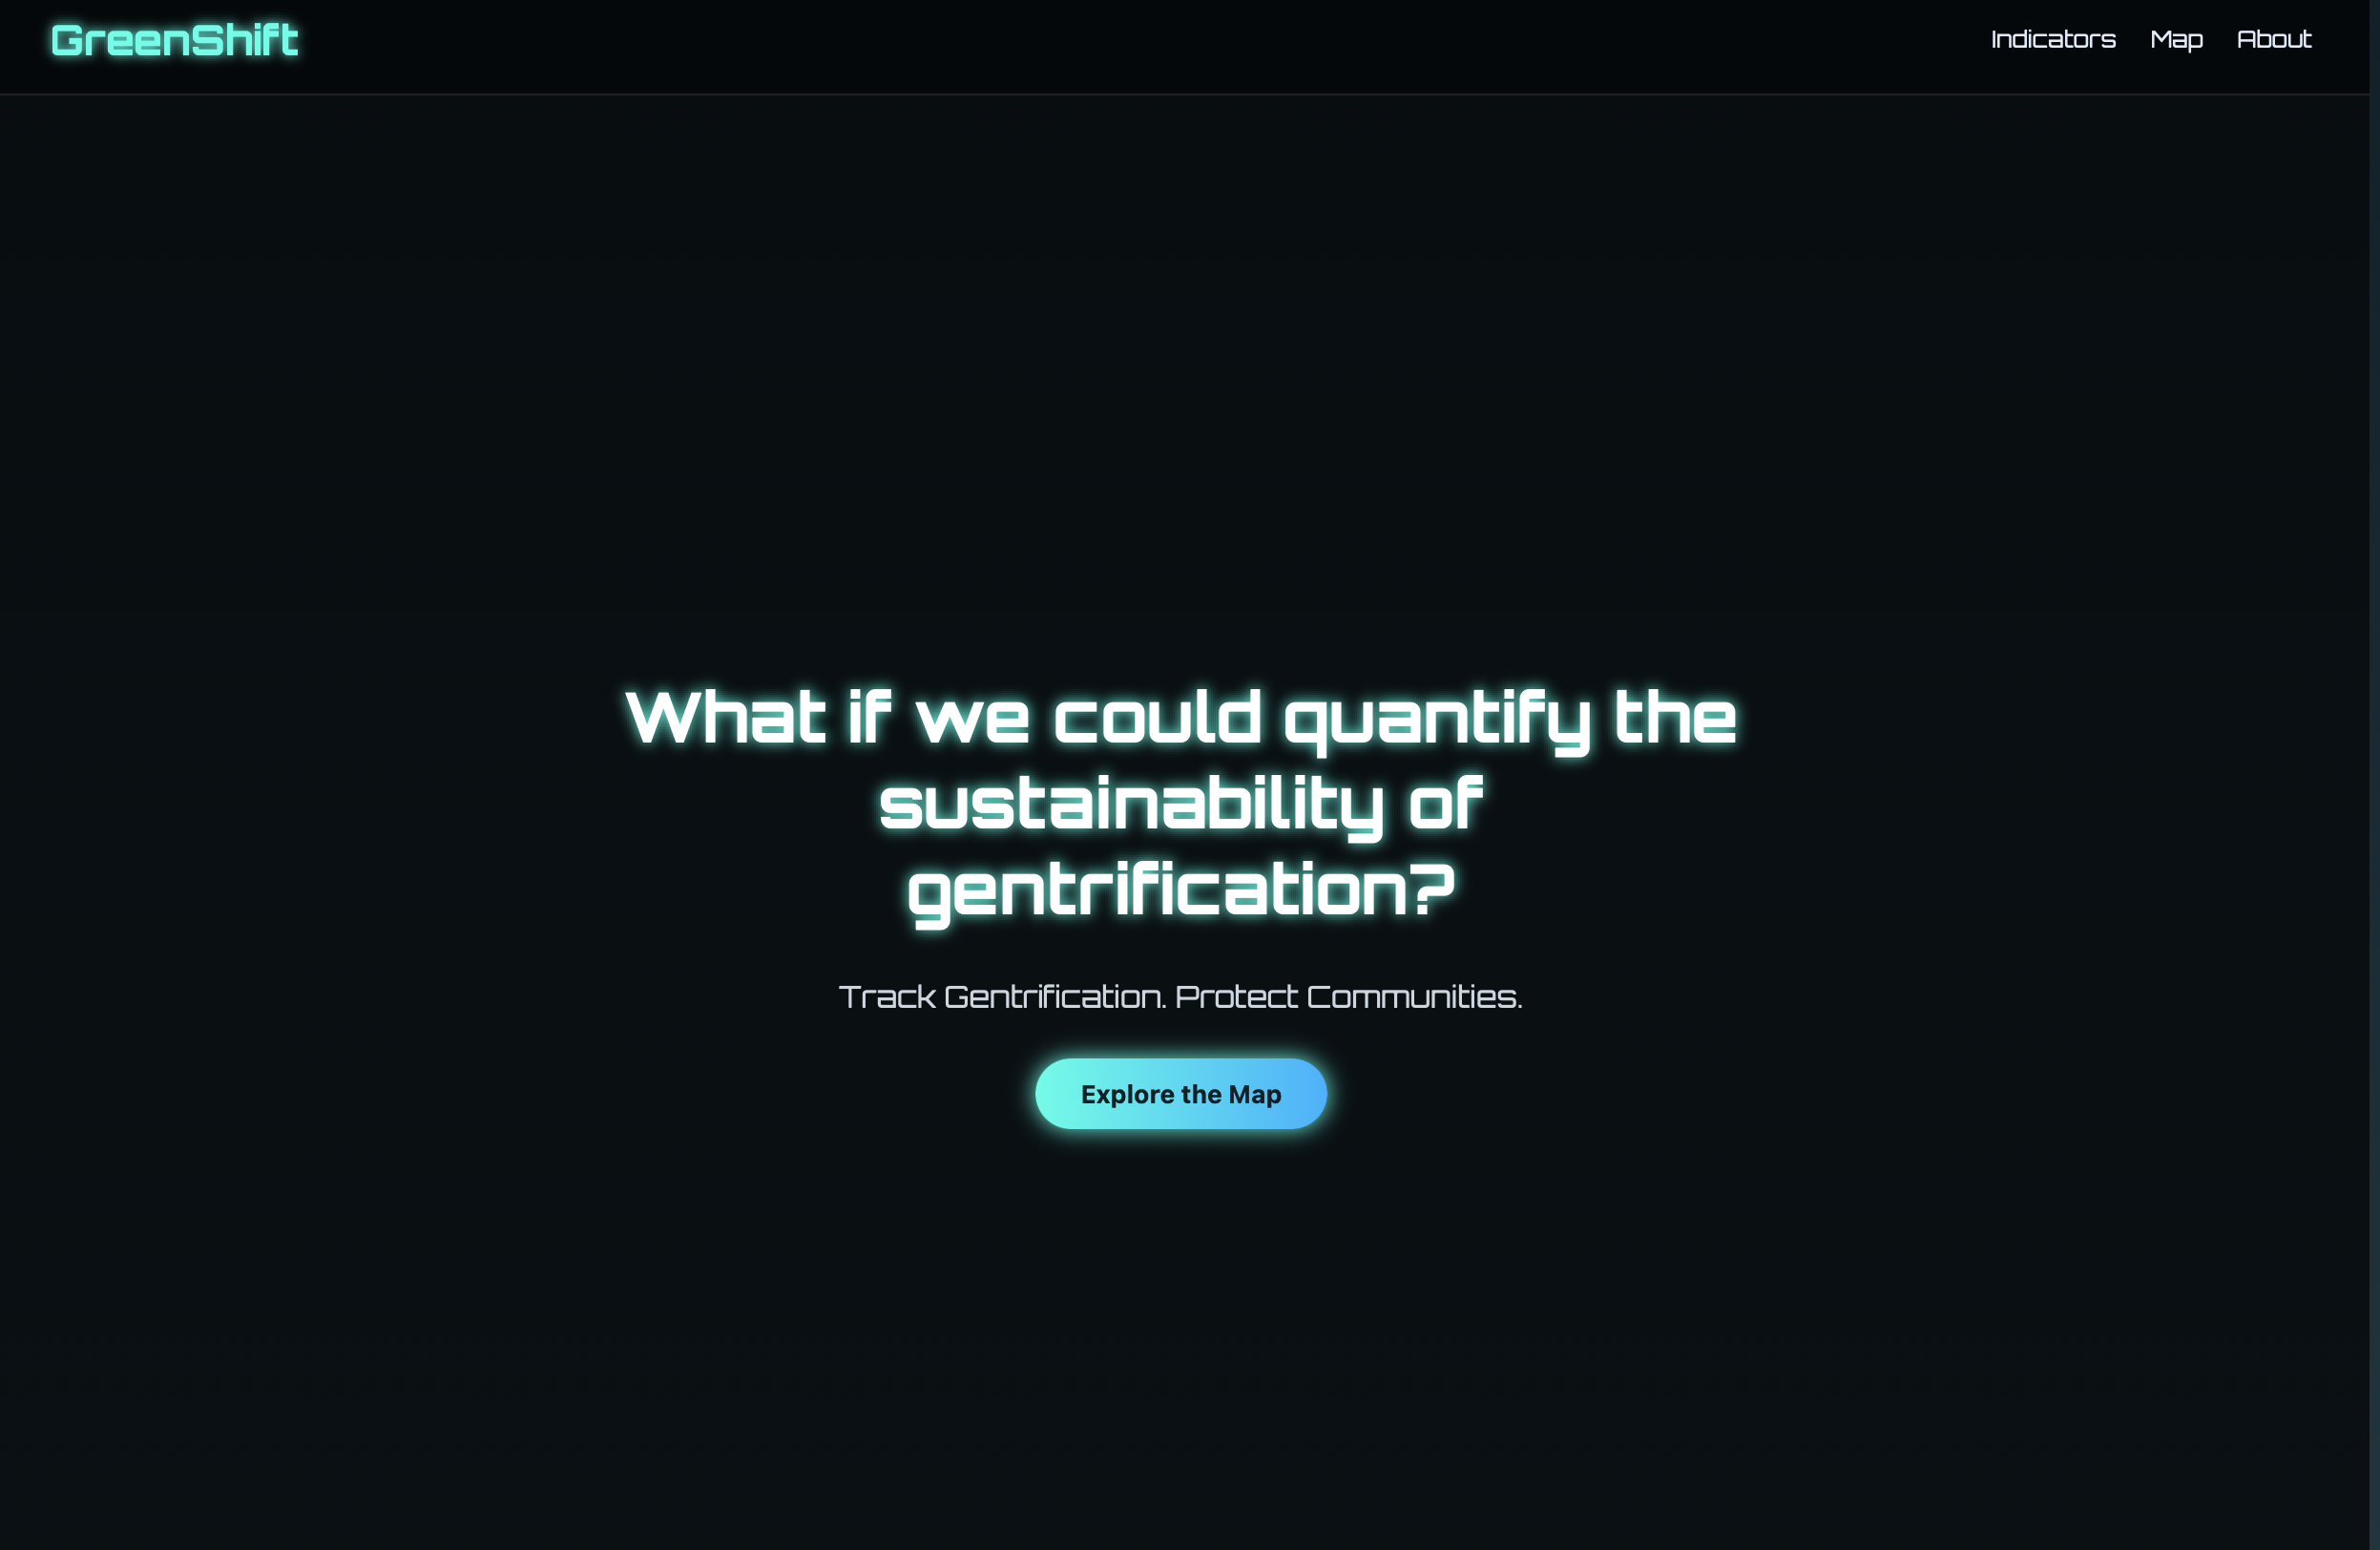
Landing Page
Inspiration
Gentrification often brings rapid urban development—but it can also displace long-standing communities and increase carbon emissions through construction, infrastructure strain, and loss of green spaces. We asked ourselves: "What if we could quantify the sustainability of gentrification?"
Inspired by the intersection of climate justice and urban equity, we created GreenShift, a tool to help identify which neighborhoods are at risk of unsustainable gentrification—so that policymakers, developers, and communities can make smarter, more just decisions.
What it does
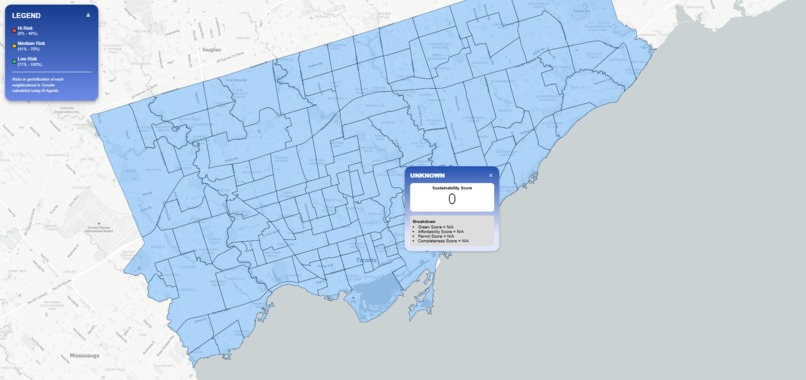
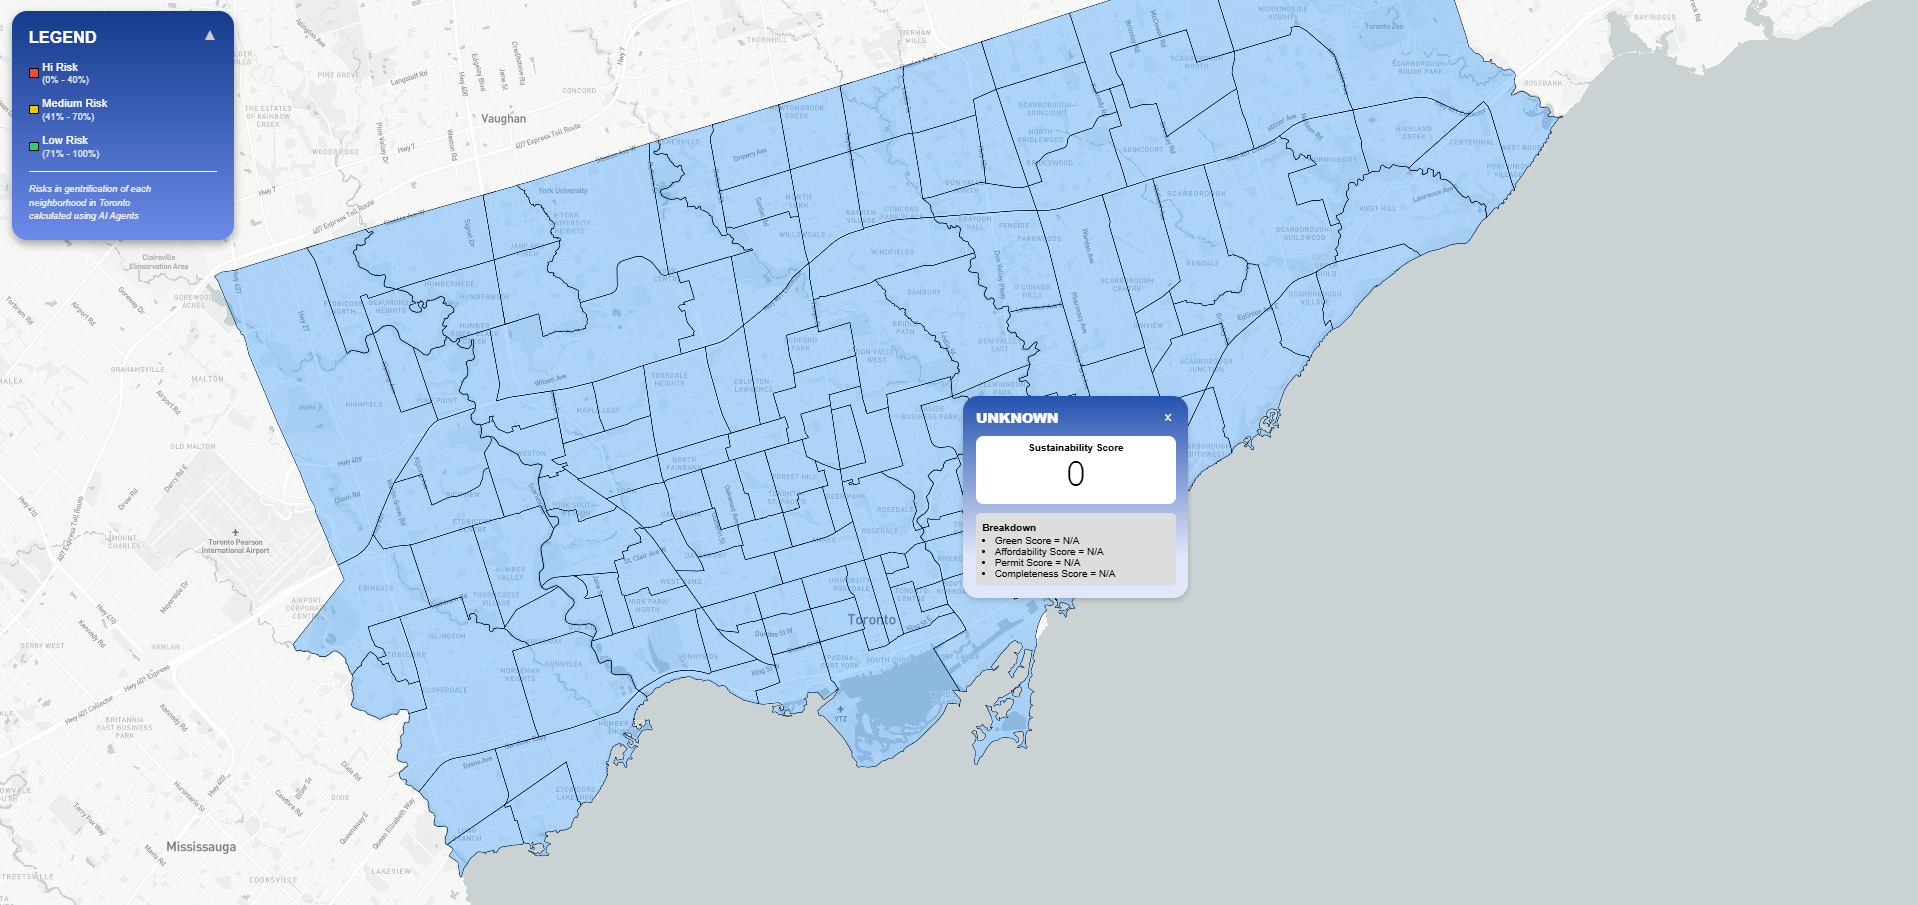
GreenShift calculates a Sustainability Score for Toronto neighborhoods based on four key indicators:
🌱 Green Score — % of green space per area
🏘️ Affordability Score — rent increases relative to median income
🏗️ Permit Score — concentration of building permits as a proxy for development pressure
✅ Completeness Score — data availability/coverage for reliability
The higher the score, the more sustainable and resilient the neighborhood is—lower scores indicate areas at risk for carbon-intensive and inequitable development.
We also classify neighborhoods into risk levels—High, Moderate, or Low—based on their sustainability score.
How we built it
Frontend: React for a clean, responsive UI. Backend: Flask API serving sustainability scores from preprocessed data. Data Pipeline: Used datasets from Toronto Open Data, StatsCan, and Urban Data Centre. Processed and normalized metrics using Python and gemini api to predict the risk of gentrification and its sustainability score.
Challenges we ran into
🔗 Data inconsistency: Datasets were in different formats and units; aligning neighborhood names and boundaries was time-consuming. 📊 Incomplete data: Some areas lacked full records for permits or income; we had to implement a “completeness” metric to grade data reliability. 🌐 Cross-stack communication: Getting React and Flask to talk smoothly took trial and error, especially when deploying locally. ⚖️ Balancing indicators: We had to thoughtfully assign weights to make sure no single factor overpowered the others.
Accomplishments that we're proud of
Built a full-stack application that translates real-world data into actionable insights. Created a scoring model that blends environmental and social justice metrics. Designed a simple, intuitive API that can scale or integrate into other tools. Initiated a discussion on the carbon impact of gentrification—a topic rarely quantified.
What we learned
How to merge open datasets with real-world policy concerns. How to use Flask and React in tandem effectively. The importance of communicating data visually and transparently. That sustainability is not just about the environment—it’s also about people, place, and power.
What's next for GreenShift
📍 Interactive map interface to explore scores by neighborhood. 🧠 AI-driven risk prediction using historical trends and new developments. 📡 Live data feeds for permit applications and housing changes. 🧩 Integration with city planning tools or sustainability dashboards. 🌎 Expanding beyond Toronto to other cities facing similar challenges.

Log in or sign up for Devpost to join the conversation.