-
-
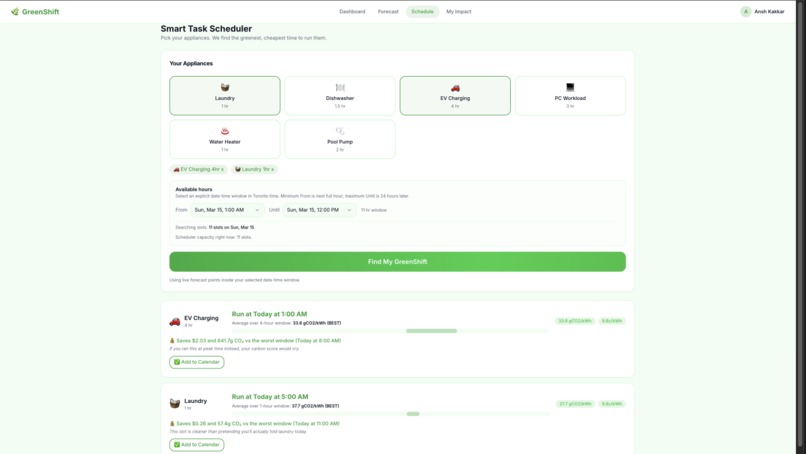
Scheduling
-
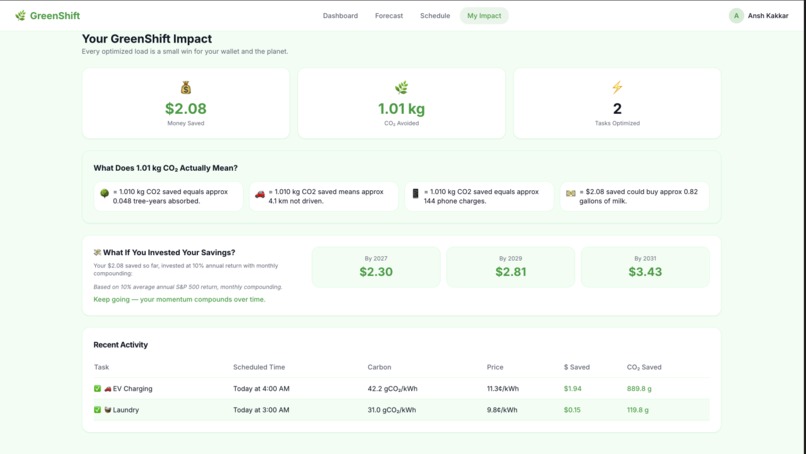
Impact
-
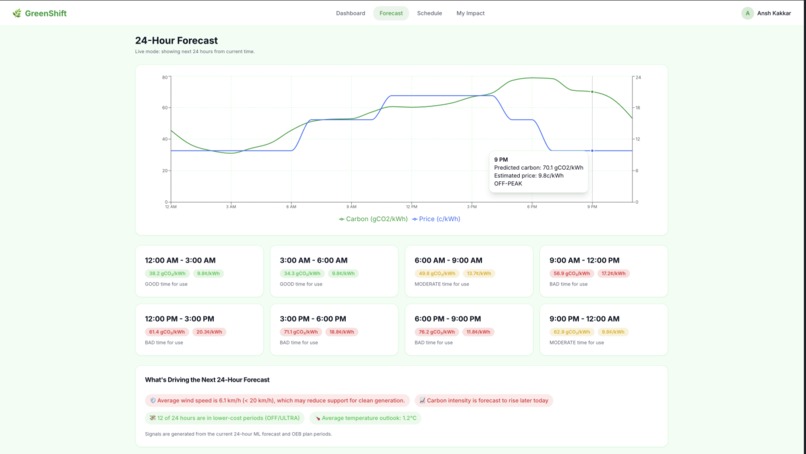
Forecast Page
-
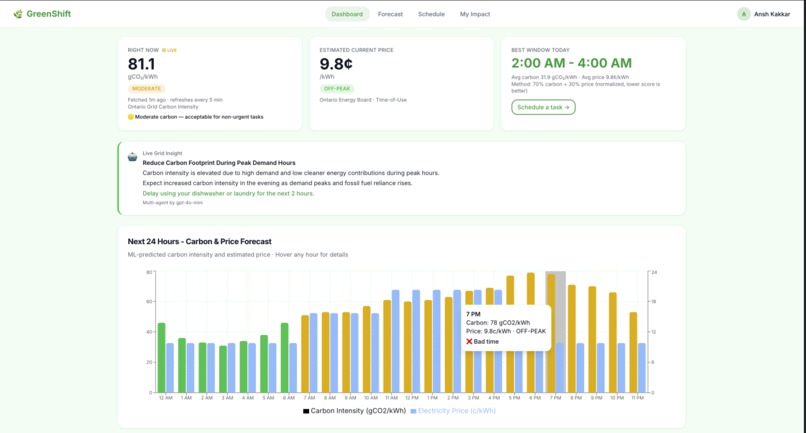
Main Dashboard
GreenShift
By Ansh Kakkar — GenAI Genesis 2026
Inspiration
Lately, it feels like everybody is constantly being asked to choose between affordability and sustainability. We want to live greener lives, but when housing, bills, and daily costs keep rising, it is hard to make "greener" choices if it is also the more expensive one. That is what inspired me to build GreenShift. Using machine learning with Independent Electricity System Operator (IESO) electricity data, weather data, and AI, I created a platform that predicts Ontario’s carbon intensity and electricity price for the next 24hours in real-time, then helps users schedule tasks like dishwashing, EV charging and laundry at cleaner and more affordable times. My goal was to show that sustainability does not always have to mean spending more, sometimes it can mean using better information to SAVE MORE!
What It Does
The main features of GreenShift include the following...
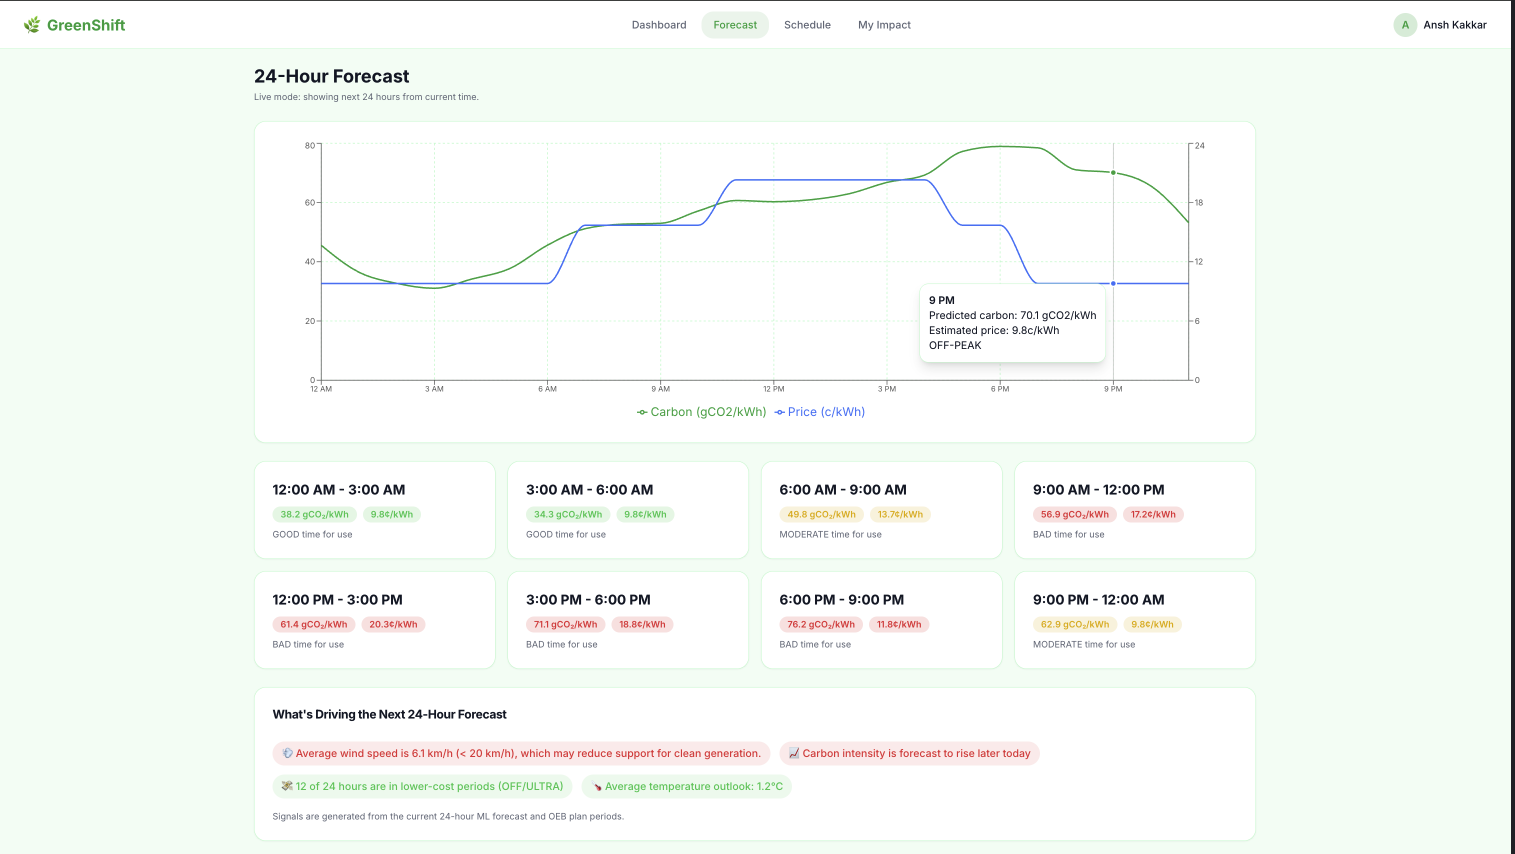
⚡ Live Forecast Dashboard
Using my own trained machine learning model, you can see the next 24 hours of carbon (gCO₂/kWh) and price (¢/kWh) in real time. A 3-agent AI pipeline using Railtracks explains WHY the grid looks the way it does giving you insights on the current Carbon intensity.
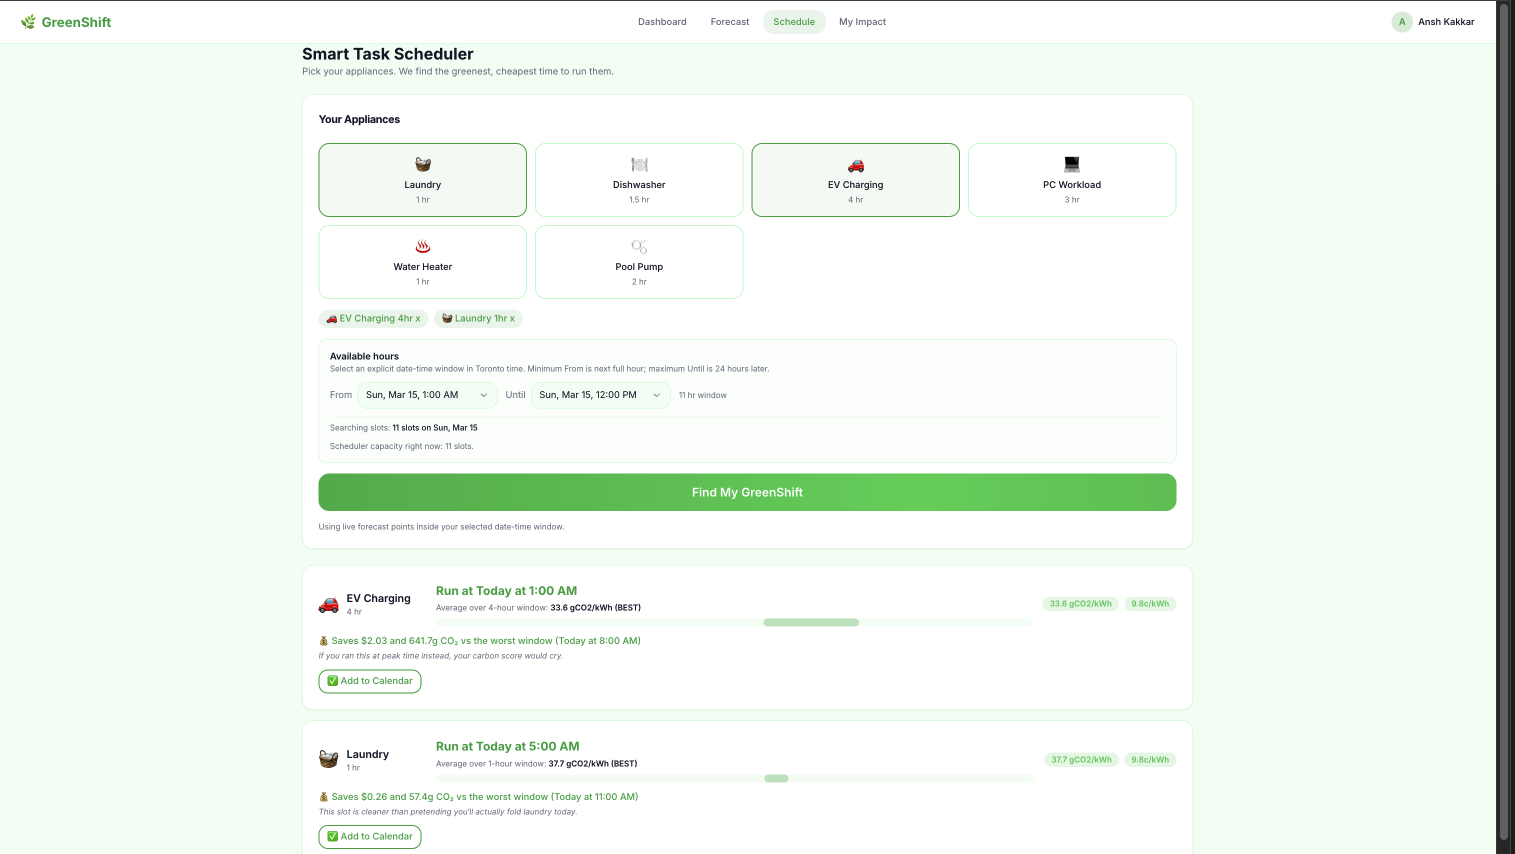
🗓️ Smart Task Scheduler
Pick your appliances (laundry, EV charging, dishwasher, and more) and set your available time window. GreenShift's weighted optimizer slides across every candidate hour and finds the contiguous window with the lowest combined carbon and price score. It shows you exactly how much money and CO₂ you save vs the worst available time. This allows you to plan your chores, thinking about affordability and the environment.
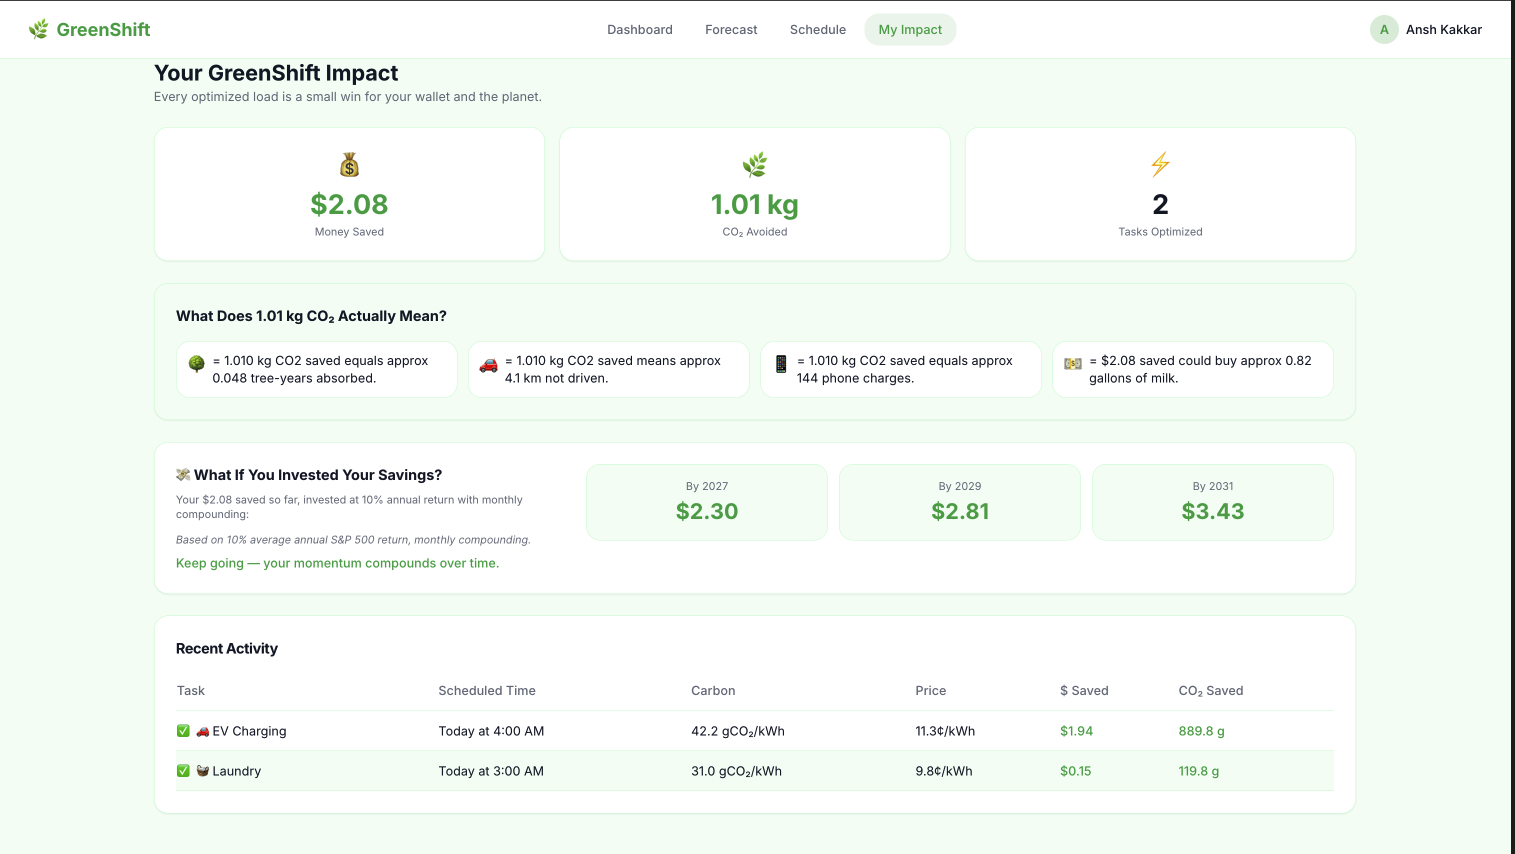
🌿 Real-Time Impact Tracker
Every committed task is saved to your personal activity log. Your total money saved, CO₂ avoided, tasks optimized, and AI-generated real-world equivalencies (trees planted, km not driven, phone charges).
How I built it
Machine Learning Model
Without the machine learning model, neither the data nor the 24h carbon-intensity predictions on the website would be possible. So, how did I build it?
Data Collection
Two independent sources were collected and merged into a single hourly dataset spanning January 2022 → December 2025
1. Ontario Independent Electricity System Operator (IESO) Grid Data: With the gridstatus Python library
Pulled directly from IESO's public reports at
reports-public.ieso.ca. Each row shows us how much MegaWatts (MW) was used by different sources for each hour. The fuel types include (Nuclear, Hydro, Wind, Solar, Gas, BioFuel and OTHER).
2. Toronto Weather Data: After the IESO I needed weather data through the Open-Meteo historical archive API. The two factors I took of data included the hourly temperature (°C) and wind speed (km/h) for Toronto over the same date range. Weather explains a large share of carbon variance:
- High temperature → more AC → gas peakers fire → dirty grid
- High wind speed → more wind generation → cleaner grid → lower carbon intensity
3. Feature Engineering: After merging both IESO and weather data on their timestamp, 14 features were built for the model
- Carbon Intensity: The target variable of how "dirty" Ontario's grid is at any given hour. Each fuel source emits a different amount of CO₂ per unit of electricity. Ex: Gas emits 415 gCO₂/kWh , Biofuel Emits 230 gCO₂/kWh etc. For each hour, we take every fuel's MegaWatt (MW) output (recall from IESO data), multiply it by its emission factor, sum it all up, then divide by the total MW generated that hour. You can see this inside
MachineLearning/data/DataCollection.ipynb. - Lag features: Carbon is repetitive. Yesterday's 6PM looks a lot like today's 6PM:
carbon_lag_24h— carbon 24 hours agocarbon_lag_48h— carbon 48 hours agocarbon_lag_168h— same hour last week
- Time features: Demand shifts by hour and season. Used sin/cos for hour and month because hour 23 (11PM) and hour 0 (midnight) are only 1 hour apart, but as raw numbers they look like they're 23 apart. Sin/cos wraps the scale into a circle so the model correctly understands they're neighbours.
hour_sin,hour_cos,month_sin,month_cosday_of_week,is_weekend,is_holiday
Model Training
The model is trained inside MachineLearning/RegressionModel.ipynb.
Algorithm: XGBoost Regression XGBoost (Extreme Gradient Boosting) builds 500 sequential decision trees, where each tree corrects the mistakes of the one before it. It handles the non-linear relationship between gas dispatch, weather, and carbon intensity far better than a simple linear regression would.
Train/Test Split: For this I used 80% of data for training (27,879 rows) and 20% for testing (6970)
Evaluation:
| Metric      | Score          | What it means                                       |
| ----------- | -------------- | --------------------------------------------------- |
| MAE         | 12.09 gCO₂/kWh | On average, predictions are off by ~12 gCO₂/kWh     |
| R²          | 0.8299         | The model explains 83% of carbon intensity variance |
| Adjusted R² | 0.8296         | Penalizes irrelevant features, higher is GOOD!      |
Use of Railtracks / Railtown
The full pipeline lives in backend/services/grid_insight_service.py and the route is at backend/routes/grid_insight_route.py. This backend API is called on src/pages/Dashboard.tsx
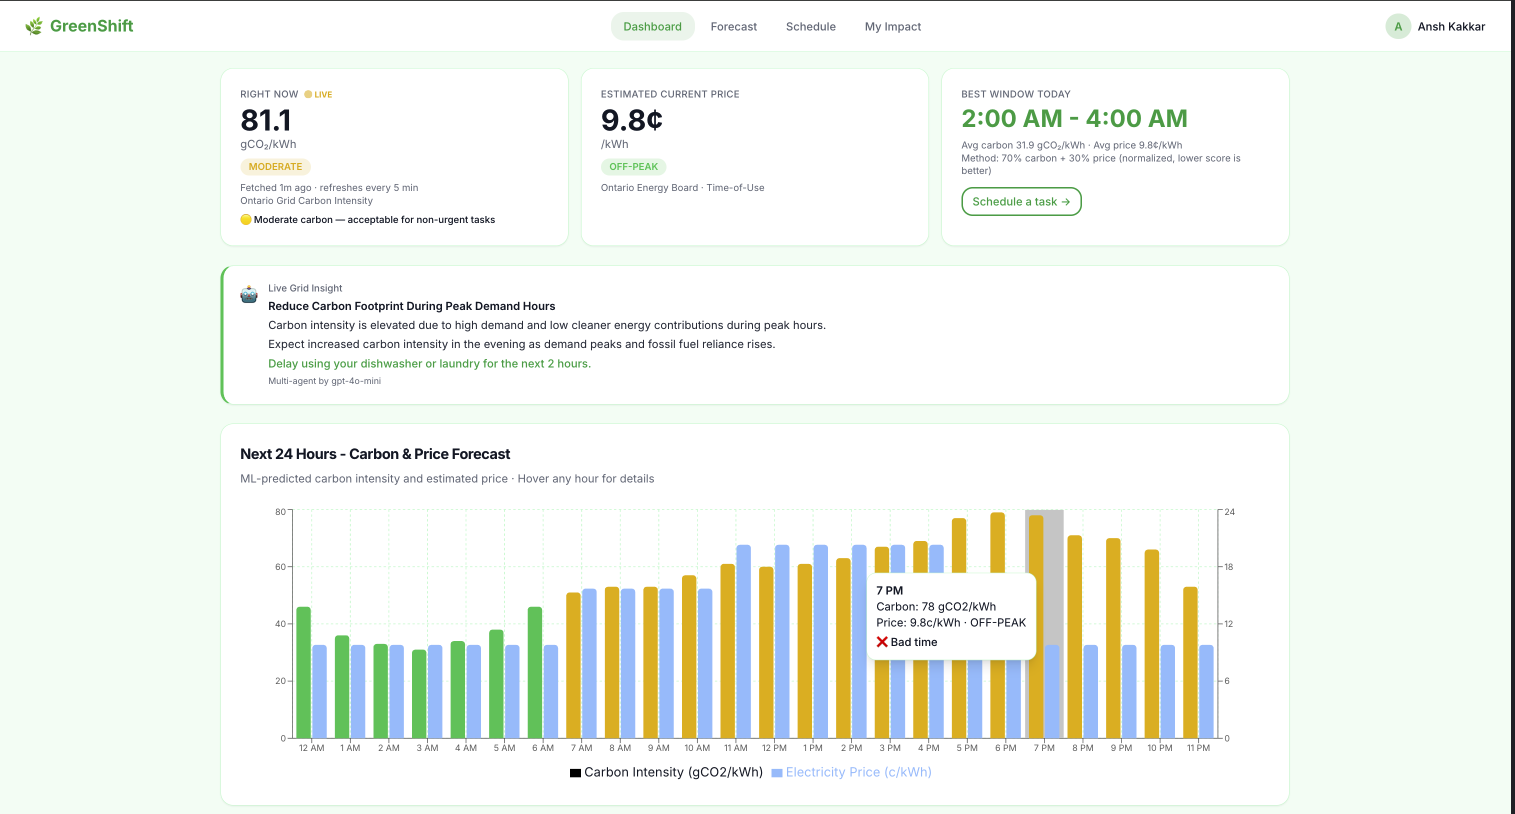
GreenShift uses Railtracks to run a 3-agent pipeline powered by GPT-4o-mini, visible on the live Dashboard as the "Grid Insight" card.
Three agents run in order, each with a single focused job:
- OntarioGridAnalyst — reads the live 24h forecast (from the ML model) and explains WHY carbon is high or low right now (wind output, gas peakers etc)
- GreenShiftCoach — takes that analysis + the user's appliances and produces one specific action to take in the next 2 hours.
- GridInsightOrchestrator — polishes both outputs into one clean dashboard version to display
No single mega-prompt. Each agent only sees what it needs. Simple tasks and output, but it was nice to see how we can use multiple agents with Railtracks.
Tech Stack
Frontend
| Framework / Language | React + TypeScript |
| UI/UX | Built with Lovable |
| Styling | Tailwind CSS + shadcn/ui |
| Charts | Recharts |
| Data Fetching | TanStack Query + Axios |
Backend
| API | FastAPI + Uvicorn |
| Data Validation | Pydantic |
| Language | Python |
Machine Learning
| Model | XGBoost (xgboost==2.1.4) |
| Data Processing | pandas, numpy |
| Grid Data | gridstatus (IESO API wrapper) |
| Weather Data | Open-Meteo API via httpx / requests |
| Model Serialization | joblib |
| Holiday Flags | holidays (Ontario public holidays) |
| Evaluation | scikit-learn (MAE, R²) |
AI Agents
| Framework | Railtracks |
| LLM | GPT-4o-mini |
Challenges I ran into
Scheduling was trickier than expected to produce an optimized cost and carbon-emission plan. To calculate real savings, GreenShift needs to know how much power each appliance actually uses. Since not all users know the kWh rating for each of their appliances, I used a typical estimate per appliance (Dishwasher, Laundry, EV Charger, Pool Pump, Water Heater), all sourced and verified from ENERGY STAR data. This allowed my app to remain highly representative of real-world savings. I also had to decide on a balance of what would be considered a "good" time and a "bad time". For a good time, I considered lowering carbon emissions by 70% and costs by 30% to find a balance.
I ran into many problems making my dataset and training the model. The model did not work at first. Early training yielded a negative R², which basically means the model was so bad that guessing the average every hour would have been more accurate. The fix was adding lag features. Carbon intensity is repetitive: yesterday's 6 PM usually looks like today's 6 PM. Once I added carbon_lag_24h, rolling averages, and same-hour-last-week features, R² jumped to 0.83. Finding more relevant data to increase accuracy further would be an awesome next step too!
Lastly, the IESO and weather data used are fully real and live. The only "fixed" (still true) component is the set of emission factors used to convert MW to carbon intensity. Each fuel was assigned a standard industry average (Gas = 415 gCO₂/kWh, Biofuel = 230 gCO₂/kWh, everything clean = 0 gCO₂/kWh), based on IEA-published values. Since Ontario's grid is about 90% clean energy, carbon intensity mostly depends on how much gas is running that hour, so these values work well enough. In reality, these emission factors would vary during the day. Despite all this, my model was extremely accurate on unseen data, with an R² of 0.83 and an MAE of 12.09 gCO₂/kWh, and it can reliably identify the cleanest and most affordable hours of the day.
Accomplishments that I'm proud of
My teammate dropped at the last second, which was genuinely disappointing, but it didn't stop me. I tackled this entire hackathon solo, and honestly, I'm really satisfied with what came out of it.
The biggest win for me is having a fully working demo and not a mockup or concept with hardcoded data. I made a real full-stack app with a trained ML model serving live predictions. Integrating machine learning into a production-style web app was something I had never done end-to-end before, and getting it to work was a great learning experience.
I'm also proud that I built my own dataset from scratch using real Ontario sources (IESO + Open-Meteo) instead of grabbing something off Kaggle. It was harder, but it taught me far more about working with data and feature engineering.
On the engineering side, the entire web app was built with scalability in mind, proper routes, services, utils, helpers, schemas and components all structured intentionally. I didn't just generate everything and hope for the best. I used proper context engineering, set up the architecture myself and made decisions about how each piece fits together. I couldn't have moved this fast without my best friend Claude Sonnet 4.6 by my side the whole way. 🤝
Lastly, I think this idea I have is unique. Data on when to use electricity and pricing (Hydro Ottawa, Toronto) is available in super-confusing, long tables that nobody has time to read. GreenShift is the first web app that uses ML predictions into an actionable plan, so anyone can live greener with zero extra effort. No other app will provide the perfect balance between thinking about affordability and sustainability!
What I learned
I learned what it actually takes to bring machine learning into a full-stack production app. Training a model in a notebook is different from wiring it into an API that a real frontend will use. Also, building my own dataset from raw Ontario sources taught me far more than grabbing something off Kaggle ever would have. It taught me far more about working with data and feature engineering. I also learned how to use Generative AI effectively as a collaborator, not just a code generator. I used proper context engineering to keep a large codebase organized throughout the entire build.
What's next for GreenShift
GreenShift has a strong foundation, but there's a lot left to build. Allowing users to enter their exact appliance wattage would make savings estimates far more personalized than the current ENERGY STAR averages in Scheduling. I would love to expand the data to other provinces, as our model is currently trained on Toronto weather and fuel_type data. A cool feature I'd love to implement is a green home technology education hub that teaches users about upgrades like heat pumps and solar panels. Lastly, I would like to add real user accounts to log impact across sessions.
Built With
- axios
- fastapi
- machine-learning
- numpy
- openai
- pandas
- pydantic
- python
- railtracks
- react
- react-query
- recharts
- sklearn
- tailwind-css
- typescript
- unsupervised-learning
- uvicorn
- xgboost


Log in or sign up for Devpost to join the conversation.